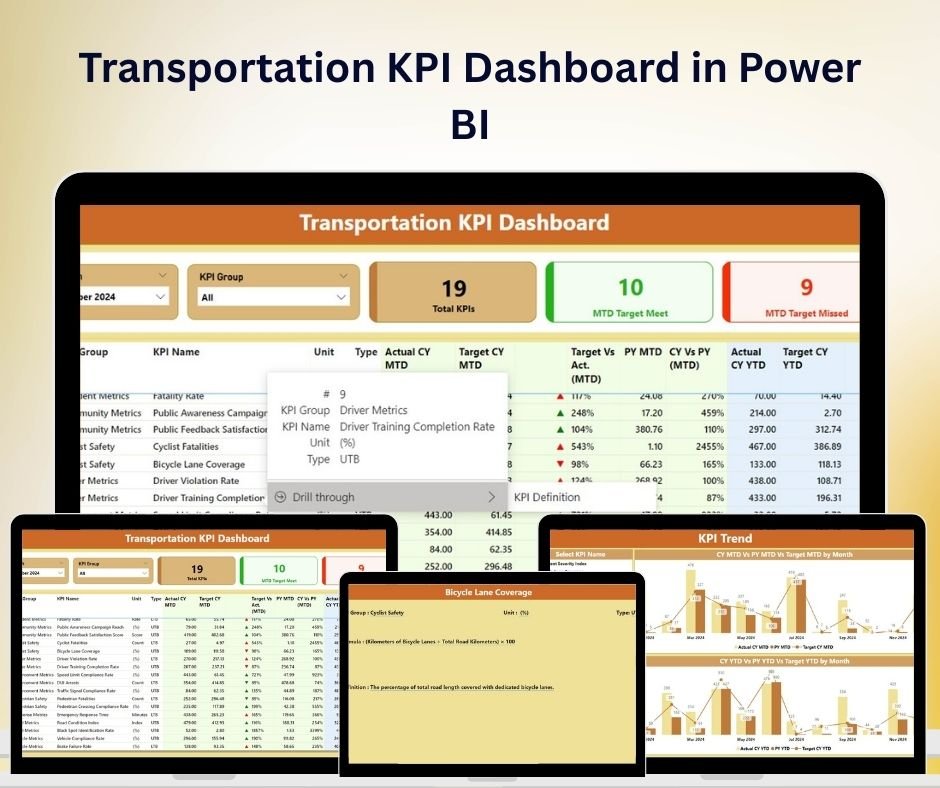


The Transportation KPI Dashboard in Power BI is an all-in-one, user-friendly solution for transportation managers, analysts, and logistics teams to monitor and manage key performance indicators (KPIs) effectively. This dashboard allows businesses to streamline operations, enhance decision-making, and optimize transportation logistics through a visually interactive Power BI interface.
With the growing complexity of transportation and logistics management, staying on top of KPIs like cost per mile, delivery performance, fleet efficiency, and customer satisfaction is more important than ever. The Transportation KPI Dashboard is designed to help you track real-time data, visualize trends, and quickly identify areas for improvement. By having a centralized location for all transportation metrics, you’ll be able to drive better business outcomes, improve fleet performance, and ensure timely deliveries.

Key Features of the Transportation KPI Dashboard in Power BI:
📊 Comprehensive Performance Metrics Track essential transportation KPIs with real-time data updates, such as:
-
Cost per Mile – Monitor the cost efficiency of each trip.
-
Fleet Utilization Rate – Track the usage efficiency of your fleet.
-
Delivery Performance – Evaluate on-time delivery rates and delays.
-
Fuel Efficiency – Analyze fuel consumption for cost-saving insights.
-
Customer Satisfaction – Gauge customer feedback to assess service quality.
🛠 Customizable Dashboard Views With Power BI’s dynamic features, customize the dashboard to focus on the KPIs that matter most to your business. The dashboard allows you to:
-
Select Different Time Periods – View KPIs by week, month, or year for trend analysis.
-
Interactive Filters – Drill down into specific fleet, delivery route, or driver data.
-
Visual KPI Trend Analysis – Use easy-to-read charts and graphs to understand performance trends over time.
📈 Target Setting and Comparison
-
Set clear, actionable targets for each KPI to measure performance against.
-
Compare actual data with targets to identify areas needing improvement.
-
Visualize gaps and achievements with conditional formatting like color-coded indicators.
🔄 Seamless Integration with Power BI Easily integrate your transportation data from multiple sources into the dashboard, ensuring that all of your operational data is at your fingertips. This dashboard supports:
-
Real-Time Data Feed – Get instant updates to make timely decisions.
-
Data Refresh Capabilities – Keep your dashboard up to date with automated data refresh.
-
Custom Data Sources – Integrate with different transportation systems for a comprehensive view of your operations.
📋 Why You’ll Love the Transportation KPI Dashboard in Power BI:
-
Optimize Fleet Performance – By visualizing key metrics like delivery time and fuel efficiency, you can make informed decisions to improve fleet operations.
-
Enhance Operational Efficiency – Track costs, delivery timelines, and customer satisfaction in one place, ensuring that your transportation system is running at peak performance.
-
Improve Decision-Making – Use data-driven insights to make smarter decisions and improve the bottom line of your transportation business.
-
User-Friendly – No technical expertise required. The dashboard’s intuitive design ensures that anyone can use it to track transportation performance.
-
Customizable – Tailor the dashboard to your business needs, allowing you to focus on the KPIs that matter the most to you.
📂 What’s Inside the Transportation KPI Dashboard:
-
Fleet Performance Tracking – Assess fleet utilization, maintenance, and cost efficiency.
-
Delivery Performance Metrics – Monitor on-time deliveries, delays, and route performance.
-
Fuel Efficiency Metrics – Track fuel consumption and identify opportunities for savings.
-
Cost Management – Analyze transportation costs to control and reduce expenses.
-
Customer Satisfaction Tracker – Monitor customer feedback and satisfaction scores for better service quality.
📈 How to Use the Transportation KPI Dashboard: 1️⃣ Download the Template – Instantly get access to your Power BI template upon purchase. 2️⃣ Connect Your Data – Import your transportation data from multiple sources. 3️⃣ Customize the Dashboard – Focus on the KPIs that are most important to your transportation operations. 4️⃣ Track Performance – Use real-time updates and visual indicators to monitor fleet and delivery performance. 5️⃣ Stay on Track – Continuously optimize transportation processes based on the data insights provided by the dashboard.
🎯 Who Can Benefit from This Dashboard:
-
Transportation Managers
-
Logistics & Supply Chain Teams
-
Fleet Operators
-
Business Analysts
-
Operations Managers
-
Small & Medium Businesses (SMBs)
-
Large Enterprises
Optimize your transportation operations and improve performance management with the Transportation KPI Dashboard in Power BI. Streamline decision-making and ensure better fleet management today!
Click here to read the Detailed blog post
https://www.pk-anexcelexpert.com/transportation-kpi-dashboard-in-power-bi/
Visit our YouTube channel to learn step-by-step video tutorials
YouTube.com/@PKAnExcelExpert


Reviews
There are no reviews yet.