

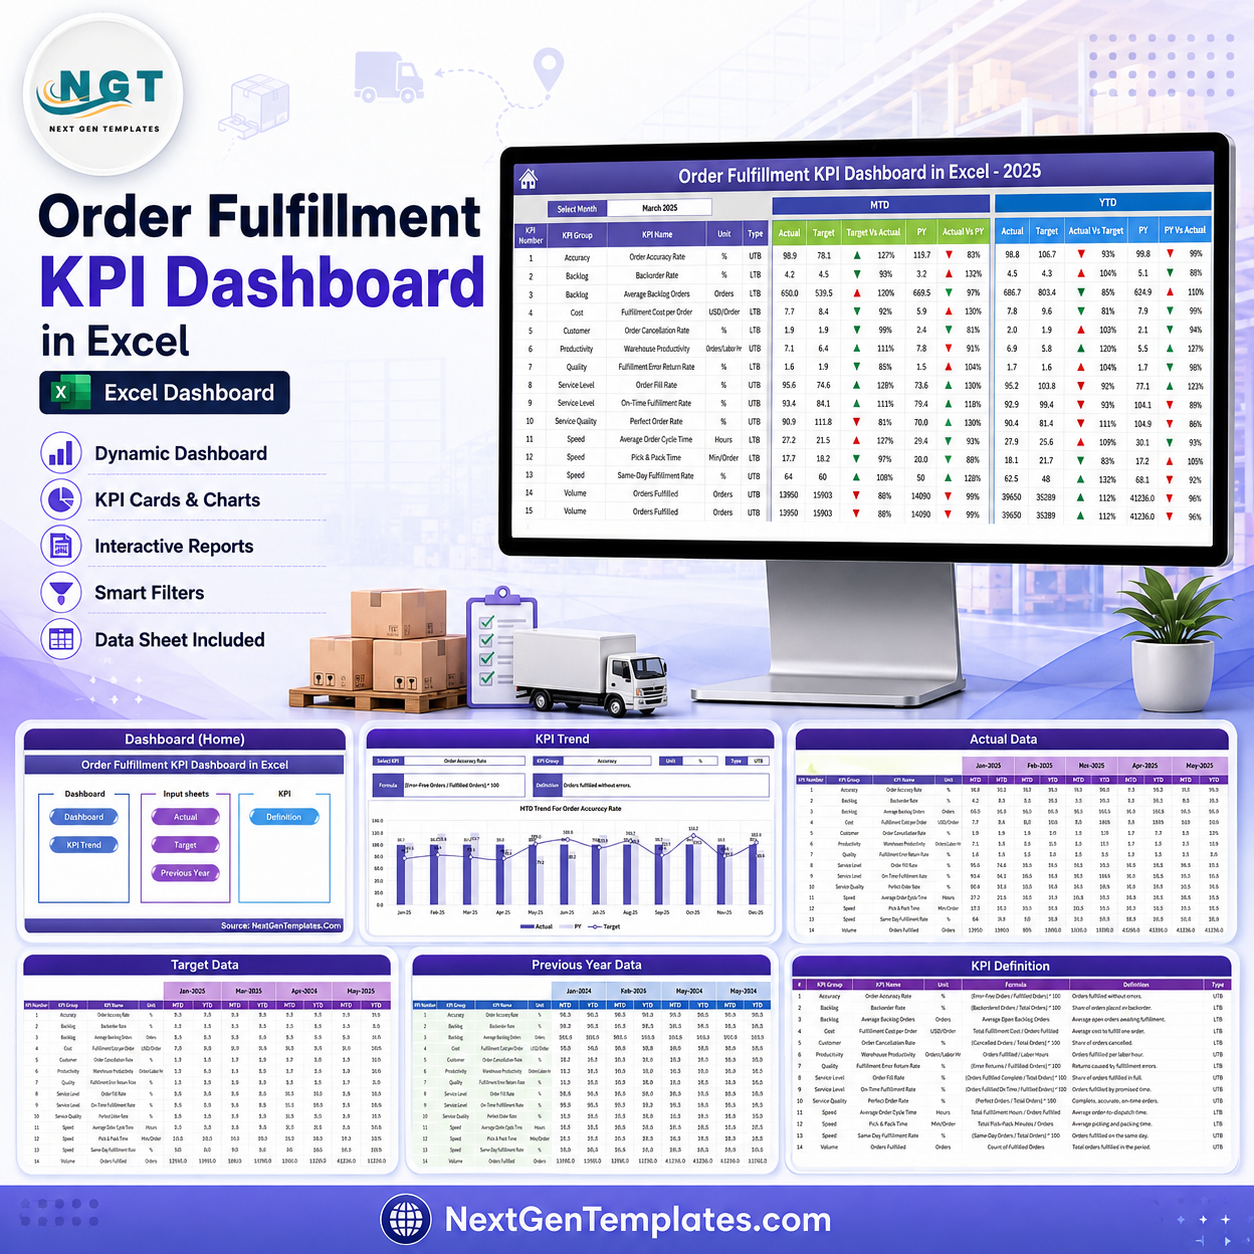

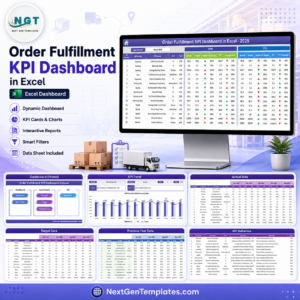
The Order Fulfillment KPI Dashboard in Excel gives operations, logistics, warehouse, and e-commerce teams a ready KPI workbook for monthly fulfillment review. The template includes 7 worksheets, a month selector, MTD and YTD views, Actual vs Target comparisons, Previous Year comparisons, and visual variance arrows, so teams can review fulfillment performance without rebuilding reports every month. Built by PK, a Microsoft Certified Professional with 15+ years of Excel experience and 300K+ tutorial subscribers, this is a one-time download with no SaaS subscription. You can replace the sample values with your own KPI numbers and keep full control of the workbook.
Key Features of Order Fulfillment KPI Dashboard in Excel
- 7 worksheet structure covering Home, Dashboard, KPI Trend, Actual Numbers Input, Target, Previous Year Number, and KPI Definition sheets.
- Month dropdown on the Dashboard sheet so all KPI numbers change for the selected reporting month.
- MTD and YTD tracking for Actual, Target, and Previous Year values.
- Target vs Actual and PY vs Actual indicators with conditional formatting arrows for quick review.
- KPI Trend analysis with selectable KPI, KPI group, unit, type, formula, definition, and trend charts.
- Editable input sheets for actuals, targets, and previous-year values.
- KPI definition library to document order fulfillment formulas, units, and performance logic.
What’s Inside the Order Fulfillment KPI Dashboard in Excel
1 – Home Sheet
The Home sheet is an index page with 6 navigation buttons. Users can jump quickly to the Dashboard, KPI Trend, Actual Numbers Input, Target, Previous Year Number, and KPI Definition sheets.
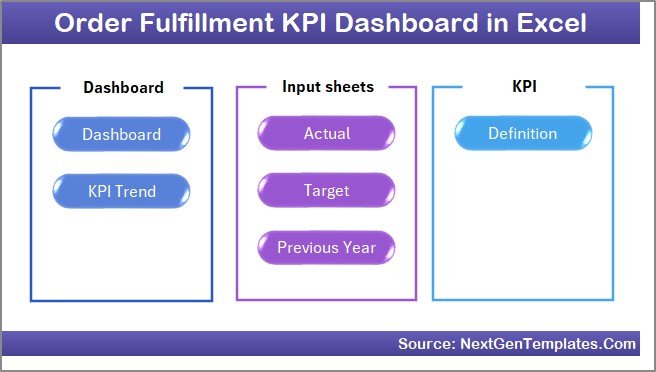
Home Sheet
2 – Dashboard Sheet
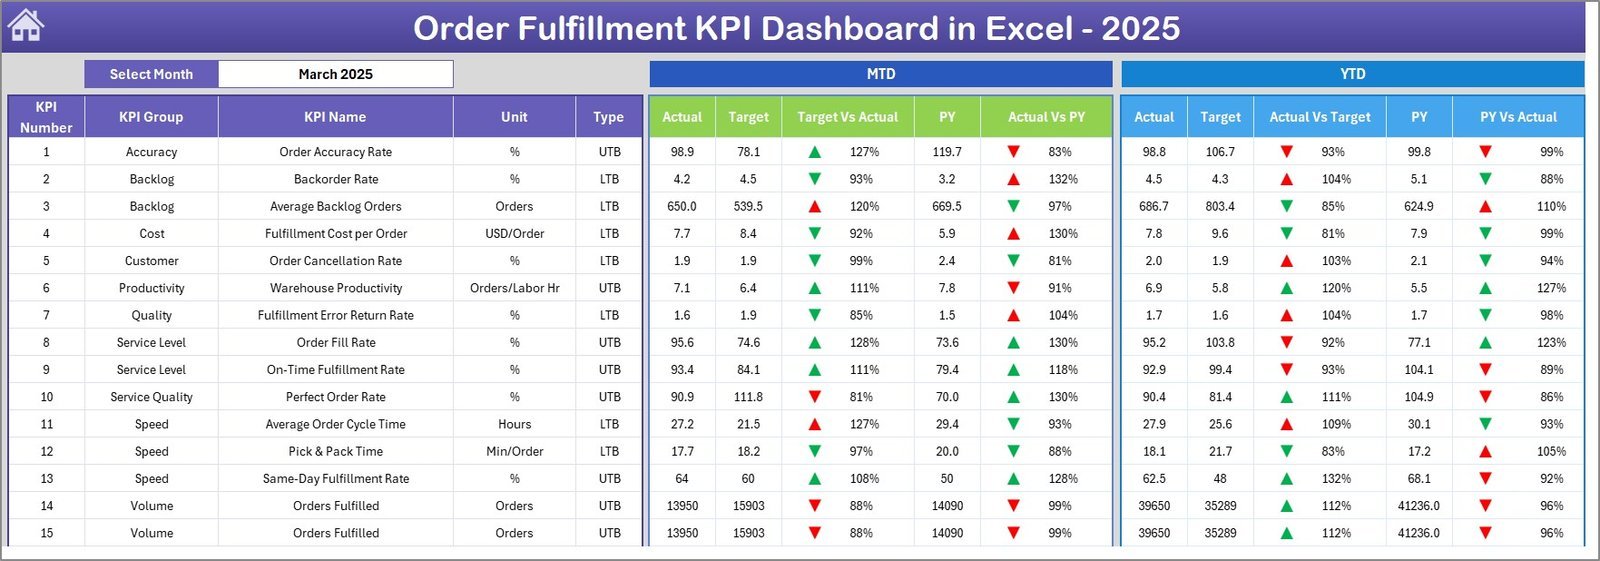
The Dashboard sheet is the main reporting page. Select a month from the dropdown in cell D3 and the dashboard updates MTD Actual, Target, Previous Year, Target vs Actual, and PY vs Actual values. It also shows YTD Actual, Target, Previous Year, and variance indicators for longer-term tracking.
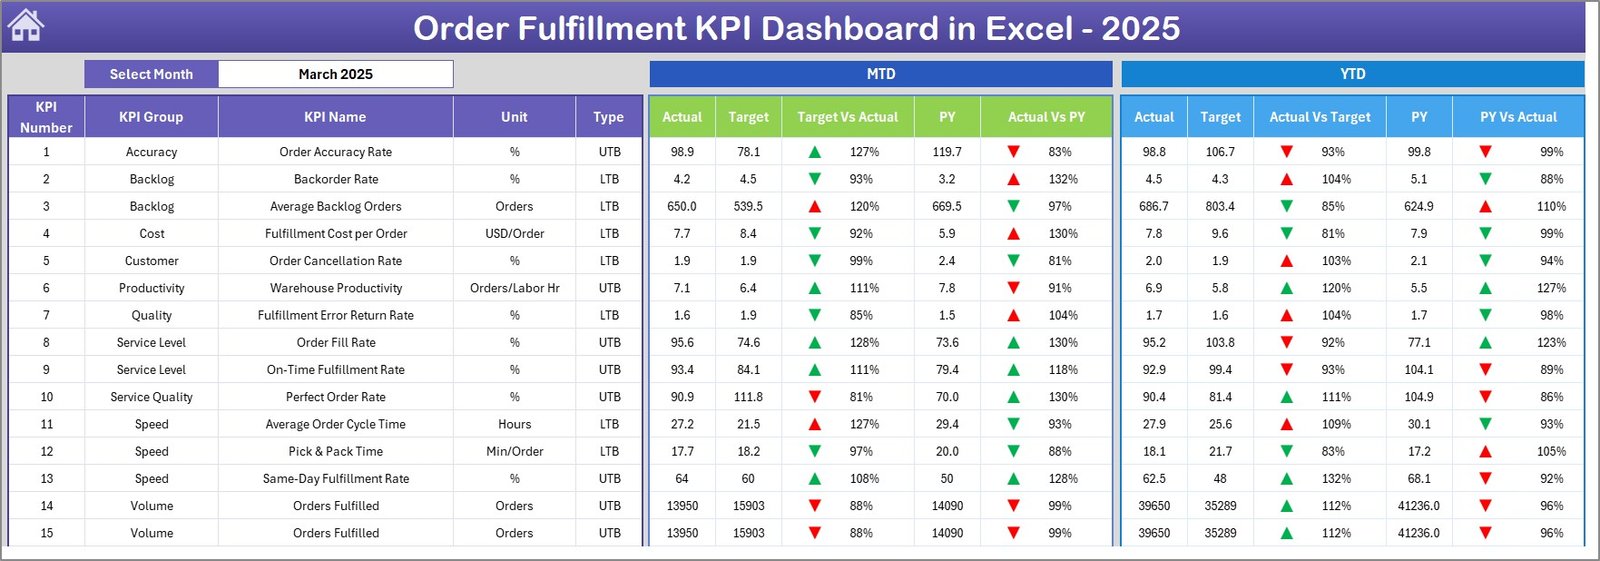
Dashboard Sheet
3 – KPI Trend Sheet
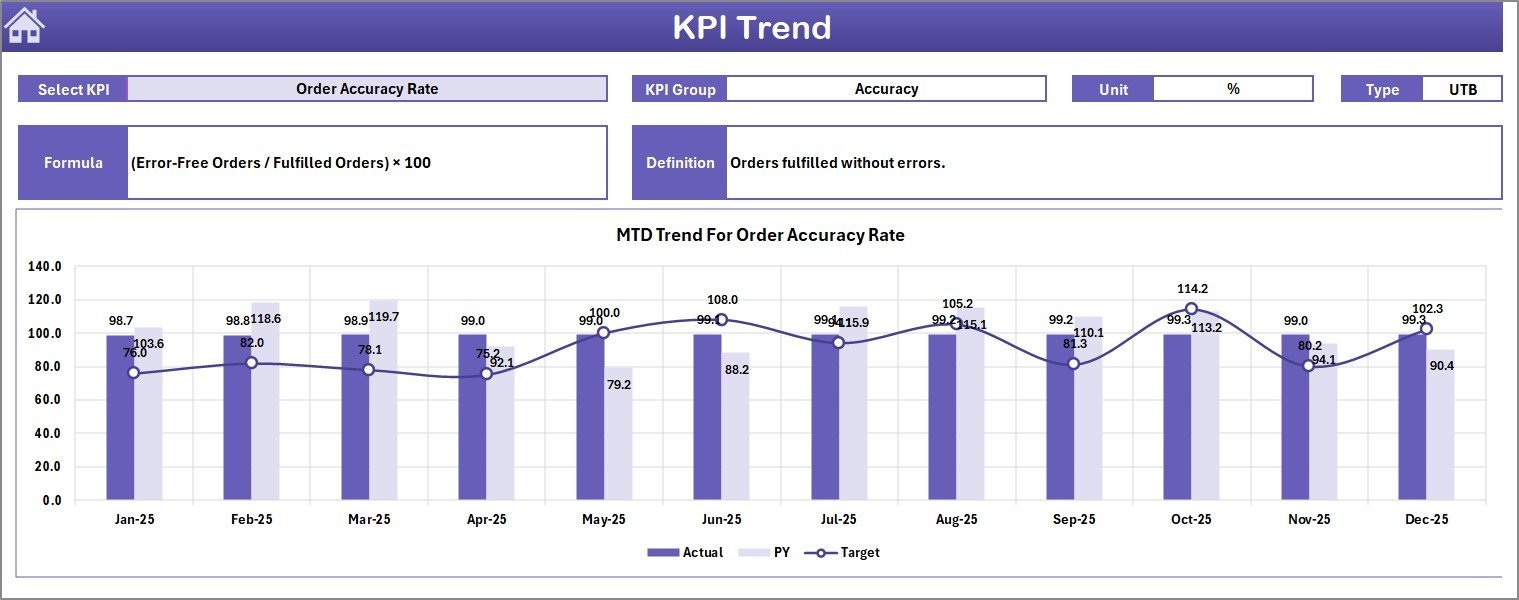
The KPI Trend sheet lets users select a KPI from the dropdown in cell C3. It displays the KPI group, KPI unit, KPI type, formula, and definition, then charts MTD and YTD trends for Actual, Target, and Previous Year values.
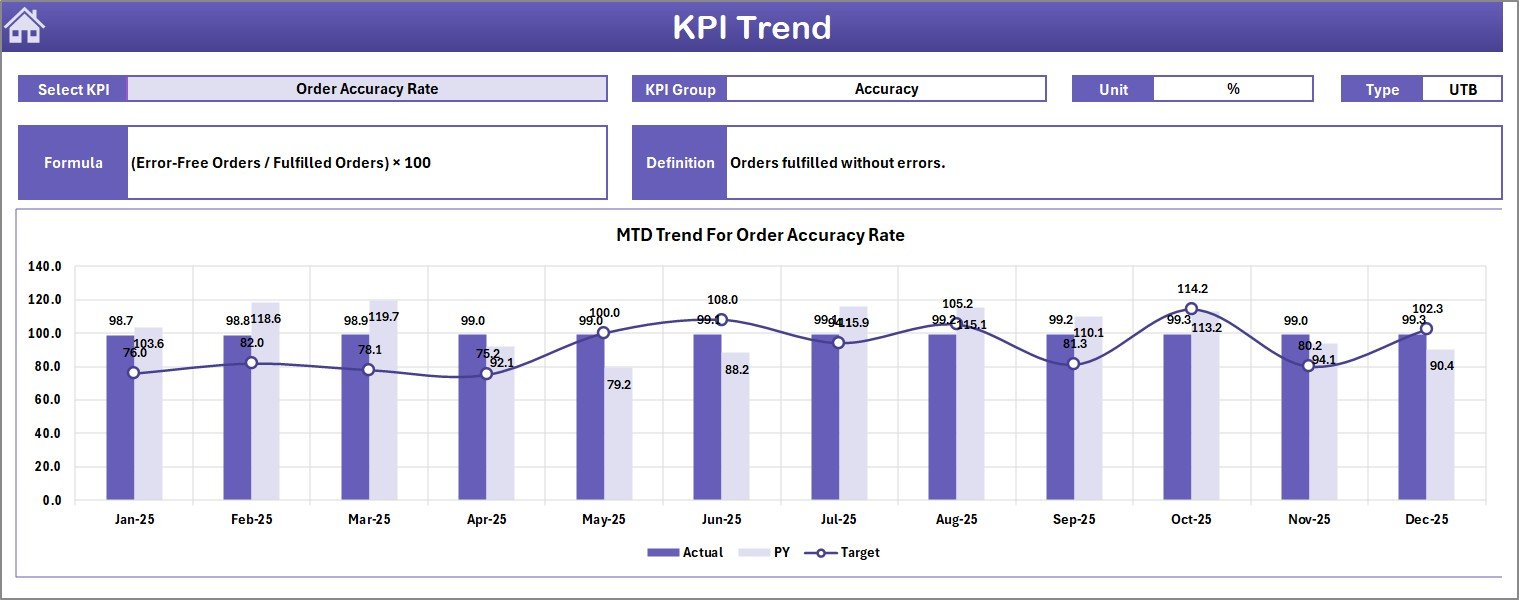
KPI Trend Sheet
4 – Actual Numbers Input Sheet
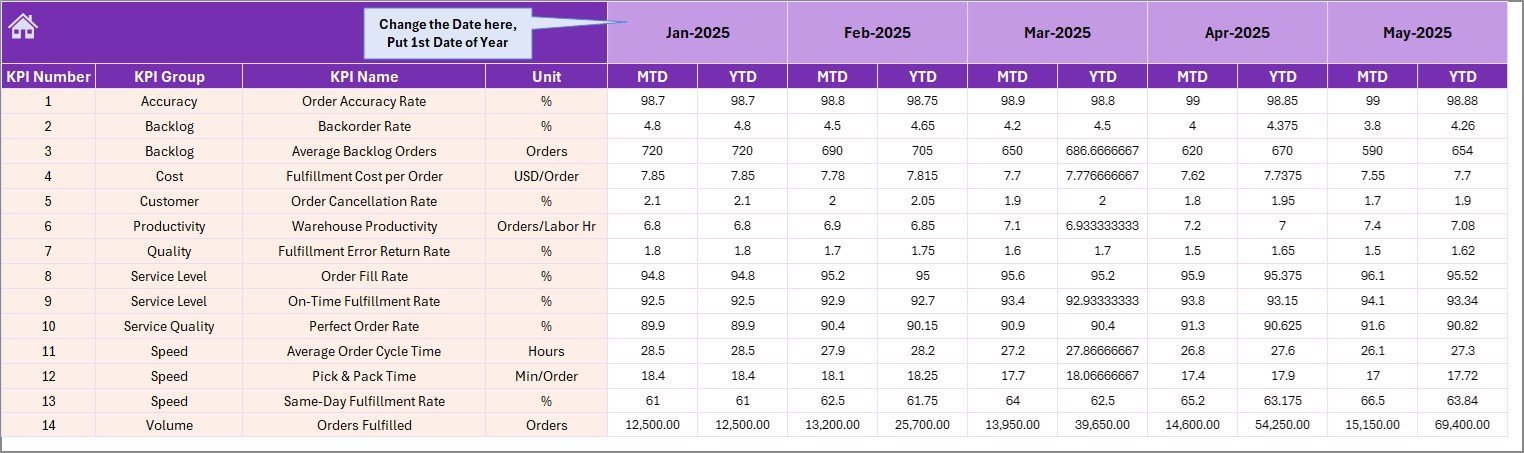
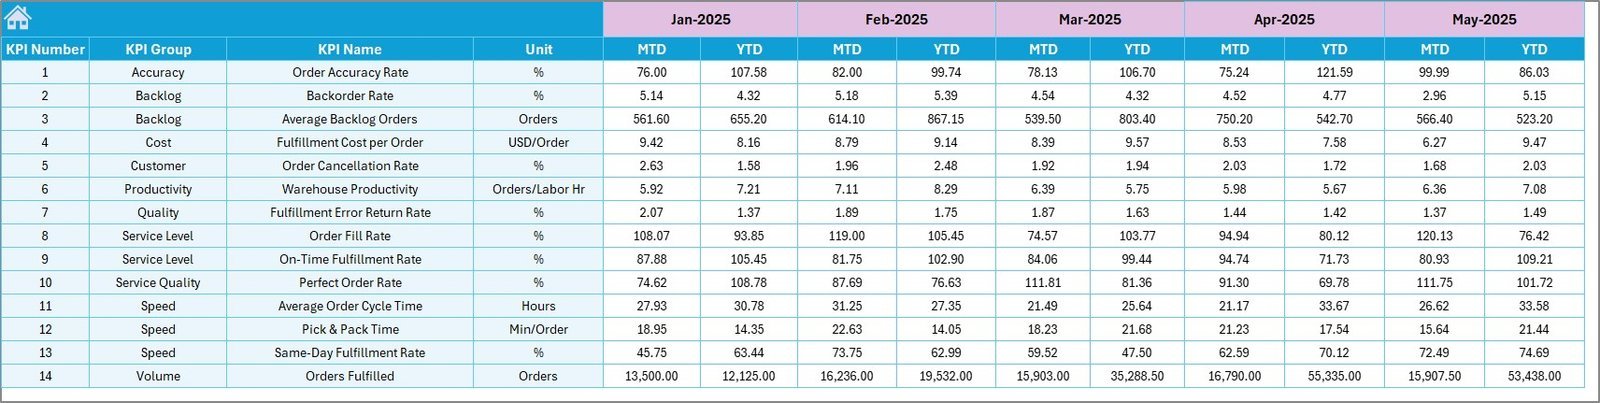
Use the Actual Numbers Input sheet to enter current-year MTD and YTD actual performance numbers for each KPI. The month headings can be controlled by changing the first month of the year in cell E1.
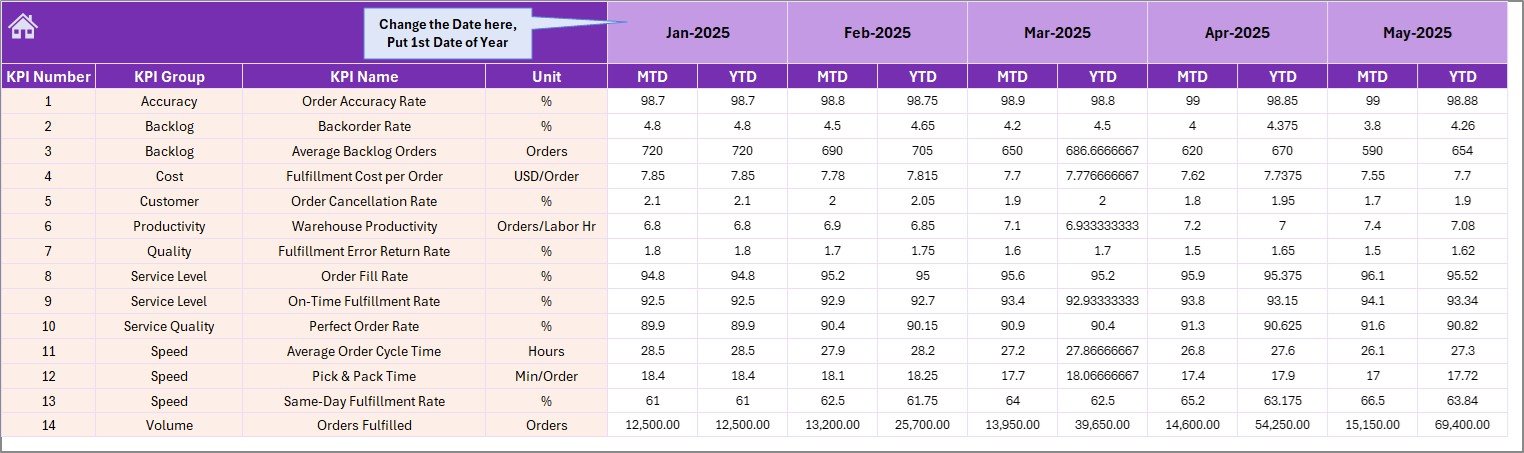
Actual Numbers Input Sheet
5 – Target Sheet
The Target sheet stores MTD and YTD monthly targets for every fulfillment KPI. These values feed the dashboard comparison columns so managers can quickly see where performance is above or below plan.
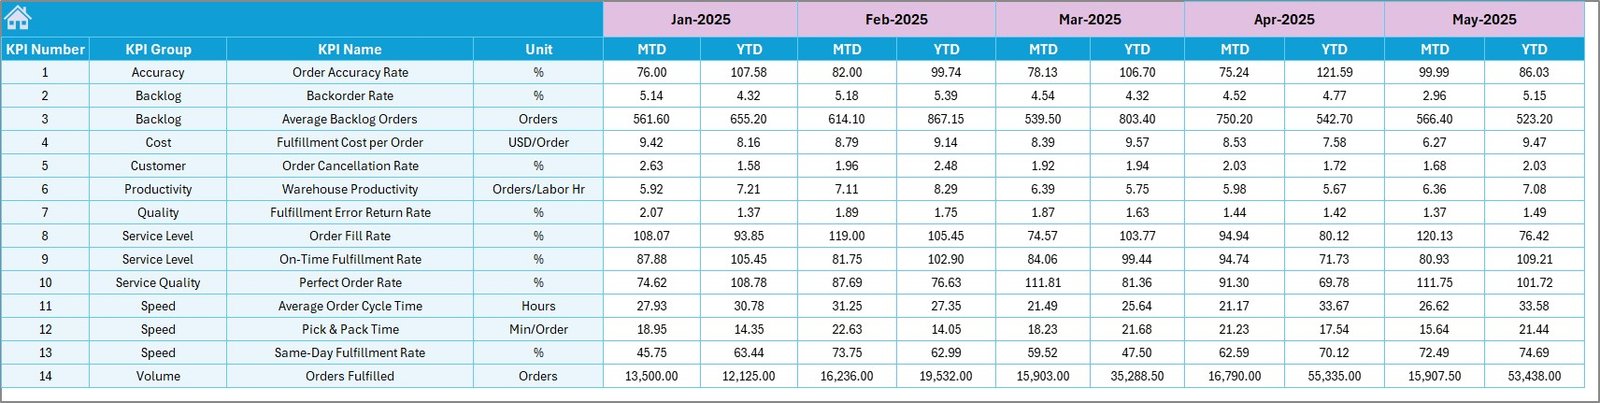
Target Sheet
6 – Previous Year Number Sheet
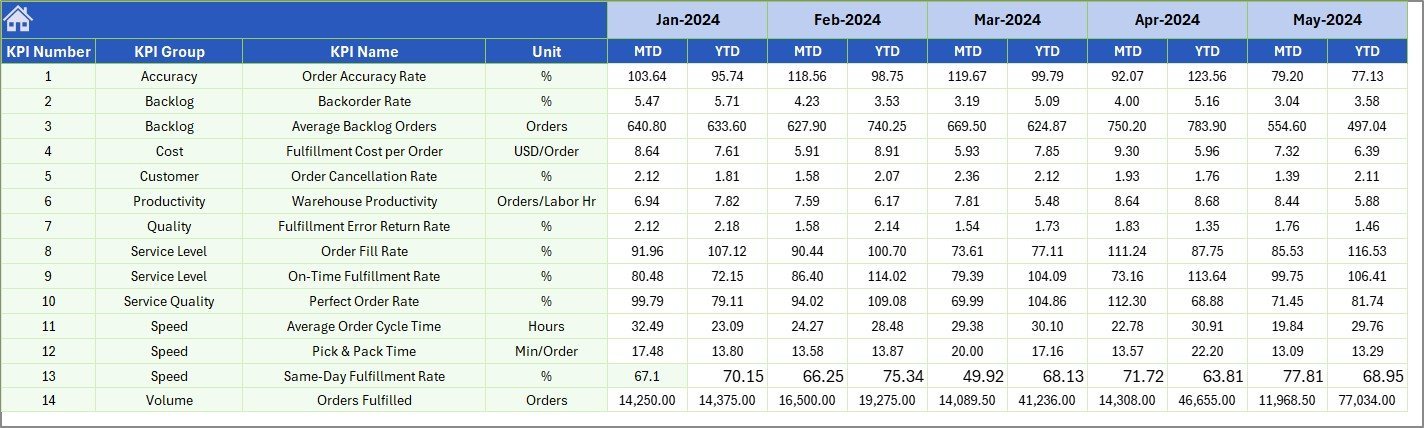
The Previous Year Number sheet stores prior-year values in the same monthly structure. This makes year-over-year review possible without adding extra manual calculations to the dashboard sheet.
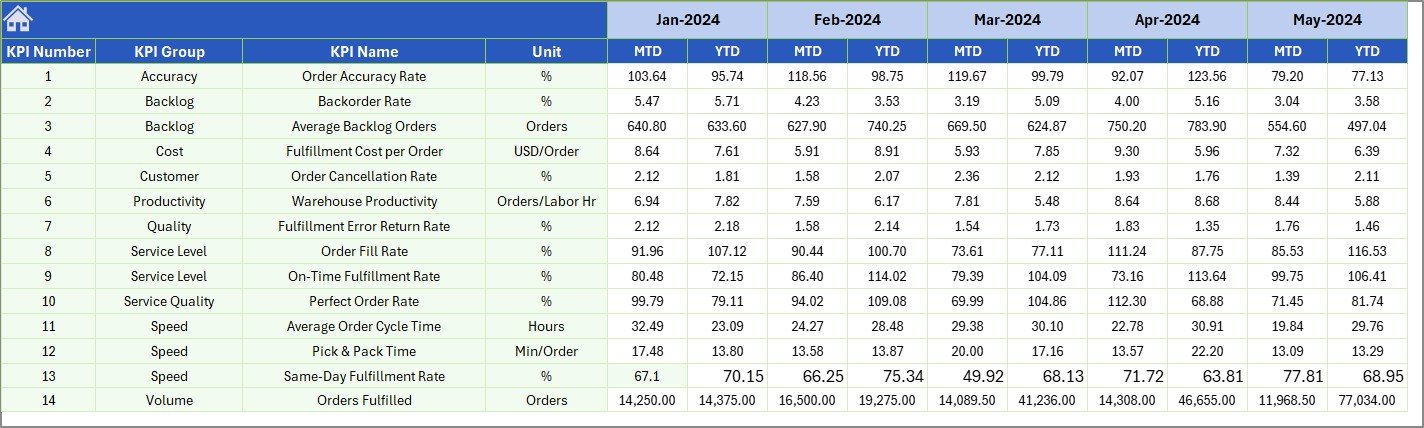
Previous Year Number Sheet
7 – KPI Definition Sheet
The KPI Definition sheet is where you maintain KPI name, KPI group, unit, formula, definition, and KPI type. Use Upper the Better or Lower the Better logic so performance indicators are interpreted correctly.

KPI Definition Sheet
Order Fulfillment KPI Dashboard in Excel vs. Google Sheets vs. Paid CRM/SaaS – Where This Fits
| Feature | This Excel template | Google Sheets alternative | Paid fulfillment SaaS |
|---|---|---|---|
| Cost | $12.99 sale price | Template cost or manual build | Monthly or annual subscription |
| Platform | Microsoft Excel | Browser-based spreadsheet | Vendor cloud platform |
| Setup time | Enter KPI numbers and select month | Similar if already built | Implementation and user setup |
| Real-time team collaboration | Possible through OneDrive or SharePoint | Native collaboration | Usually included |
| Mobile access | Limited by Excel mobile experience | Strong browser/mobile access | Usually included |
| Customizable fields | Edit KPI definitions, formulas, inputs, and layout | Editable but formula maintenance is manual | Limited by vendor fields |
| Share with link | Possible through cloud storage | Native | Usually login controlled |
| Year-1 cost at 5 users | One-time template cost before Microsoft licensing | Template plus Workspace if needed | Often hundreds or thousands |
| MTD/YTD fulfillment KPI tracking | Built in | Depends on template design | Depends on plan/module |
Who This Template Is For – and Who It’s Not For
This template is for fulfillment managers, warehouse leads, e-commerce operations teams, logistics analysts, supply chain reporting teams, and small businesses that track order processing KPIs in Excel. It is not a warehouse management system, barcode scanner, shipping label platform, live carrier integration, route optimizer, or order management database.
How to Use the Order Fulfillment KPI Dashboard in Excel
- Open the workbook in Microsoft Excel.
- Update KPI names, groups, units, formulas, definitions, and KPI types in the KPI Definition sheet.
- Enter actual MTD and YTD values in the Actual Numbers Input sheet.
- Enter KPI targets in the Target sheet.
- Enter previous-year values in the Previous Year Number sheet.
- Select the reporting month in cell D3 on the Dashboard sheet.
- Review MTD, YTD, Target vs Actual, Previous Year vs Actual, and KPI trend charts.
Real-World Use Cases
Anika, fulfillment operations manager: reviews monthly pick, pack, dispatch, and delivery KPIs before the weekly operations meeting.
Marcus, e-commerce analyst: uses the KPI Trend sheet to explain whether actual fulfillment speed is improving against target and last year.
Priya, supply chain reporting lead: maintains KPI formulas and definitions so warehouse, customer service, and logistics teams use the same measurement language.
Frequently Asked Questions
What is included in the download?
The download is a ZIP file containing the Order Fulfillment KPI Dashboard in Excel workbook.
How many worksheets are included?
There are 7 worksheets: Home, Dashboard, KPI Trend, Actual Numbers Input, Target, Previous Year Number, and KPI Definition.
Can I change the KPI names and formulas?
Yes. The KPI Definition sheet is editable, so you can change KPI names, groups, units, formulas, definitions, and KPI type.
Does it show both MTD and YTD performance?
Yes. The dashboard shows MTD and YTD Actual, Target, and Previous Year numbers with comparison indicators.
Do I need macros?
No macro requirement was provided for this workbook. It is positioned as an Excel KPI dashboard template using worksheets, dropdowns, formulas, charts, and conditional formatting.
Can this replace my WMS or shipping software?
No. It is a reporting dashboard for KPI values you enter or prepare. Keep order processing, barcode scanning, shipping labels, and live inventory transactions in your operational systems.
About the Author
Built by PK – Microsoft Certified Professional with 15+ years of Excel, Google Sheets, and Power BI experience. Founder of NextGenTemplates, reaching 300K+ subscribers across YouTube channels. Every template is hand-built and tested before release.
Explore Related Templates
- Transportation KPI Dashboard in Excel
- Logistics and Transportation Hub
- Transportation Services KPI Dashboard in Excel
- Browse Excel KPI Dashboard templates
- Browse MS Excel templates
Download the Order Fulfillment KPI Dashboard in Excel to track fulfillment KPIs with MTD, YTD, target, and previous-year comparisons in one editable workbook.
Last updated: August 16, 2026.


























Reviews
There are no reviews yet.