

Modern organizations rely heavily on IT support to keep business operations running without disruption. From system access issues and software errors to hardware failures and network outages, employees raise IT tickets every day. However, when IT teams manage these requests through emails or unstructured spreadsheets, visibility drops, response times increase, and service quality suffers.
That is exactly why the Office IT Helpdesk Dashboard in Google Sheets becomes a powerful and practical solution.
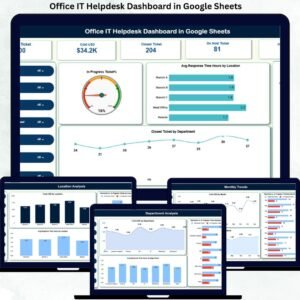
This ready-to-use dashboard helps IT teams track all helpdesk tickets, costs, response times, and resolution performance in one centralized and visual system. Instead of manually compiling reports, IT managers gain instant insights into ticket workload, bottlenecks, and performance trends. With automated calculations, interactive charts, and a smart search feature, this dashboard transforms raw ticket data into actionable intelligence.
Because the dashboard is built entirely in Google Sheets, it remains cloud-based, collaborative, easy to use, and cost-effective—without the need for expensive ITSM software.
✨ Key Features of the Office IT Helpdesk Dashboard in Google Sheets
📊 Centralized Ticket Monitoring
Track all IT helpdesk tickets, statuses, costs, and response times in one structured dashboard.
⏱️ Response & Resolution Performance Tracking
Monitor average response time and resolution trends to improve SLA compliance.
💰 Cost Visibility & Control
Analyze IT support costs by category, department, location, and channel.
📈 Interactive Charts & KPI Cards
Instantly visualize workload, performance, and trends with automated charts and KPI cards.
🔍 Smart Search Functionality
Find any ticket instantly using keyword-based search across multiple fields.
📦 What’s Inside the Office IT Helpdesk Dashboard in Google Sheets
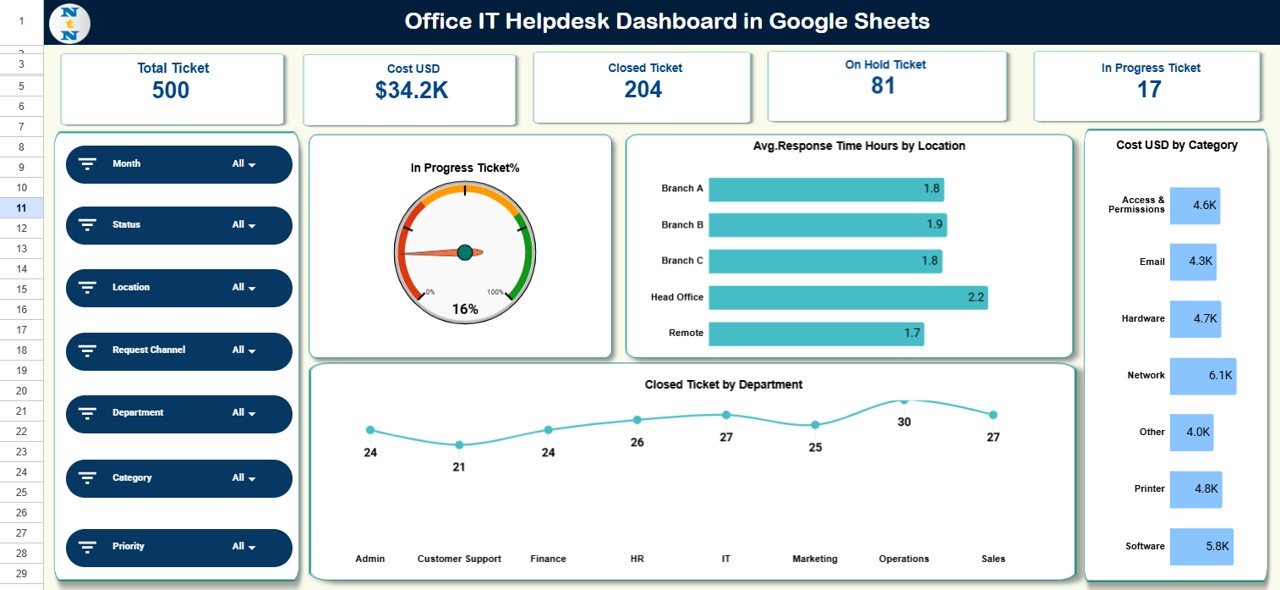
🖥️ Overview Sheet Tab – IT Performance Snapshot
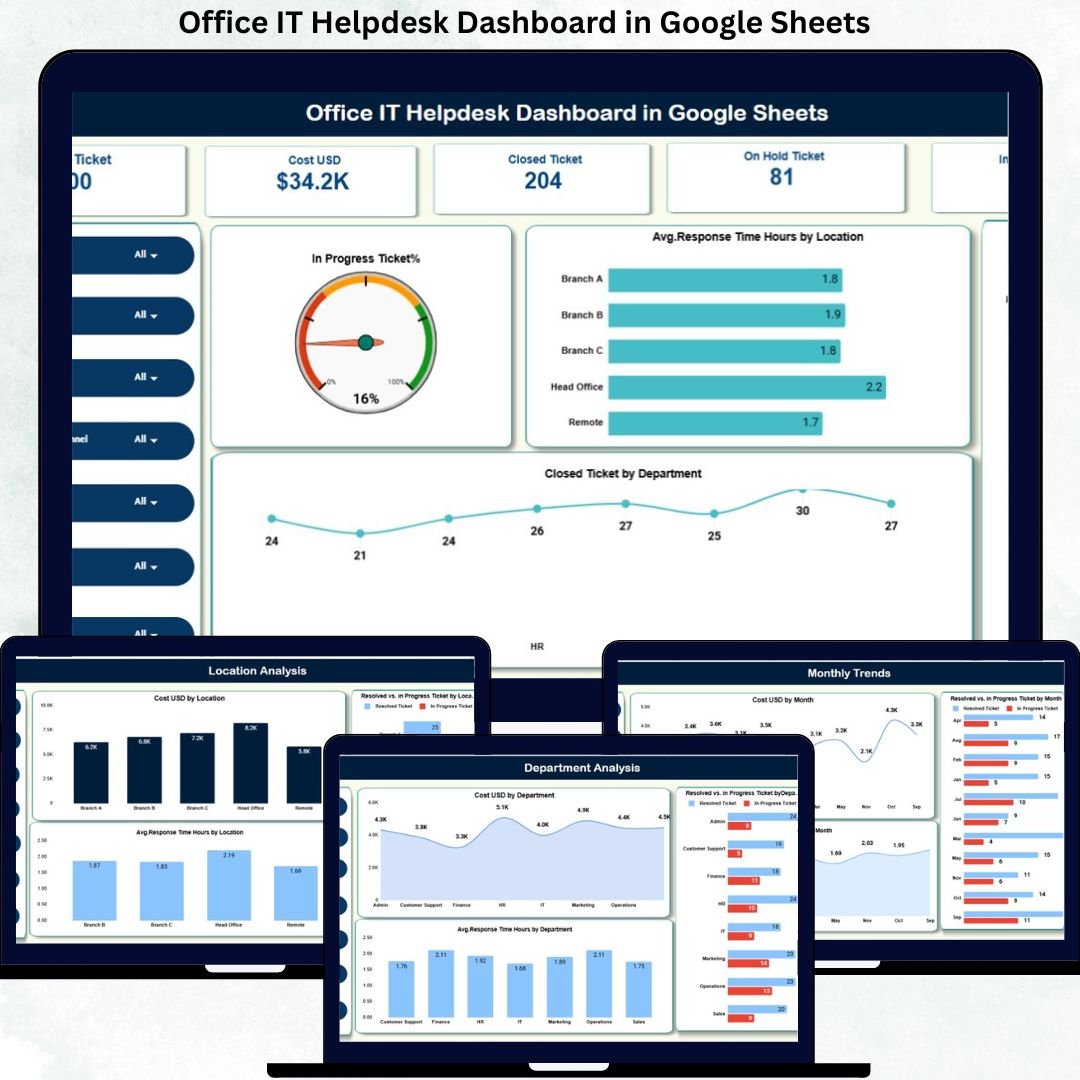
The Overview sheet works as the command center of the dashboard. It displays high-level KPIs and summary charts for quick decision-making.
KPI Cards Include:
Total Tickets
Cost (USD)
Closed Tickets
In-Progress Tickets
On-Hold Tickets
Charts Included:
In-Progress Ticket %
Average Response Time (Hours) by Location
Cost USD by Category
Closed Ticket by Department
This view helps IT leaders assess workload, cost drivers, and performance gaps instantly.
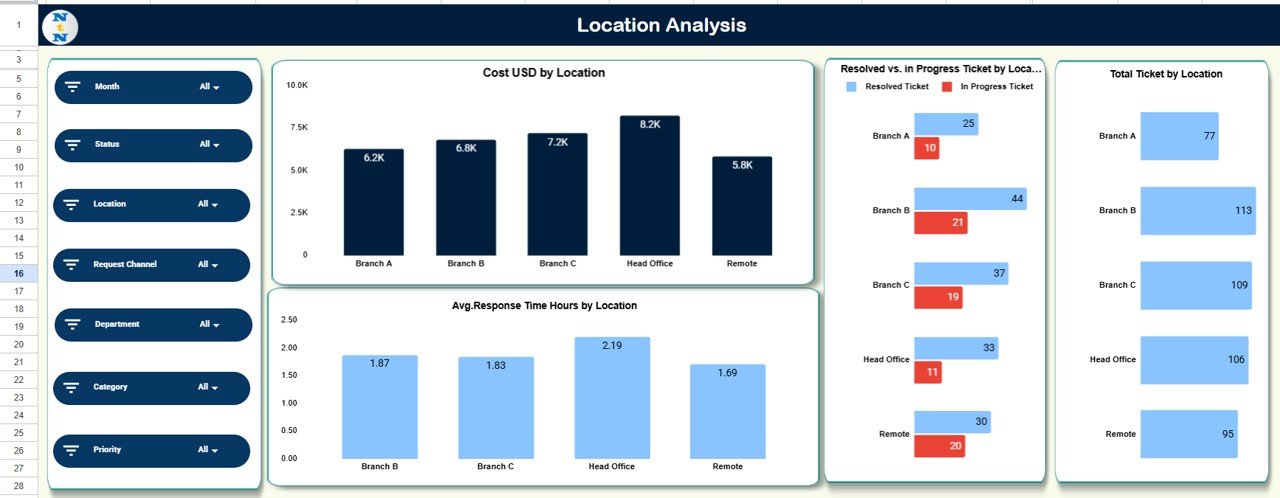
📍 Location Analysis Sheet
This sheet analyzes IT performance across office locations.
Charts Include:
Cost USD by Location
Resolved vs In-Progress Tickets by Location
Average Response Time by Location
Total Tickets by Location
It helps identify locations with higher IT issues or slower response times.
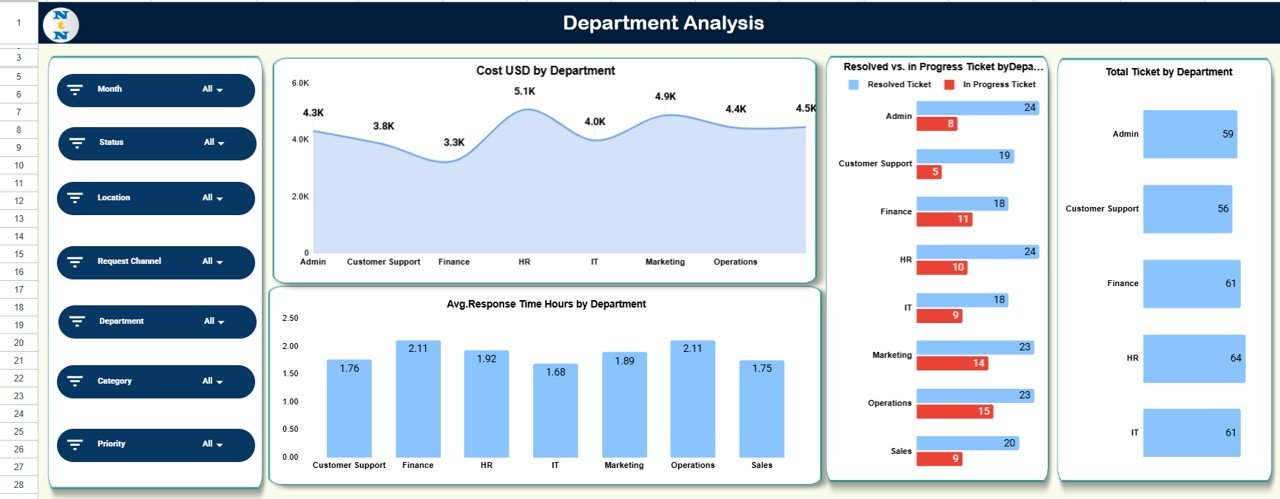
🏢 Department Analysis Sheet
This sheet highlights IT demand and performance across departments.
Charts Include:
Cost USD by Department
Resolved vs In-Progress Tickets by Department
Average Response Time by Department
Total Tickets by Department
It supports data-driven decisions for infrastructure upgrades and training.
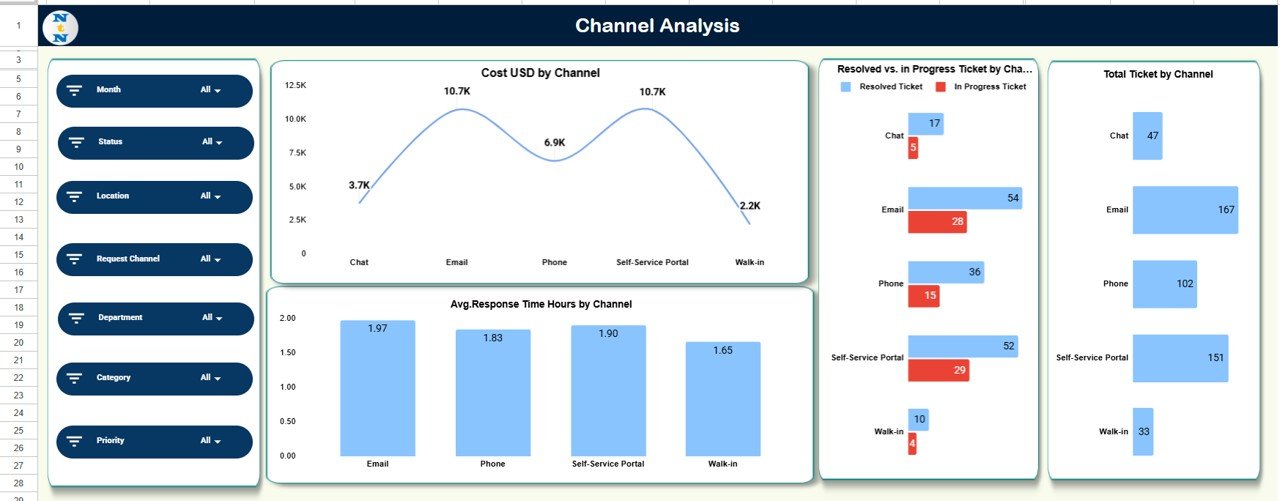
📞 Channel Analysis Sheet
This sheet explains how employees raise IT tickets.
Charts Include:
Cost USD by Channel
Resolved vs In-Progress Tickets by Channel
Total Tickets by Channel
Average Response Time by Channel
It helps improve ticket intake strategy and channel efficiency.
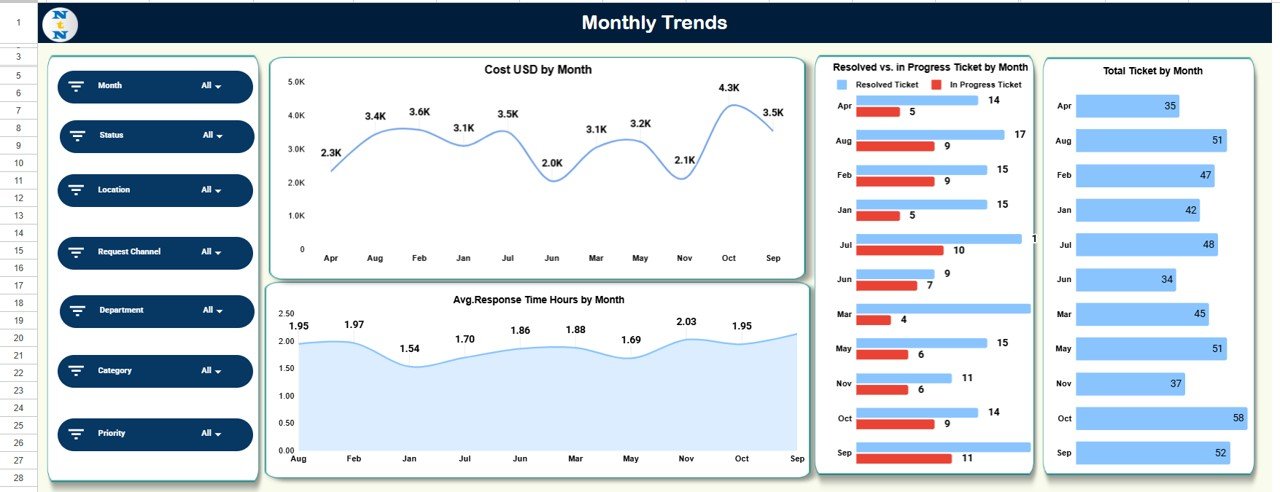
📆 Monthly Trends Sheet
This sheet tracks IT helpdesk performance over time.
Charts Include:
Cost USD by Month
Resolved vs In-Progress Tickets by Month
Average Response Time by Month
Total Tickets by Month
It helps detect recurring issues, seasonal spikes, and improvement trends.
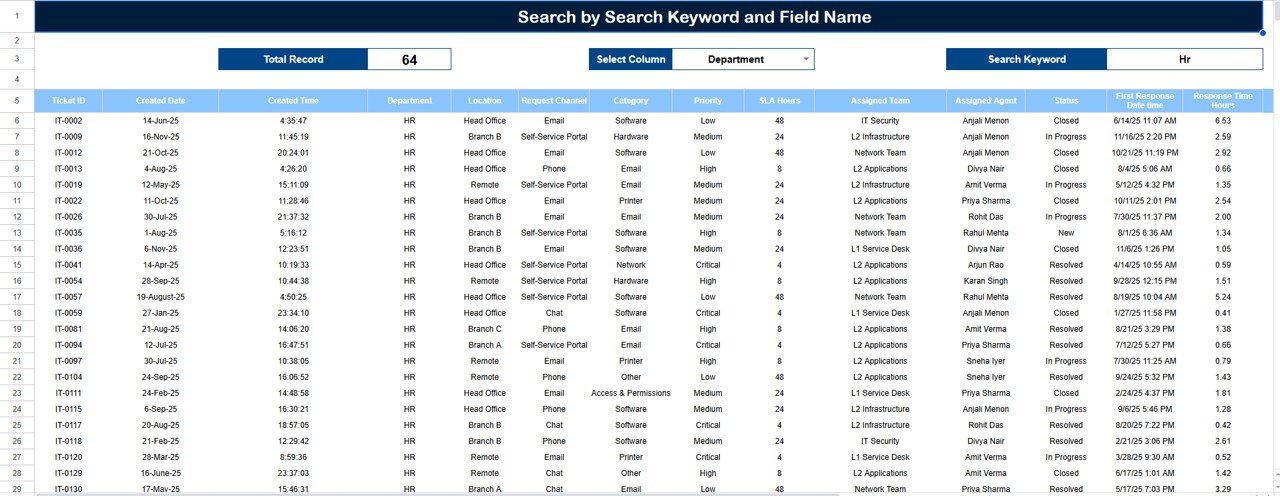
🔍 Search Panel – Find Any Ticket Instantly
The dashboard includes a powerful search feature.
You can search by:
Ticket ID
Employee Name
Department
Location
Category
Channel
Status
This feature saves time during escalations, audits, and management reviews.
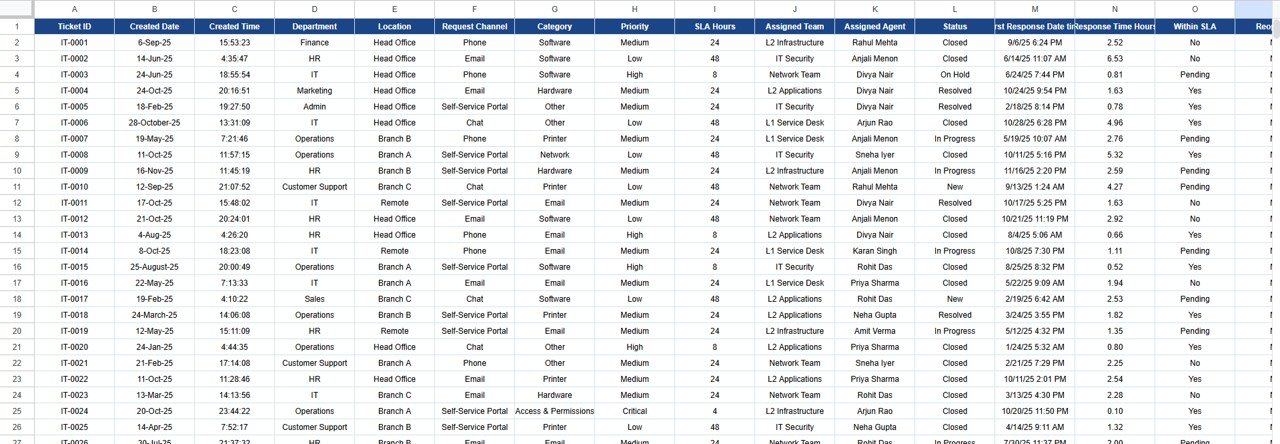
🗂️ Data Sheet
This sheet stores all ticket-level data such as:
Ticket ID
Request Date
Department
Location
Issue Category
Channel
Status
Cost (USD)
Response Time (Hours)
All dashboard visuals update automatically from this sheet.
🎯 Who Can Benefit from This Office IT Helpdesk Dashboard
💻 IT Support & Service Desk Teams
Track tickets, response times, and workload efficiently.
📊 IT Managers & Operations Leaders
Monitor performance, costs, and SLA compliance clearly.
🏢 Multi-Location Organizations
Analyze IT support efficiency across offices.
🚀 Growing Businesses
Adopt a scalable, low-cost IT reporting solution.
### Click here to read the Detailed blog post
Watch the step-by-step video tutorial:






























Reviews
There are no reviews yet.