


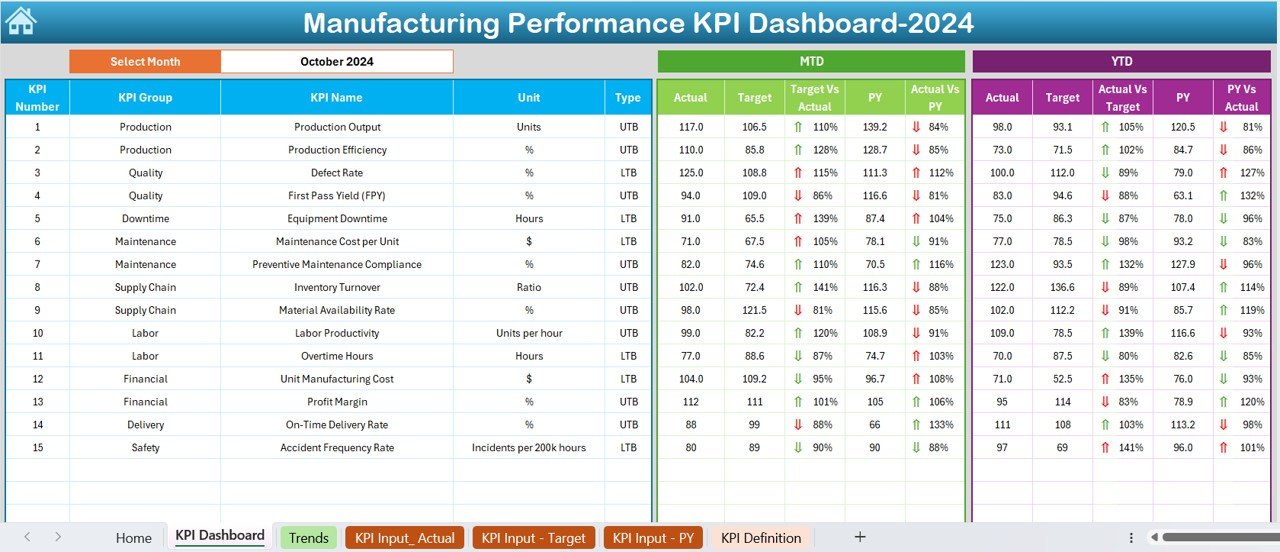
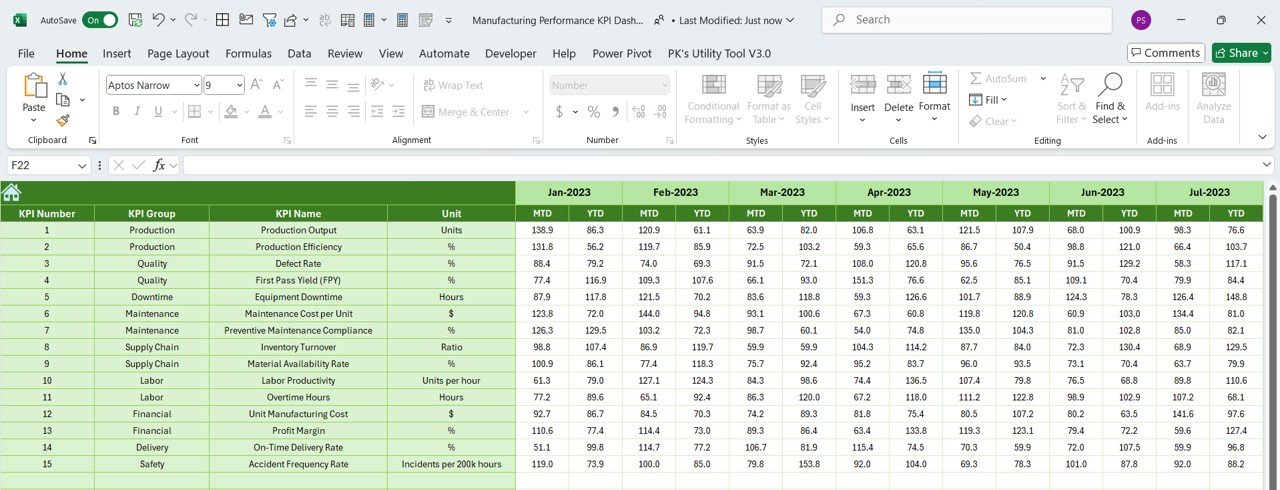
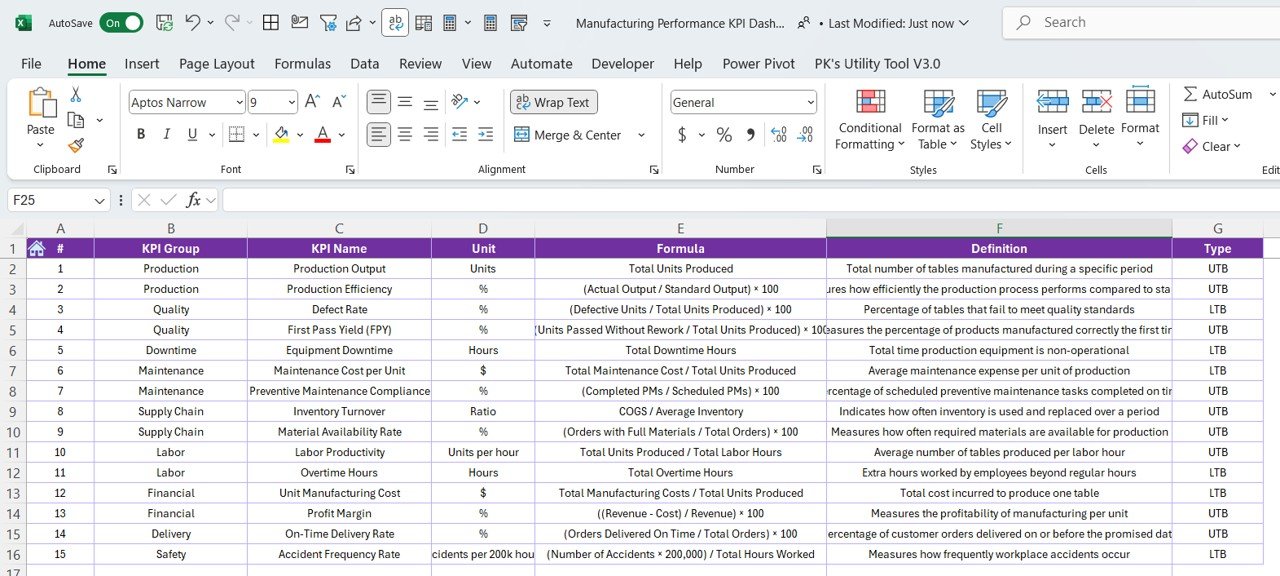

The Manufacturing Performance KPI Dashboard in Excel is an essential tool designed for manufacturing managers, operations teams, and business owners looking to monitor and improve key performance indicators (KPIs) related to manufacturing processes. This Excel-based dashboard provides real-time insights into vital metrics such as production efficiency, quality control, downtime, and resource utilization, enabling you to optimize manufacturing operations and achieve higher levels of productivity.
With its easy-to-use interface and powerful tracking capabilities, this dashboard allows you to analyze performance across different stages of the manufacturing process. Whether you need to track production volumes, identify bottlenecks, or monitor equipment performance, this KPI dashboard provides all the tools you need to make informed, data-driven decisions.
Key Features of the Manufacturing Performance KPI Dashboard in Excel
📊 Production Efficiency Monitoring
Track key metrics related to production output, efficiency, and capacity utilization. Monitor the effectiveness of production processes and identify areas where improvements can be made to increase efficiency.
📈 Quality Control Analysis
Measure and monitor the quality of manufactured products. Track defect rates, scrap percentages, and rework costs to ensure that your products meet the required standards and reduce waste in the process.
⏱ Downtime Tracking & Analysis
Identify the causes and duration of downtime in the production line. Understand equipment or process inefficiencies and work to reduce downtime to maximize productivity.
🔄 Resource Utilization Monitoring
Track the use of resources such as labor, raw materials, and equipment. Ensure optimal utilization to minimize costs and improve overall operational efficiency.
⚙️ Customizable KPIs & Metrics
The dashboard is fully customizable, allowing you to tailor KPIs to fit your specific manufacturing needs. Add new performance metrics, adjust data sources, and modify visualizations as required.
📅 Time-Based Performance Analysis
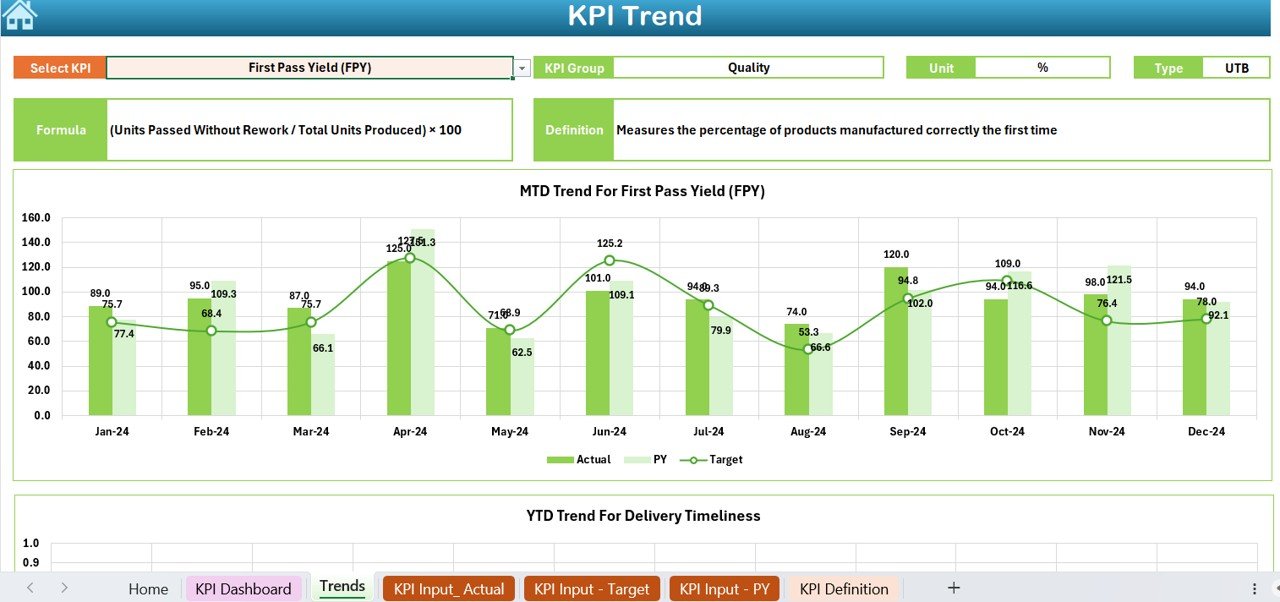
Track performance over different time periods (daily, weekly, monthly) to identify trends and patterns. This helps you assess long-term performance and make adjustments accordingly.
Why You’ll Love the Manufacturing Performance KPI Dashboard in Excel

✅ Monitor Production Performance
Track and optimize your production efficiency, ensuring that you’re maximizing output while maintaining quality.
✅ Improve Quality Control
Easily track quality metrics and ensure that defects and rework costs are minimized, improving overall product quality and reducing waste.
✅ Reduce Downtime
Identify the sources of downtime and take corrective actions to minimize interruptions in your manufacturing process, ensuring smoother operations.
✅ Optimize Resource Utilization
Track the use of labor, materials, and equipment to ensure optimal resource allocation, reducing costs and improving overall efficiency.
✅ Make Data-Driven Decisions
Gain insights from real-time data to make informed decisions that will improve your manufacturing processes, reduce costs, and increase profitability.
What’s Inside the Manufacturing Performance KPI Dashboard in Excel?
Production Efficiency Monitoring: Track production output and efficiency metrics.
Quality Control Tracking: Monitor defect rates, scrap percentages, and rework costs.
Downtime Analysis: Track and analyze downtime to reduce interruptions in production.
Resource Utilization Tracking: Ensure optimal use of labor, materials, and equipment.
Time-Based Performance Analysis: Track performance over different periods for trend analysis.
Customizable Metrics & KPIs: Tailor the dashboard to track the most relevant manufacturing metrics for your business.
How to Use the Manufacturing Performance KPI Dashboard in Excel
1️⃣ Download the Template: Get the Manufacturing Performance KPI Dashboard in Excel instantly.
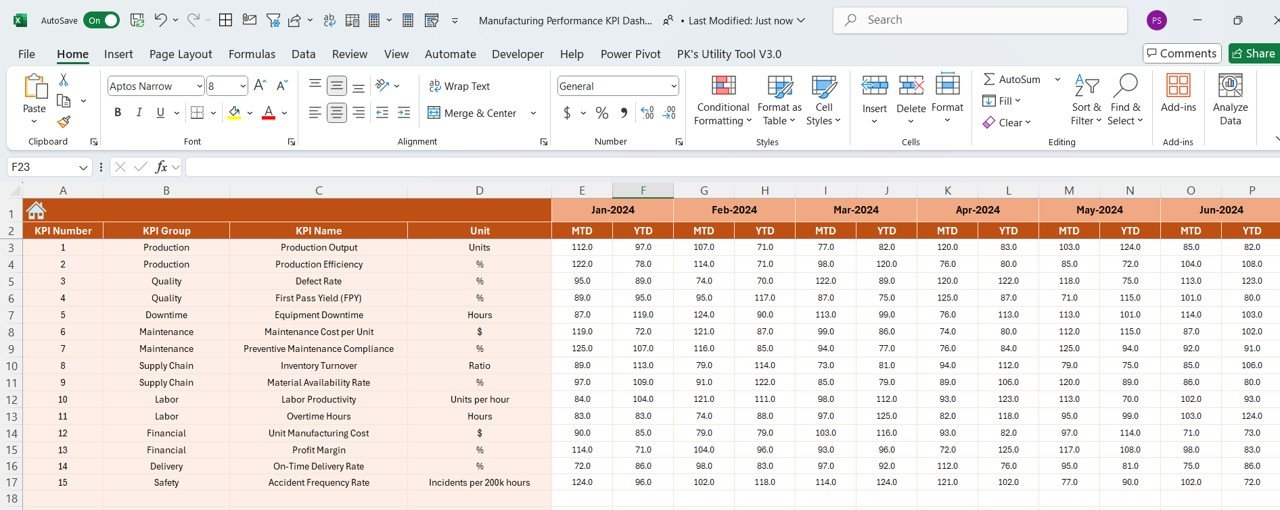
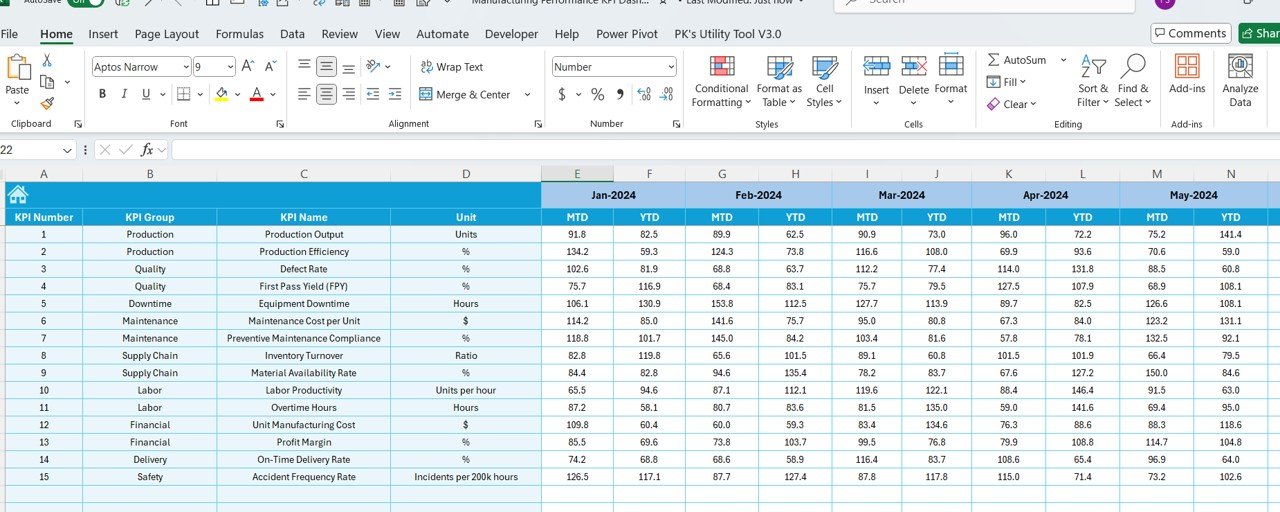
2️⃣ Input Data: Enter production data, resource usage, and quality metrics into the dashboard.
3️⃣ Track KPIs & Performance: Monitor key metrics such as efficiency, quality, and downtime.
4️⃣ Analyze Trends: Use time-based analysis to identify performance trends and areas for improvement.
5️⃣ Optimize Manufacturing Processes: Use the insights to improve production processes, reduce downtime, and enhance resource utilization.
Who Can Benefit from the Manufacturing Performance KPI Dashboard in Excel?
🔹 Manufacturing Managers & Supervisors
🔹 Operations Teams & Production Managers
🔹 Business Owners & Executives in Manufacturing
🔹 Supply Chain & Logistics Teams
🔹 Quality Control Specialists
🔹 Industrial Engineers
🔹 Small & Medium Enterprises (SMBs) in Manufacturing
Ensure the efficiency of your manufacturing processes with the Manufacturing Performance KPI Dashboard in Excel. Track production efficiency, quality control, downtime, and resource utilization in one easy-to-use, customizable dashboard.
Click here to read the Detailed blog post
Visit our YouTube channel to learn step-by-step video tutorials
Youtube.com/@PKAnExcelExpert
Watch the step-by-step video Demo:
Compatibility and Requirements
- Works in Microsoft Excel desktop (Excel 2016 or later, or Microsoft 365).
- New to Excel? Microsoft has a free guide: Excel for Windows training.
Frequently Asked Questions
What does the Manufacturing Performance KPI Dashboard track?
It tracks production efficiency, quality control (defect rates, scrap percentages and rework costs), downtime and the use of labor, materials and equipment.
Can I review performance by period?
Yes. You can look at performance daily, weekly or monthly to spot trends and patterns.
What data do I enter?
You enter production data, resource usage and quality metrics. The dashboard then shows efficiency, quality and downtime KPIs.
Can I change the KPIs?
Yes. You can add new performance metrics, adjust data sources and change the visuals to match your plant.
Related Manufacturing Templates
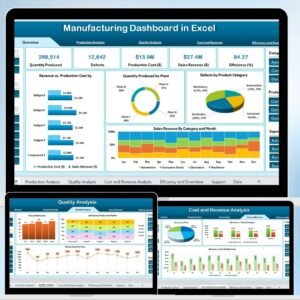
- Manufacturing Dashboard in Excel: a full manufacturing dashboard in Excel
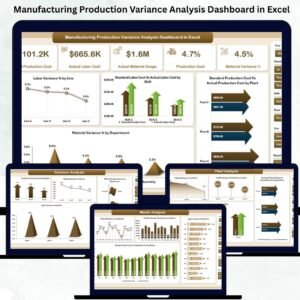
- Manufacturing Quality Assurance KPI Dashboard in Excel: quality assurance KPIs for manufacturing
- Manufacturing KPI Scorecard in Excel: a manufacturing KPI scorecard in Excel
- Manufacturing Efficiency Dashboard in Power BI: manufacturing efficiency in Power BI
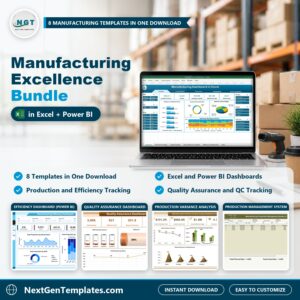
- Manufacturing Excellence Bundle: 8 manufacturing templates in one download
Browse all Excel KPI dashboards or the Excel manufacturing templates.
































Reviews
There are no reviews yet.