

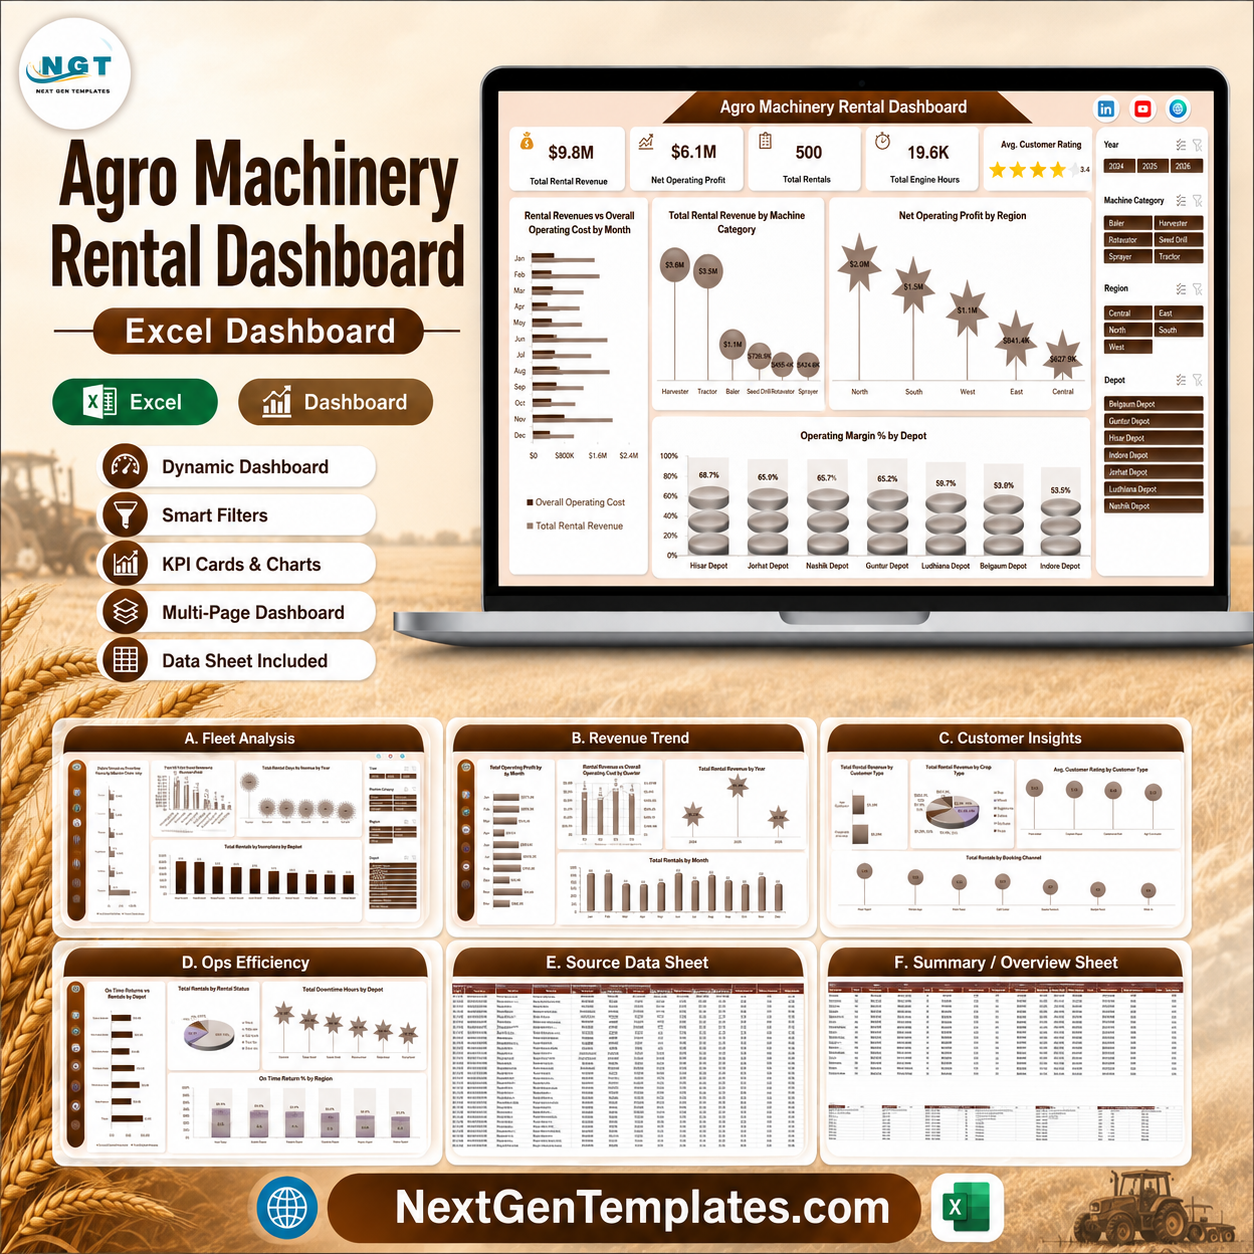


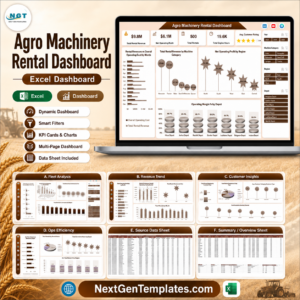
Agro Machinery Rental Dashboard in Excel gives farm equipment rental teams a ready workbook for tracking revenue, profit, rentals, engine hours, downtime, customer rating, on-time returns, depot performance, and fleet utilization. Instead of rebuilding 7 worksheets, 4 KPI cards, 17 analysis charts, data-entry structure, and support pivots from scratch, you can start with this editable Excel dashboard for a $17.99 one-time sale price. Built by PK, a Microsoft Certified Professional with 15+ years of Excel experience and 300K+ YouTube subscribers, this template is designed for practical review before publishing or operational use.
Key Features of Agro Machinery Rental Dashboard in Excel
- 7 Excel worksheets: Overview, Fleet Analysis, Revenue Trend, Customer Insights, Ops Efficiency, Data, and Support.
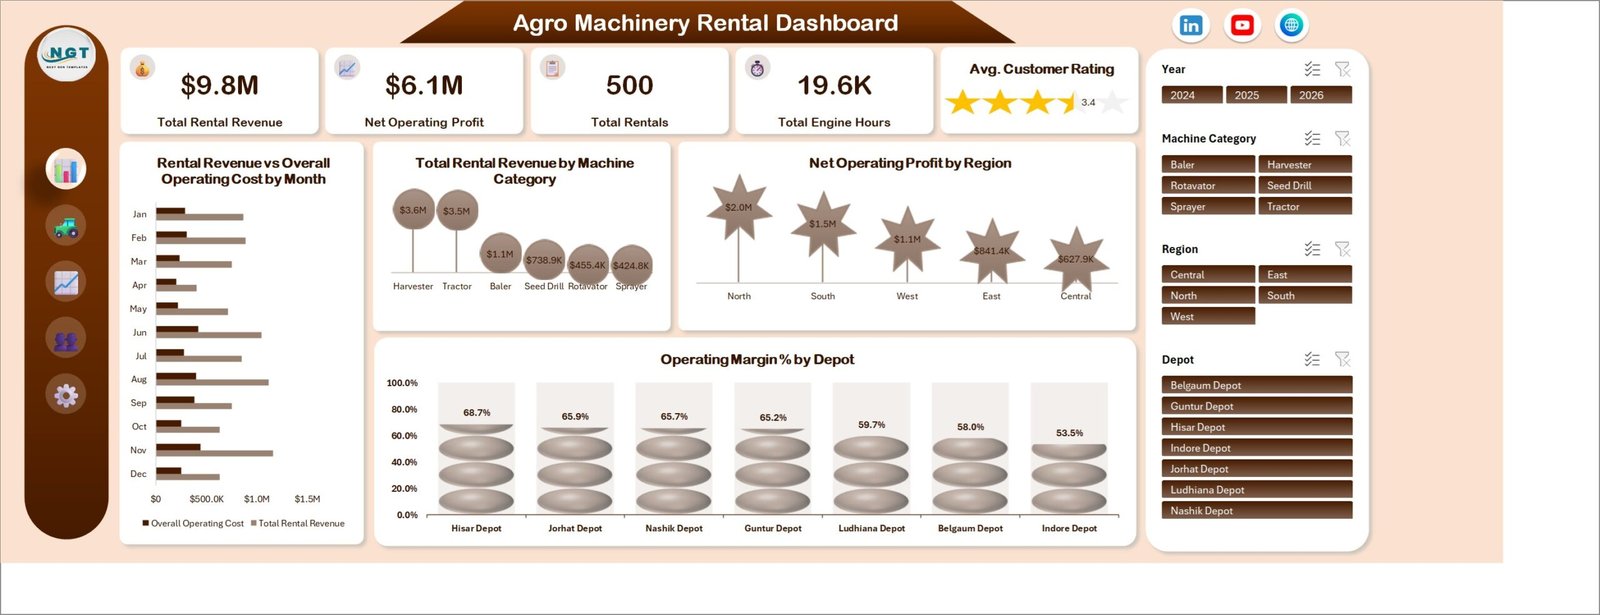
- 4 KPI cards: Total Rental Revenue, Net Operating Profit, Total Rentals, and Total Engine Hours.
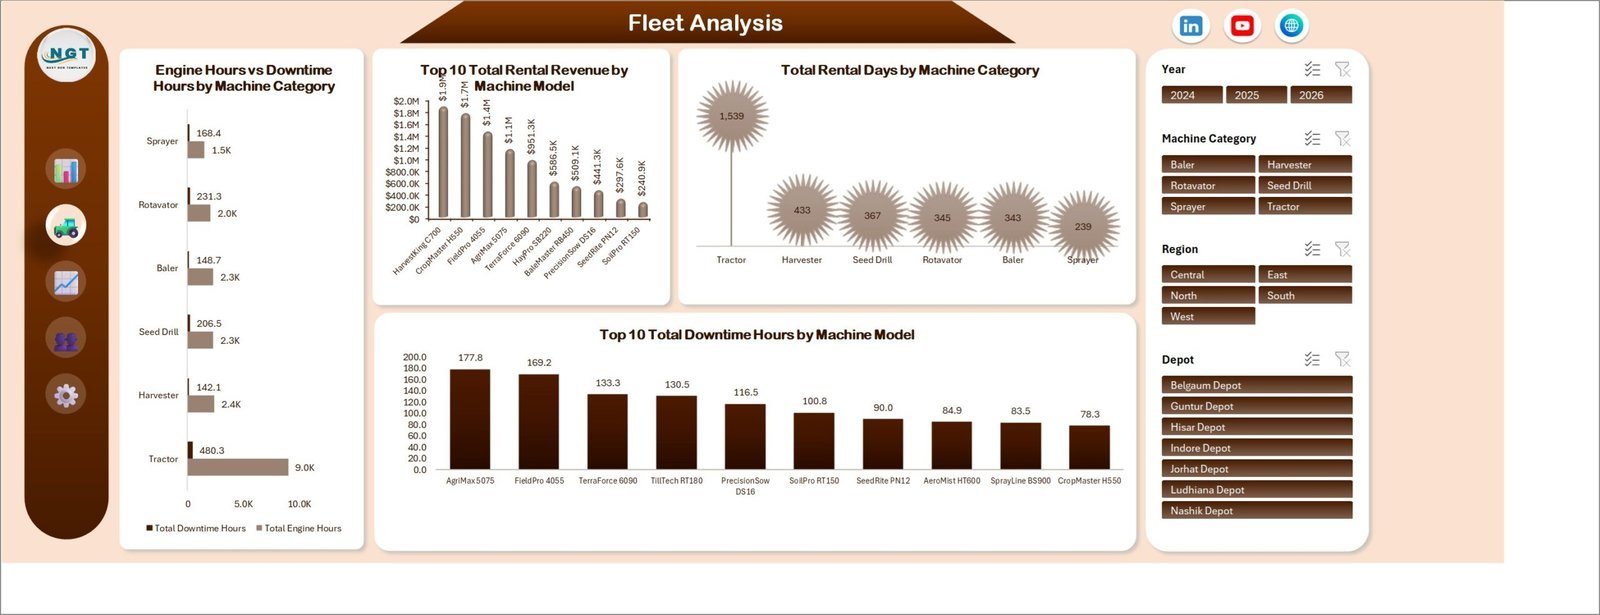
- Fleet analysis: Review engine hours, downtime hours, rental days, machine category, and machine model performance.
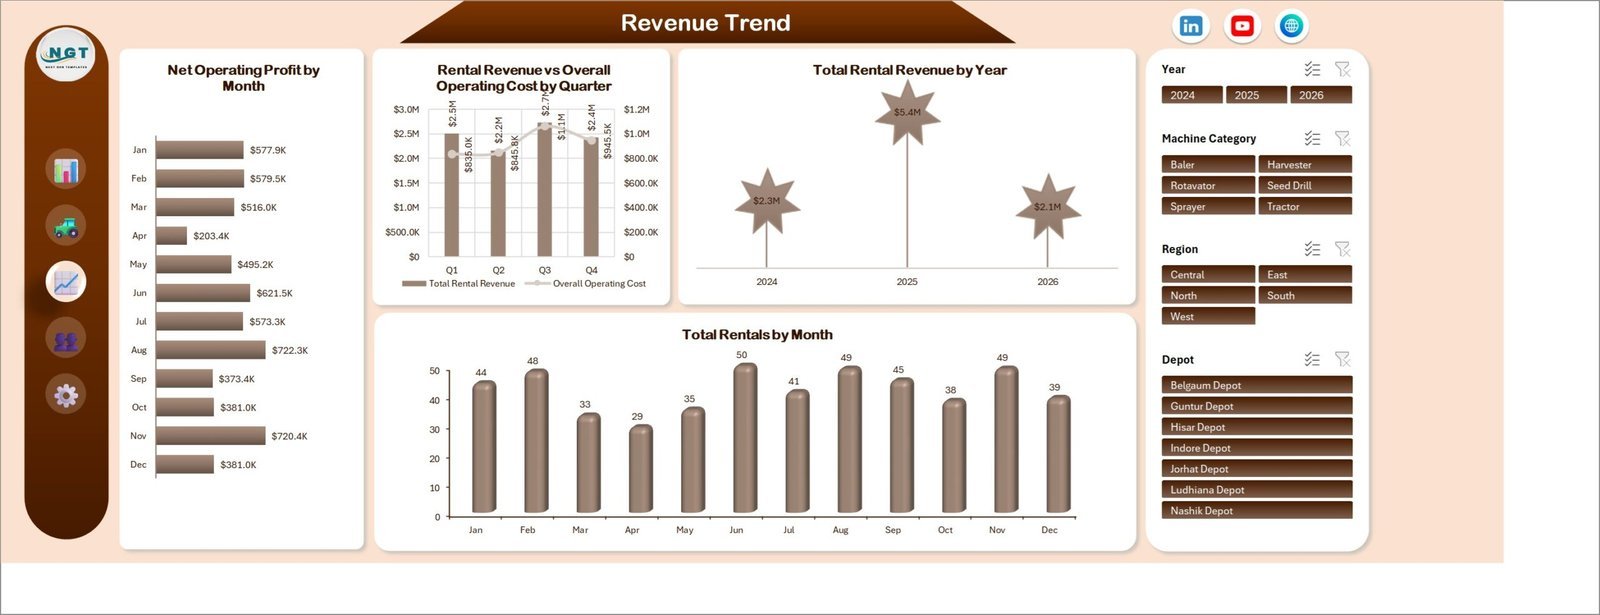
- Revenue reporting: Compare revenue, operating cost, net operating profit, quarters, years, and monthly rental volume.
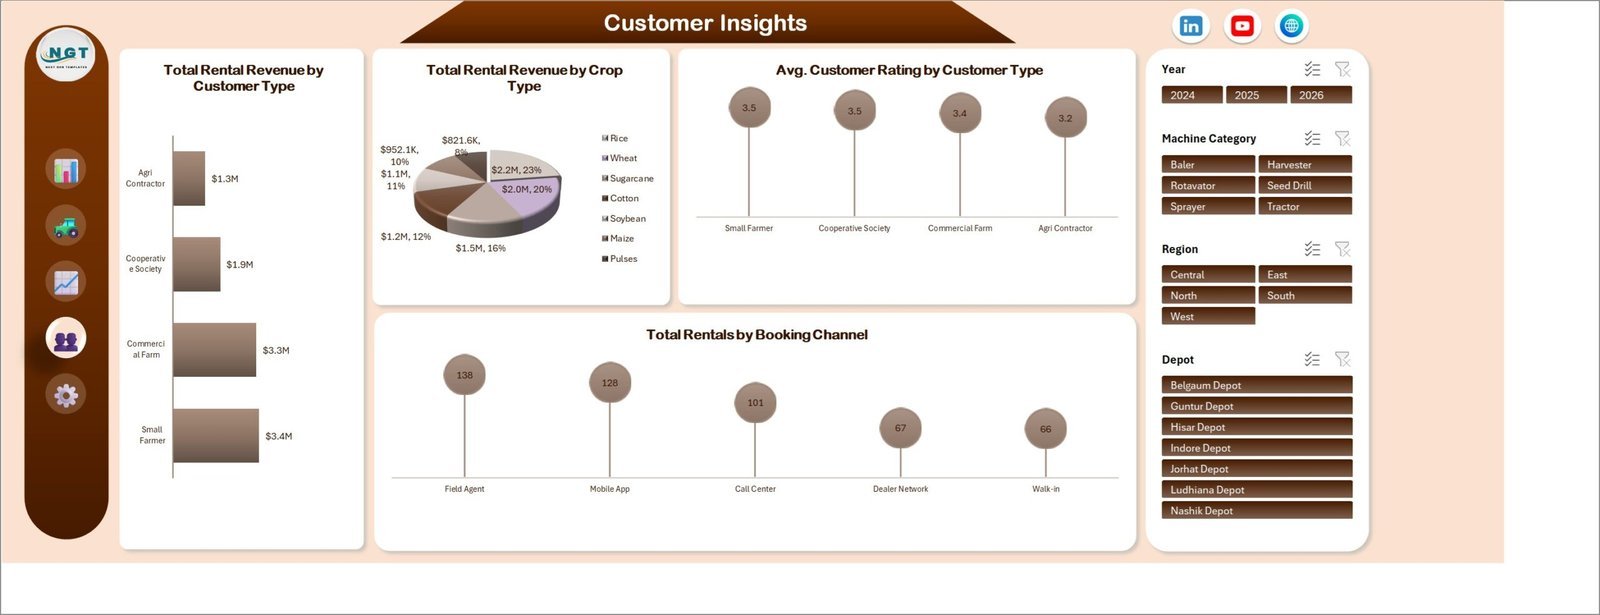
- Customer insights: Track revenue by customer type, crop type, rating, and booking channel.
- Operations efficiency: Analyze on-time returns, depot downtime, rental status, and regional return percentage.
- Refreshable pivots: Update the Data sheet, click Refresh All, and let the support pivots feed the charts.
What’s Inside the Agro Machinery Rental Dashboard in Excel
1. Overview Page
The Overview page is the executive summary for rental performance. The four cards show Total Rental Revenue, Net Operating Profit, Total Rentals, and Total Engine Hours so managers can quickly review scale, profitability, demand, and equipment usage.
Avg. Customer Rating: This chart shows the average customer satisfaction score. It helps identify whether service quality is improving or whether rental experience issues need attention.
Rental Revenue vs Overall Operating Cost by Month: This chart compares monthly income with total operating cost. It helps teams spot months where cost pressure reduces rental profit.
Total Rental Revenue by Machine Category: This chart shows which machine categories contribute the most revenue. It helps prioritize high-demand categories for maintenance and fleet planning.
Net Operating Profit by Region: This chart compares profit across regions. It helps leaders identify strong territories and regions that need pricing, utilization, or cost review.
Operating Margin % by Depot: This chart shows margin percentage by depot. It helps depot managers compare efficiency beyond absolute revenue.
2. Fleet Analysis
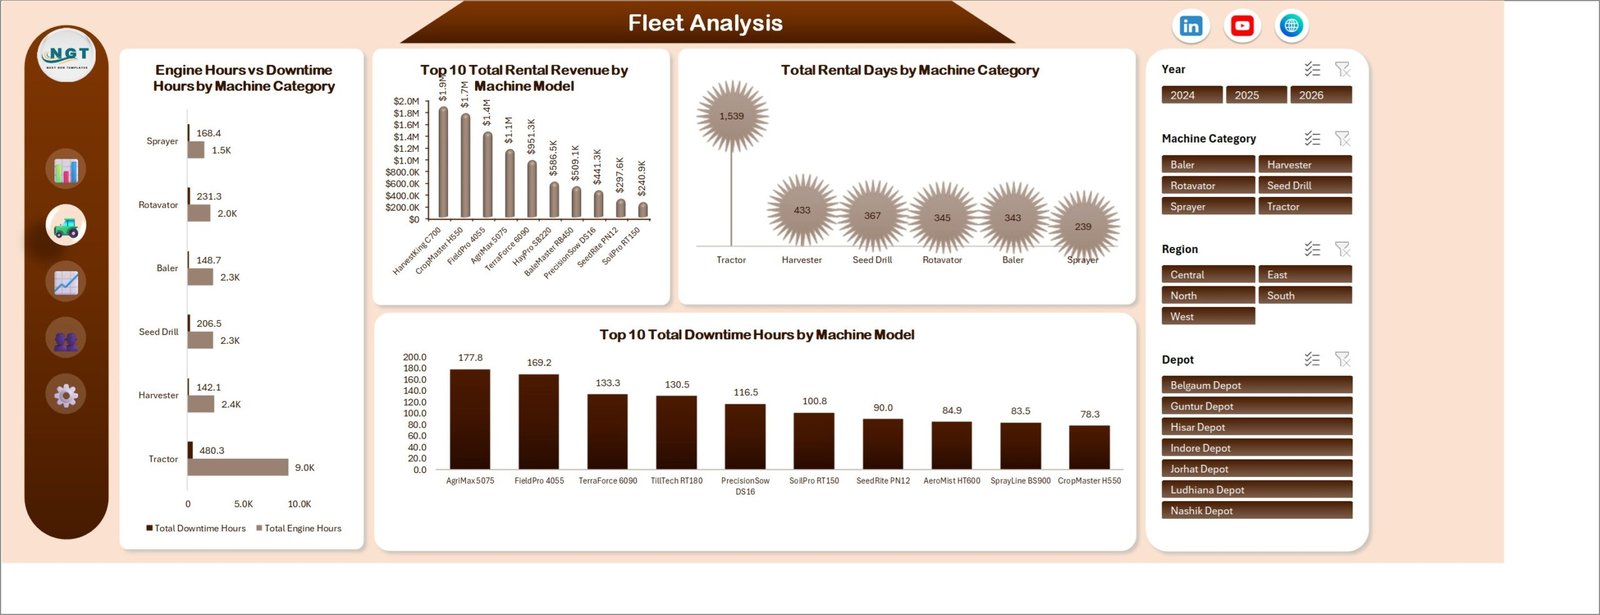
The Fleet Analysis sheet focuses on machine use and maintenance burden. It includes Engine Hours vs Downtime Hours by Machine Category, Total Rental Revenue by Machine Model, Total Rental Days by Machine Category, and Total Downtime Hours by Machine Model.
3. Revenue Trend
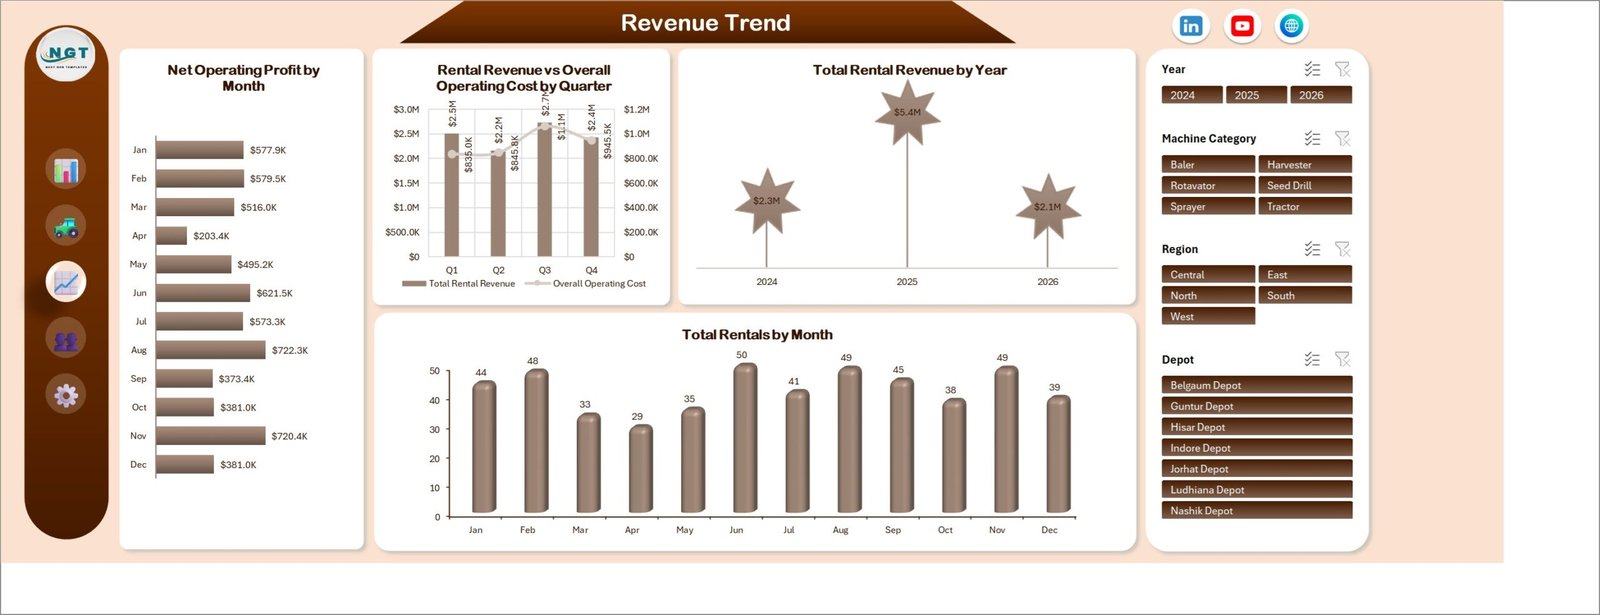
The Revenue Trend sheet is built for finance and management review. It includes Net Operating Profit by Month, Rental Revenue vs Overall Operating Cost by Quarter, Total Rental Revenue by Year, and Total Rentals by Month.
4. Customer Insights
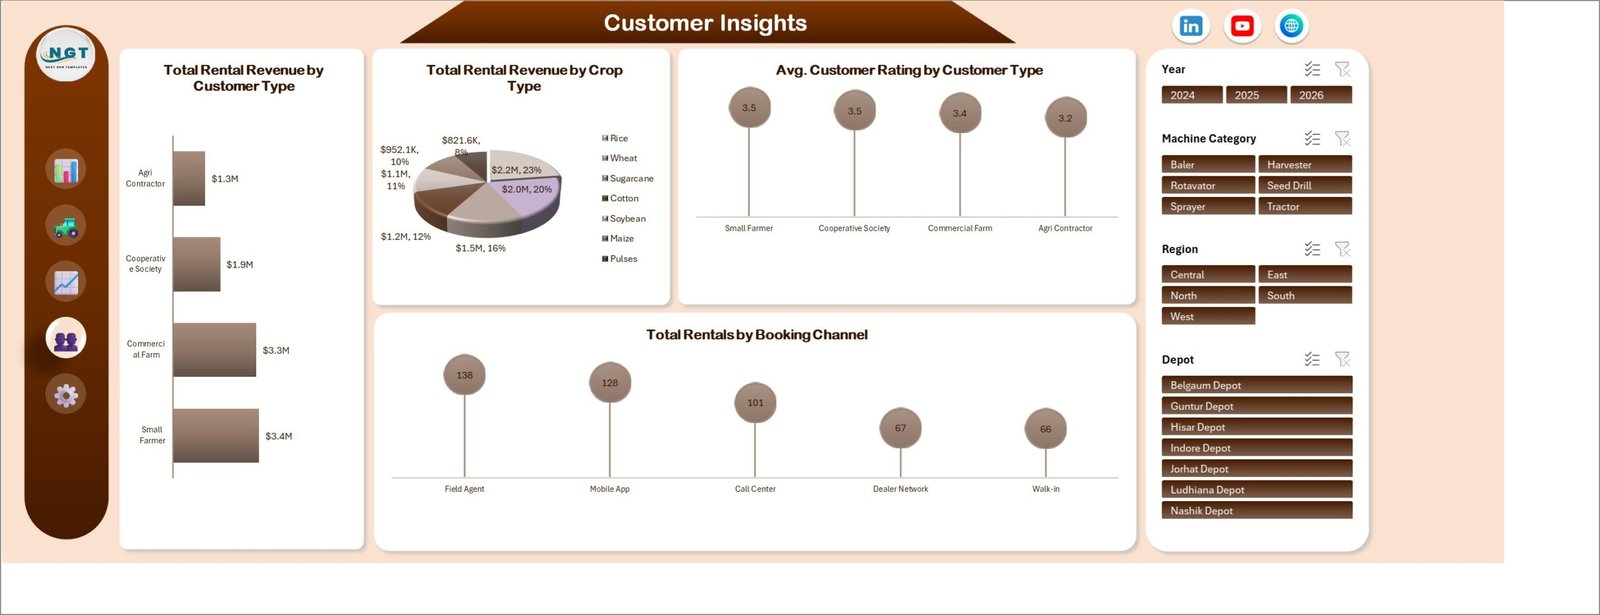
The Customer Insights sheet explains who rents equipment and through which channels. It includes Total Rental Revenue by Customer Type, Total Rental Revenue by Crop Type, Avg. Customer Rating by Customer Type, and Total Rentals by Booking Channel.
5. Ops Efficiency
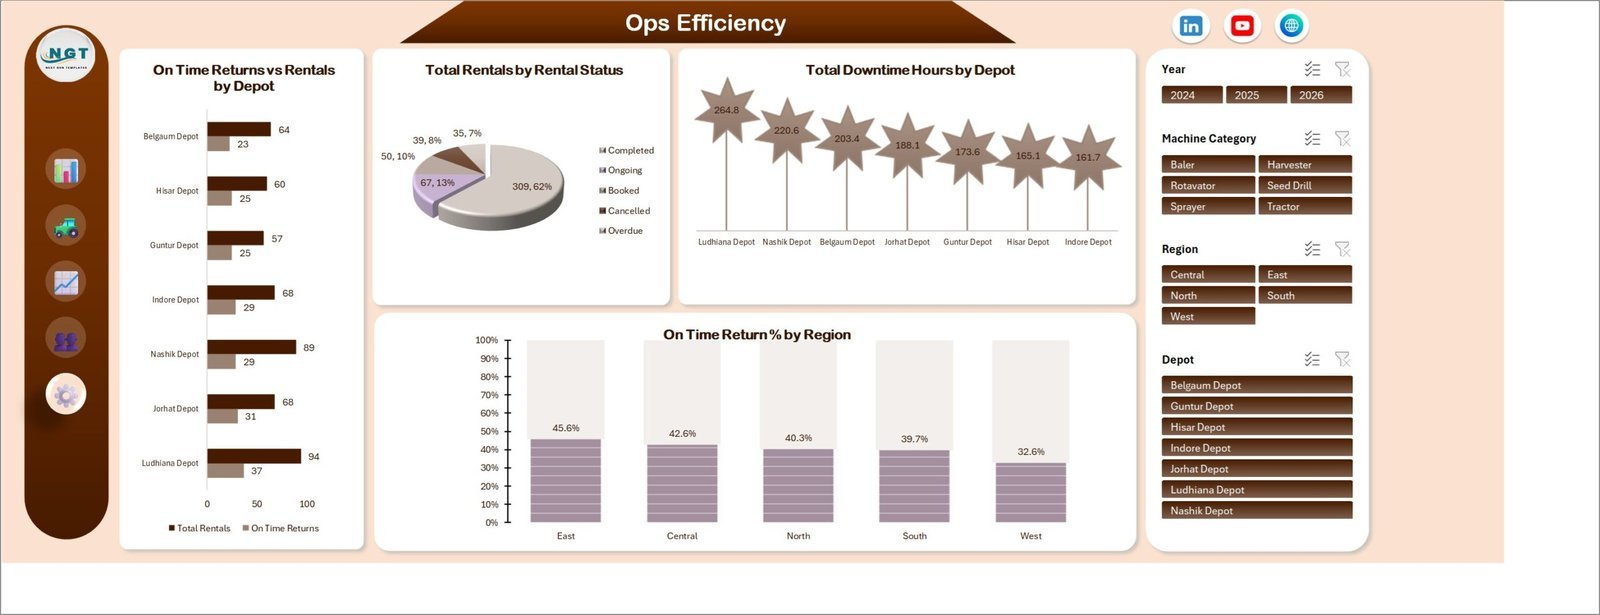
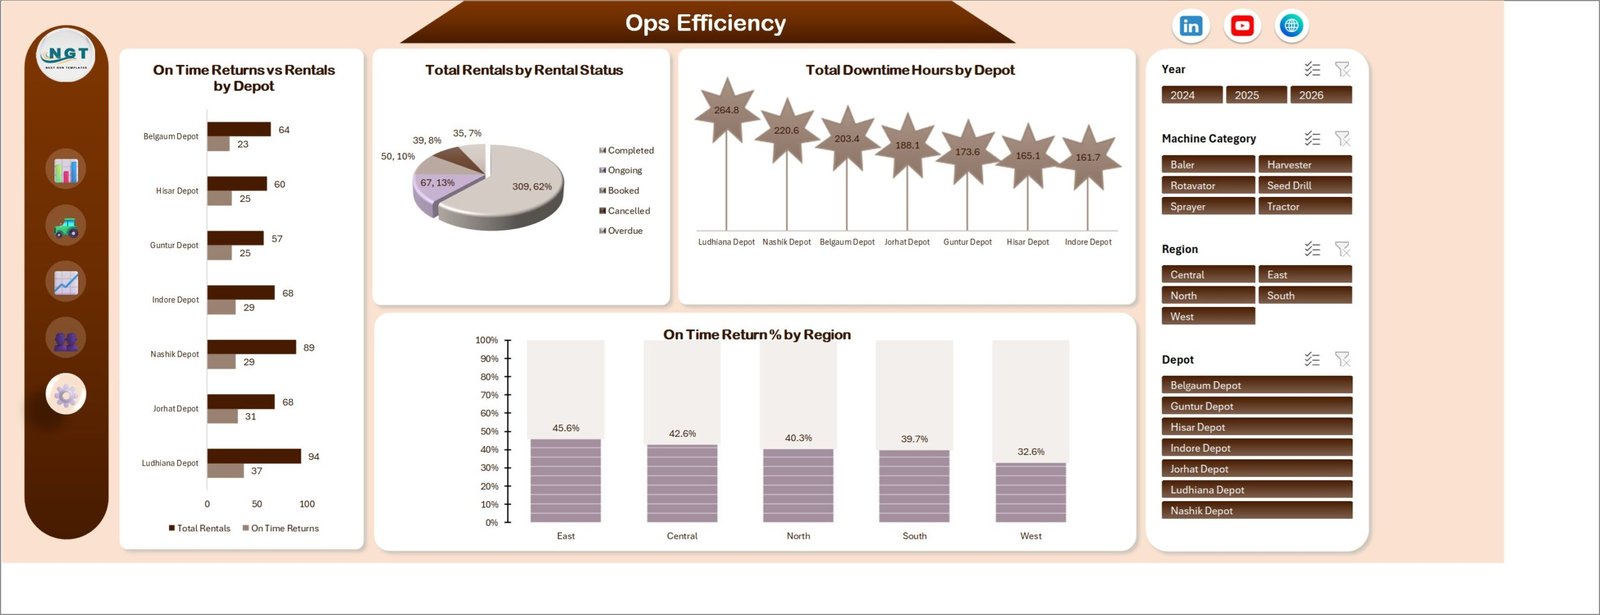
The Ops Efficiency sheet helps depot and operations teams monitor return discipline and downtime. It includes On Time Returns vs Rentals by Depot, Total Rentals by Rental Status, Total Downtime Hours by Depot, and On Time Return % by Region.
6. Data Sheet Tab
The Data sheet is where users add rental records in the same format as the sample data. Keeping the data structure consistent helps all charts, pivots, cards, and slicers update correctly after refresh.

7. Support Sheet
The Support sheet contains the pivot tables used to make the dashboard dynamic. After updating the Data sheet, go to the Data tab in the Excel ribbon and click Refresh All. You can keep this sheet hidden during normal dashboard use.

Agro Machinery Rental Dashboard in Excel vs. Google Sheets vs. Paid CRM/SaaS – Where This Fits
| Feature | This Excel dashboard | Google Sheets alternative | Paid rental SaaS |
|---|---|---|---|
| Cost | $17.99 one-time sale price | Low software cost but manual build required | Recurring monthly or annual subscription |
| Platform | Microsoft Excel | Browser spreadsheet | Vendor-hosted app |
| Setup time | Replace data and refresh pivots | Build data model, charts, and filters manually | Onboarding and configuration required |
| Collaboration | Share through OneDrive or SharePoint | Native browser collaboration | Usually included by user seat |
| Custom fields | Editable workbook fields and charts | Editable but manual | Depends on vendor permissions |
| Year-1 cost at 5 users | $17.99 plus Excel access if needed | Workspace cost plus build time | Often much higher due to subscriptions |
| Rental fleet views | Revenue, cost, profit, engine hours, downtime, customer rating, depot, region, crop type, booking channel, and return status | Must be designed manually | Depends on module purchased |
Who This Template Is For – and Who It’s Not For
Best for: agro machinery rental companies, farm equipment dealers, cooperative equipment banks, depot managers, finance analysts, fleet coordinators, and consultants preparing machinery rental reports in Excel.
Not for: teams needing live GPS tracking, payment processing, contract e-signing, automated dispatch, customer portals, service ticket workflows, or multi-user permission systems.
How to Use the Agro Machinery Rental Dashboard in Excel
- Download and unzip the Excel file.
- Open the workbook in Microsoft Excel.
- Replace the sample rental records in the Data sheet using the same columns.
- Go to the Data tab in the Excel ribbon and click Refresh All.
- Use slicers to filter by time period, region, depot, machine category, customer type, crop type, booking channel, and rental status.
- Review Overview first, then use Fleet Analysis, Revenue Trend, Customer Insights, and Ops Efficiency for deeper decisions.
Real-World Use Cases
Anika, depot operations manager: reviews on-time returns, downtime hours, rentals, and depot margin before weekly planning.
Rohan, fleet coordinator: compares machine models by revenue, rental days, engine hours, and downtime to prioritize maintenance.
Meera, agriculture finance analyst: tracks monthly revenue, quarterly cost, yearly revenue, and net operating profit before management reporting.
Frequently Asked Questions
What does this dashboard track?
It tracks rental revenue, net operating profit, rentals, engine hours, downtime, machine category, machine model, customer type, crop type, booking channel, depot, region, rental status, return timing, and operating margin.
Can I use my own machinery rental data?
Yes. Add your records in the Data sheet using the same structure, then refresh all pivots and charts.
Does the workbook require macros?
No. The dashboard is built around Excel data, pivots, charts, slicers, and refreshable support tables.
Can the Support sheet be hidden?
Yes. The Support sheet contains pivots used by the dashboard and can stay hidden during normal use.
Is this a full rental management system?
No. It is a reporting dashboard for prepared rental data, not a dispatch, billing, contract, or customer portal system.
Can I customize the charts?
Yes. Excel users can edit chart formatting, labels, slicers, fields, colors, and worksheet layout.
About the Author
Built by PK – Microsoft Certified Professional with 15+ years of Excel, Google Sheets, and Power BI experience. Founder of NextGenTemplates, reaching 300K+ subscribers across YouTube channels. Every template is hand-built and tested before release.
Explore Related Templates
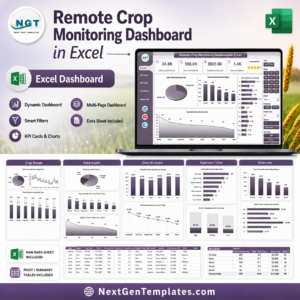
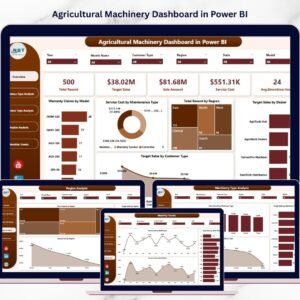
Pair this workbook with Agri Insurance Dashboard in Excel, Remote Crop Monitoring Dashboard in Excel, Agricultural Machinery Dashboard in Power BI, and Agriculture KPI Scorecard in Excel. Browse more Excel dashboard templates and MS Excel templates.
Detailed blog post: Agro Machinery Rental Dashboard in Excel.
Download the Agro Machinery Rental Dashboard in Excel to review rental revenue, machine utilization, downtime, profit, customer behavior, depot efficiency, and return performance in one editable workbook.
Last updated: August 11, 2026.





















Reviews
There are no reviews yet.