


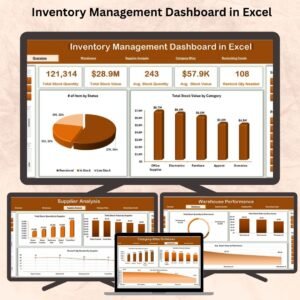
Managing inventory manually or using scattered tools often leads to delays, stockouts, or overstocking. The Inventory Management Dashboard in Excel changes that. Designed for modern businesses, this all-in-one Excel solution empowers you to monitor and manage inventory across categories, warehouses, and suppliers—with no code, no subscriptions, and no stress.
Whether you’re running a retail shop, wholesale operation, or multi-location business, this dashboard turns raw data into visual insights that help you stay in control.
✨ Key Features of the Inventory Dashboard
🗂️ Page Navigator
A sleek navigation bar on top allows you to move across five analytical pages in one click—no scrolling or searching required.
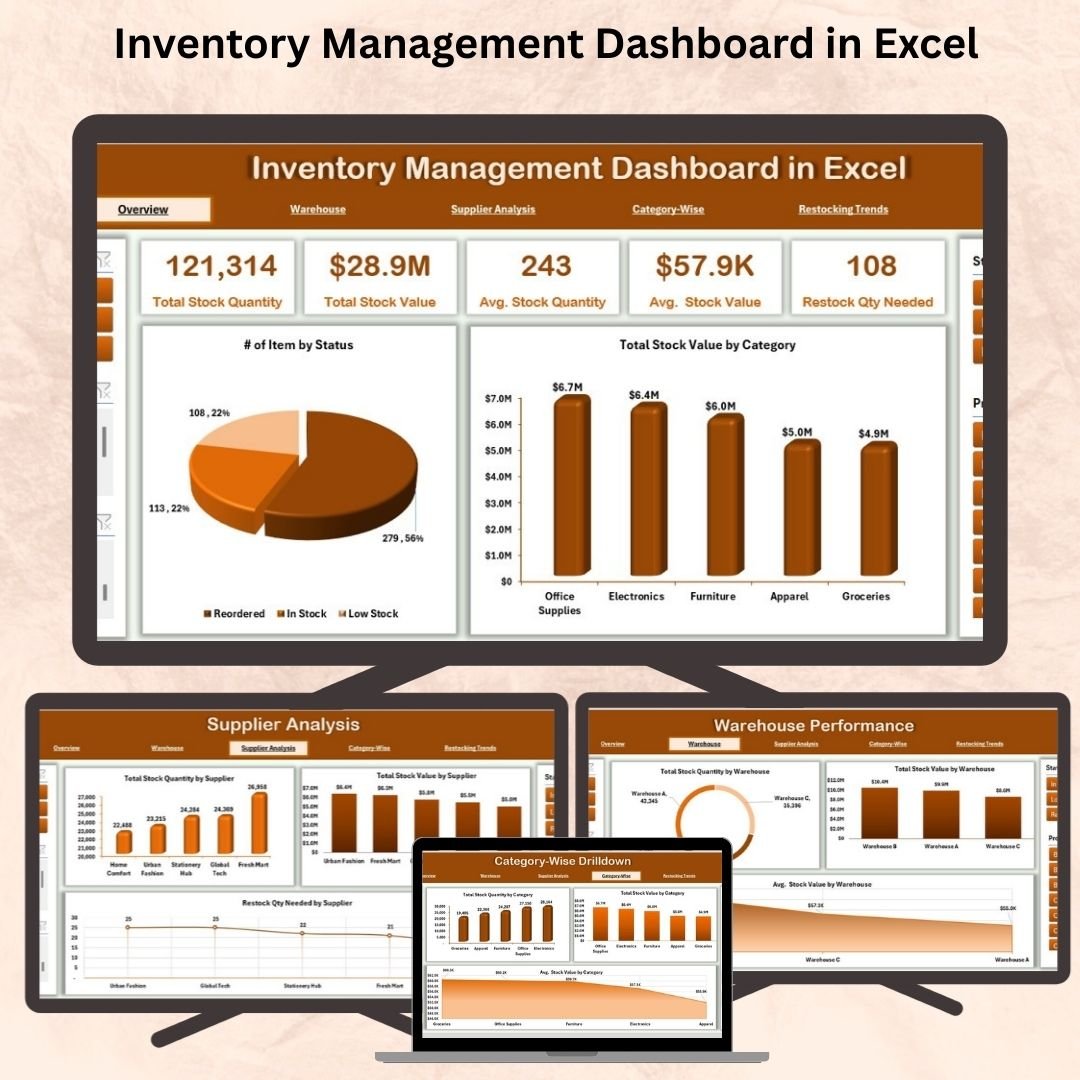
📊 Overview Page – One-Glance Summary
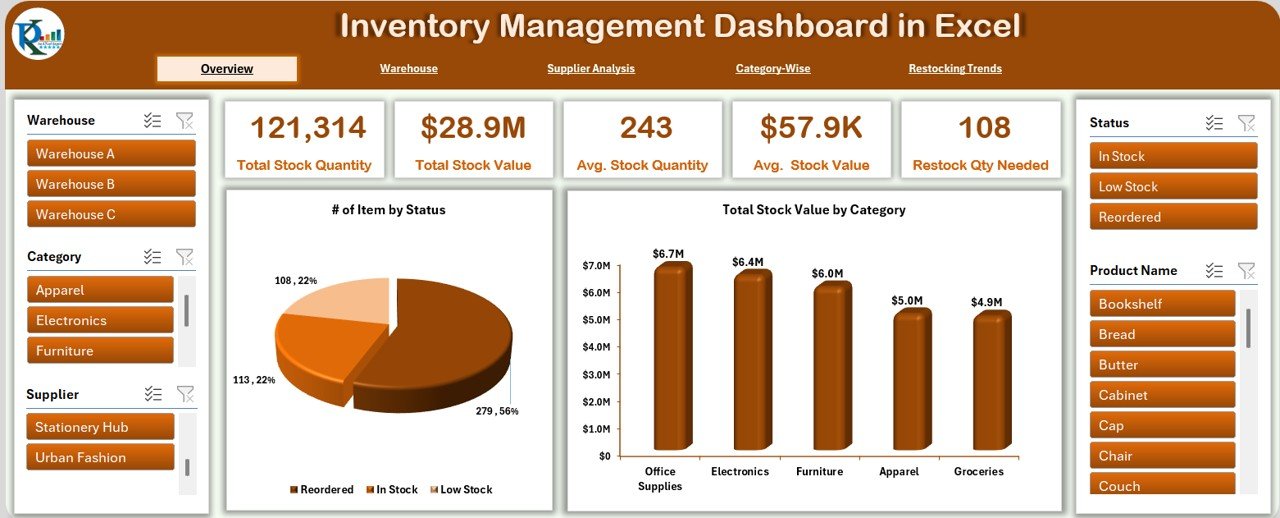
This page gives you a birds-eye view of overall inventory health:
🎯 KPI Cards: Stock Status, Total Quantity, Total Value, Low Stock Count, and Restocking Needs
📈 Charts:
Number of Items by Status
Total Stock Value by Category
🎚️ Slicers: Filter by Category, Status, or Warehouse instantly
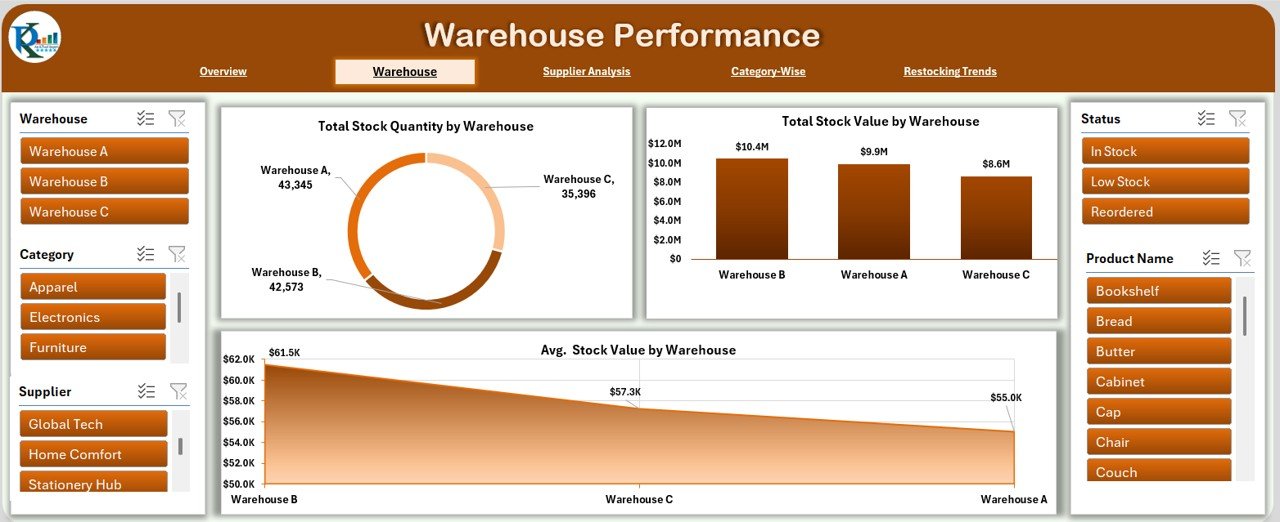
🏭 Warehouse Performance Page
Monitor warehouse-level performance in seconds:
💡 5 KPIs: Total Units, Total Value, Avg. Value, Stock Movement, Low Stock Alerts
📊 Charts:
Stock Quantity by Warehouse
Stock Value by Warehouse
Average Value per Warehouse
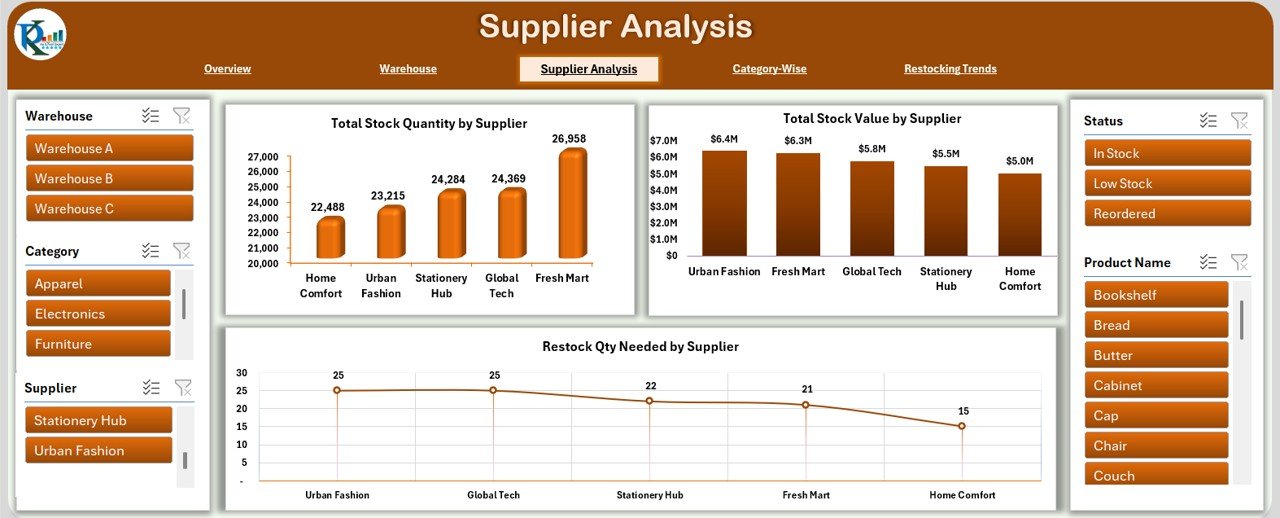
🚛 Supplier Analysis Page
Track supplier efficiency and stock impact:
✅ KPIs: Quantity Supplied, Value Supplied, Fulfillment Rate, Restock Alerts
📊 Charts:
Total Quantity by Supplier
Total Value by Supplier
Restocking Needs by Supplier
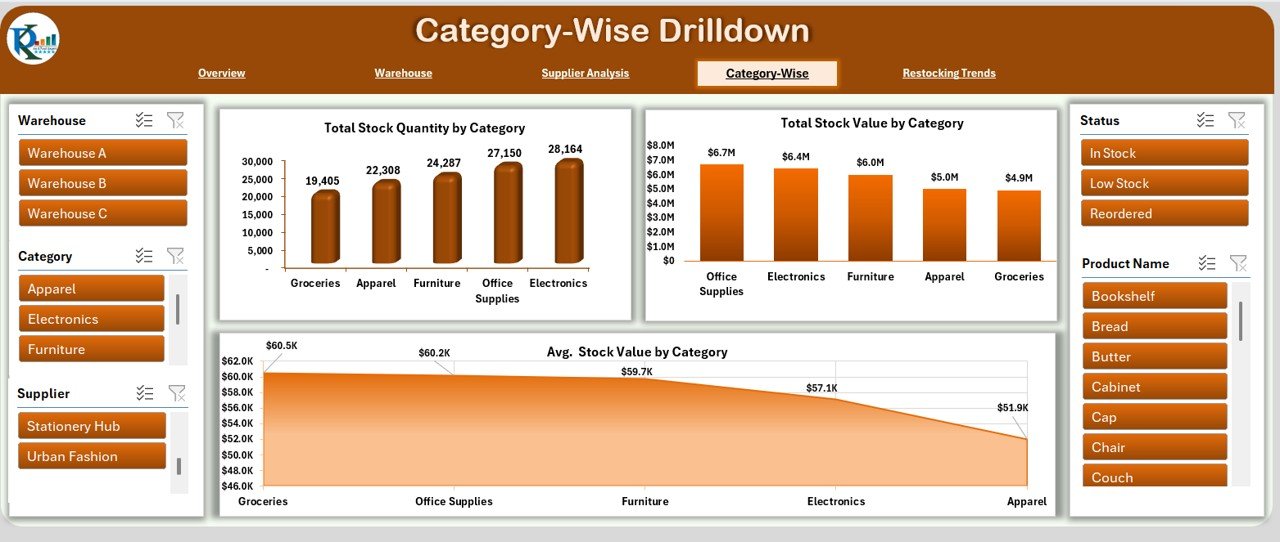
📂 Category-Wise Drilldown Page
Analyze performance by product category:
🧾 KPIs: Total Quantity, Avg. Value, Category Count, Value Share
📊 Charts:
Quantity by Category
Value by Category
Average Value by Category
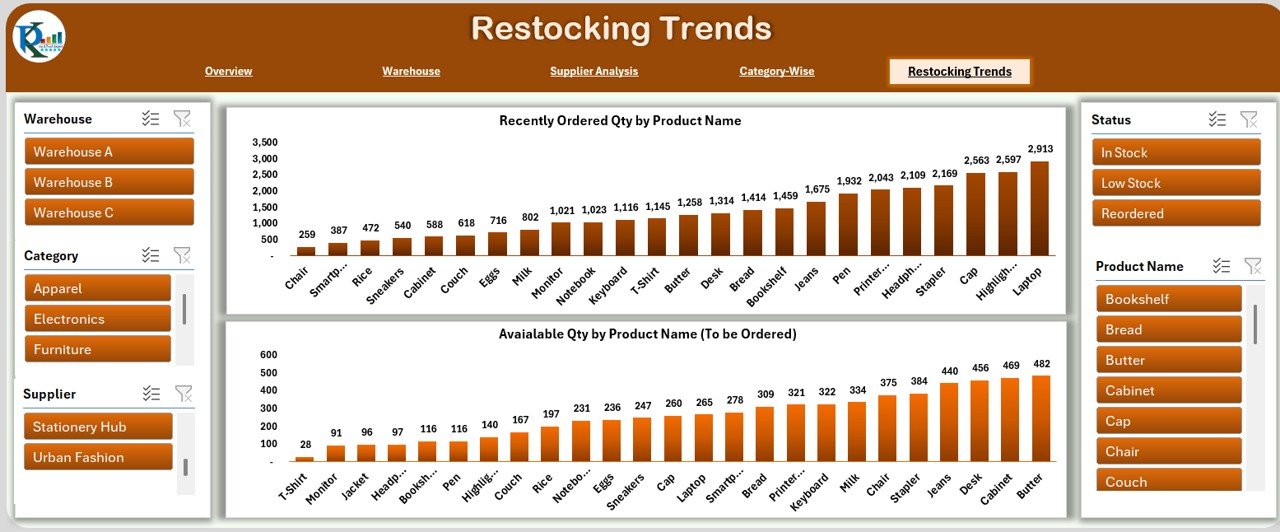
🔁 Restocking Trends Page
Avoid last-minute stockouts with smart trends:
🔔 KPIs: Recently Ordered, Needed Stock, Reorder Flags
📊 Charts:
Recently Ordered Quantity
Items Needing Immediate Reorder
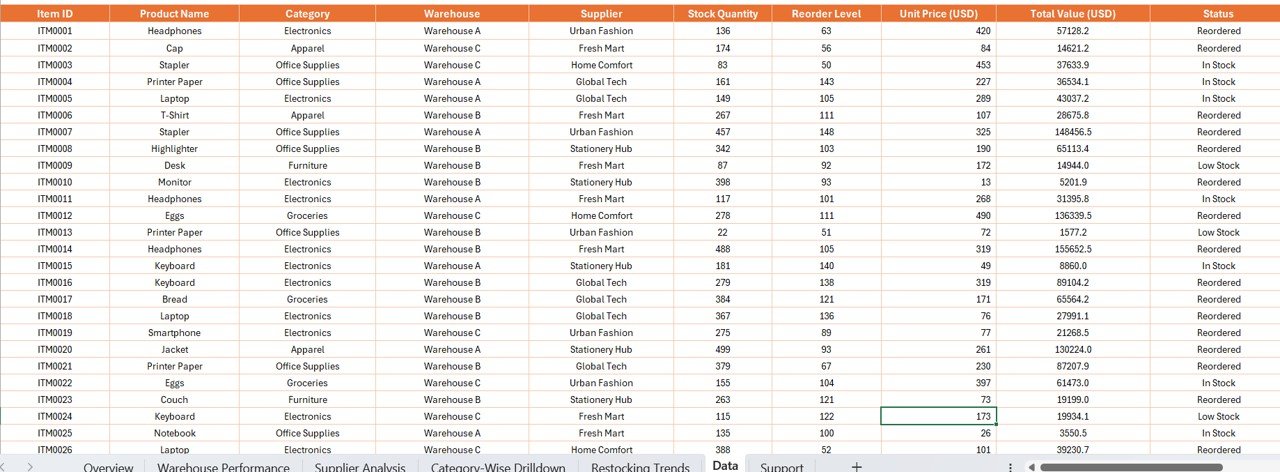
🧮 Data Sheet (Backend)
Organized and filter-ready database that feeds the entire dashboard. Key columns:
Item ID, Product Name, Category, Supplier, Warehouse
Quantity, Reorder Level, Unit Price, Stock Status
Last & Recent Restock Date, Total Value, Restock Flags
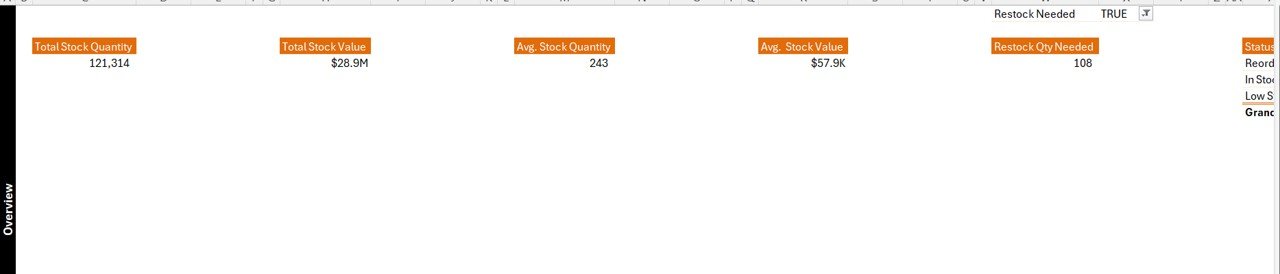
⚙️ Support Sheet
Used for managing drop-downs and formulas, this hidden helper sheet keeps your dashboard dynamic, user-friendly, and customizable.
🚀 Advantages of the Excel Inventory Dashboard
📊 Real-Time Insights – Instantly updates metrics and visuals with new data
💡 No Coding Required – 100% Excel-based, ready to use
💰 Zero Subscription Costs – Use it forever, no SaaS fees
🧩 Fully Customizable – Add more columns, KPIs, or visuals
📦 Ideal for SMBs and Large Operations – Scales with your inventory volume
🗂️ Cross-Warehouse Reporting – View totals and trends across multiple warehouses
✅ Best Practices for Usage
🗓 Update Weekly or Daily – Keep your data fresh for accurate visuals
🔐 Back Up Before Editing – Avoid accidental loss during updates
📌 Train Your Team – Share a 5-minute walkthrough to get others up to speed
🛑 Set Clear Reorder Levels – Automate low-stock alerts with clarity
💬 Use Consistent Naming – Prevent report errors due to typos in product, supplier, or category names
🧠 Why Choose Excel Over Other Inventory Tools?
🧵 Familiarity – No steep learning curve
✏️ Flexibility – Customize anything—columns, visuals, KPIs
🌐 Shareability – Email, cloud, or OneDrive compatible
🔌 Integration Friendly – Connect with Power Query or import from other systems
🔍 What You Can Analyze with This Dashboard
Stock status (In stock, Low stock, Out of stock)
Warehouse trends (High/low volume & value)
Supplier performance and stock impact
Restock alerts and pending needs
Category contribution and product rotation
📘 Click here to read the Detailed blog post
🎥 Visit our YouTube channel for step-by-step tutorials






























Reviews
There are no reviews yet.