

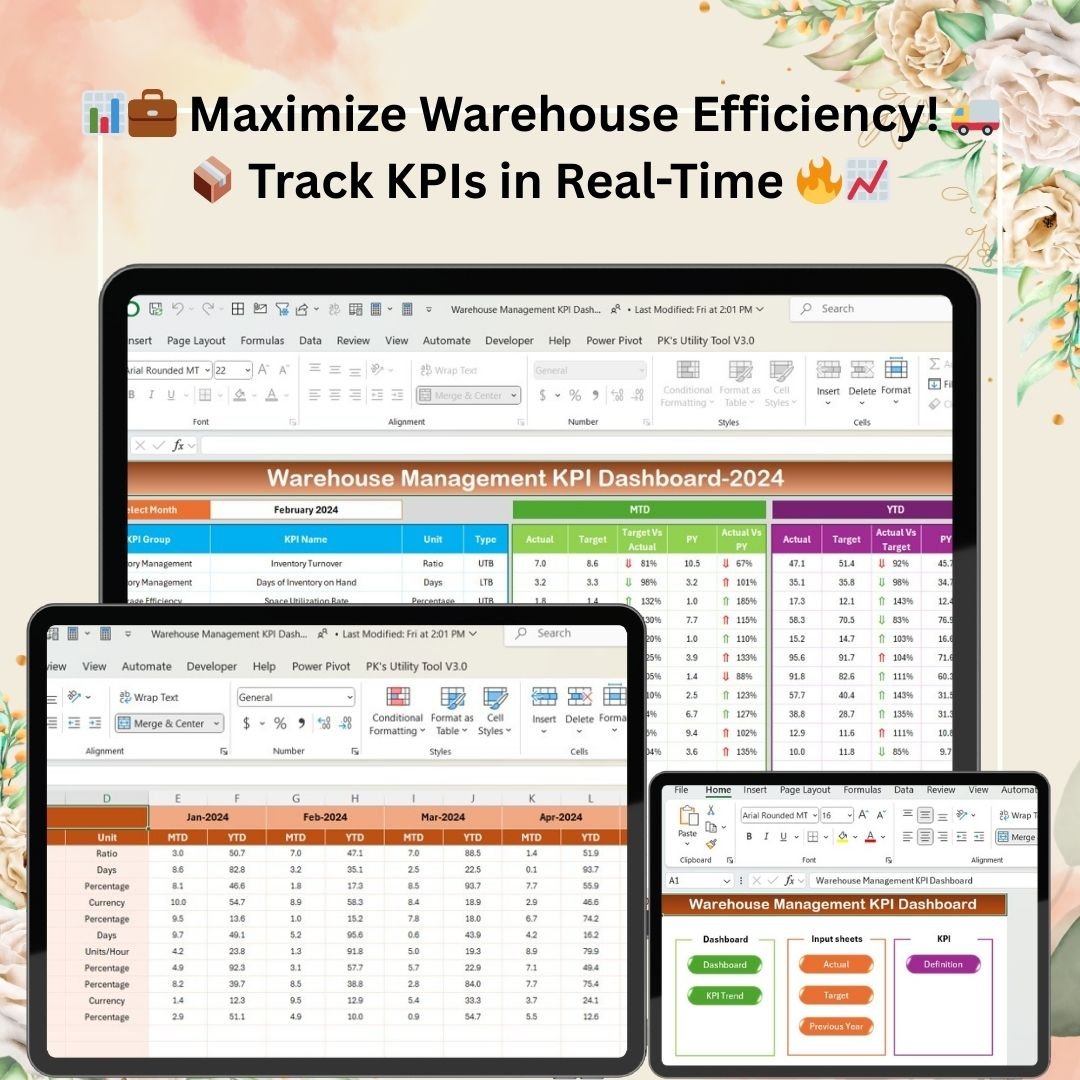



The Warehouse Management KPI Dashboard in Excel is an interactive, ready-made template for tracking warehouse performance in one place. It is built for warehouse managers, supply chain professionals and logistics teams who want clear Month-to-Date (MTD) and Year-to-Date (YTD) views of KPIs covering inventory management, storage efficiency, order processing, shipping and customer satisfaction. The result is faster, data-driven decisions and better-run warehouse operations.

Key Features
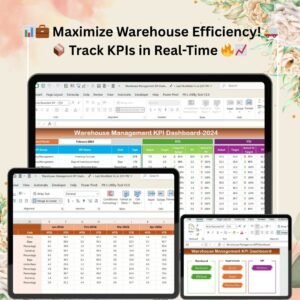
- MTD and YTD performance view: The main dashboard shows Month-to-Date and Year-to-Date results for every KPI, alongside Target and Previous Year (PY) figures.
- Month selection dropdown: Pick any month from the dropdown and the KPI values for Actual, Target and Previous Year update automatically.
- Color-coded arrows: Conditional formatting with arrows and colors shows at a glance whether each KPI is meeting expectations or deviating from target.
- KPI trend charts: The KPI Trend sheet charts MTD and YTD actuals against targets and previous-year data, so you can follow KPIs such as inventory turnover and space utilization over time.
- Target setting: Define monthly and yearly targets for each KPI to create clear benchmarks.
- Year-over-year comparison: Enter previous year numbers to compare current warehouse performance with historical results.
- Clear KPI definitions: Each KPI comes with its group, unit, type (lower or upper is better), formula and definition for consistent interpretation.
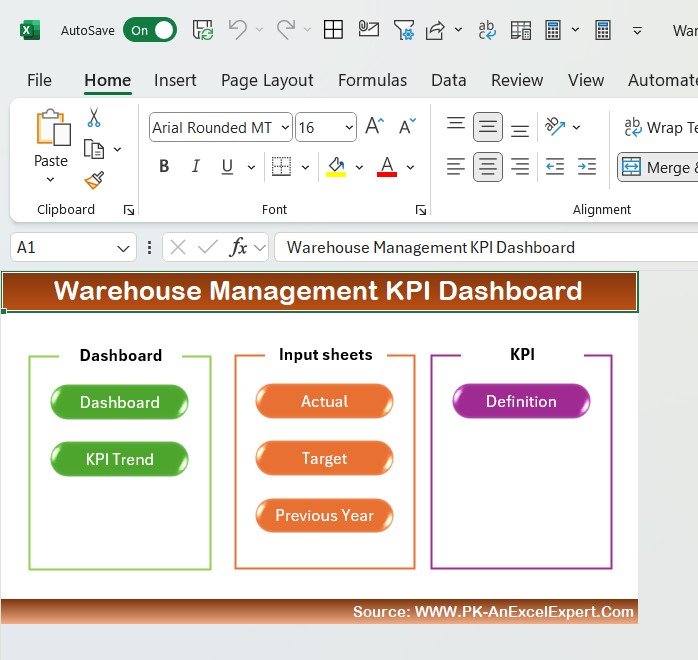
- Easy navigation: A Home sheet with 6 buttons takes you to each section, so even users without advanced Excel skills can move around quickly.
What’s Inside: Sheets in the Template
| Sheet | What it does |
|---|---|
| Home Sheet | Interactive index with 6 navigation buttons for quick access to every section of the dashboard. |
| Dashboard Sheet | Displays MTD and YTD Actual, Target and Previous Year values for each KPI, with a month dropdown and color-coded trend arrows. |
| KPI Trend Sheet | Select a KPI to see its group, unit, type, formula and definition, plus trend charts comparing MTD and YTD actuals, targets and PY data. |
| Actual Numbers Input Sheet | Dedicated area to enter actual performance data for each KPI; the dashboard adjusts automatically for monthly and yearly tracking. |
| Target Sheet | Enter monthly and yearly target values for each KPI to benchmark actual performance. |
| Previous Year Numbers Sheet | Input last year’s data to enable year-over-year comparison and spot improvements or challenges. |
| KPI Definition Sheet | Central list of KPI names, groups, units, formulas and definitions so all stakeholders read the metrics the same way. |
Benefits for Your Warehouse
Data-driven decision making
By bringing warehouse data together and comparing it with targets and historical figures, the dashboard helps managers identify areas for improvement and recognise successes quickly, keeping operations on track.
Timely performance monitoring
Because the dashboard updates from your inputs, you can monitor operations as data comes in and intervene when performance drifts from target. Conditional formatting highlights fluctuations so problems stand out.
Streamlined data entry
All calculations flow from the Actual Numbers Input Sheet, minimising the manual effort needed to track performance. Monthly and yearly targets are clearly laid out, making progress easy to follow.
Holistic warehouse overview
The template covers essential warehouse KPIs such as inventory turnover, storage efficiency, order management and shipping performance, helping you optimise everything from space utilization to timely order fulfilment.
Who It’s For
- Warehouse managers who need a single view of warehouse performance
- Supply chain professionals tracking inventory management and delivery KPIs
- Logistics teams monitoring order processing and shipping
- Businesses that want to streamline KPI reporting, improve inventory management and support customer satisfaction
Whether you oversee a small warehouse or manage a larger supply chain network, this Warehouse Management KPI Dashboard provides the tools and insights to improve productivity and performance.
How to Use It
- Review the KPI Definition Sheet to confirm the KPI names, groups, units, formulas and definitions.
- Enter your targets for each KPI, month by month, in the Target Sheet.
- Add previous year numbers in the Previous Year Numbers Sheet for year-over-year comparison.
- Record actual results each month in the Actual Numbers Input Sheet.
- Open the Dashboard, choose a month from the dropdown and review MTD and YTD results with color-coded arrows.
- Use the KPI Trend sheet to select a KPI and analyse its trend charts against target and previous year.
Click here to read the detailed blog post about this dashboard.
Frequently Asked Questions
What KPIs does the Warehouse Management KPI Dashboard in Excel track?
It covers warehouse KPIs related to inventory management, storage efficiency, order processing, shipping and customer satisfaction, including measures such as inventory turnover and space utilization. Every KPI is documented in the KPI Definition Sheet.
Can I see both monthly and year-to-date results?
Yes. The Dashboard sheet shows MTD and YTD values for each KPI, with Actual, Target and Previous Year figures. Select a month from the dropdown to update the view.
How do I compare this year with last year?
Enter historical figures in the Previous Year Numbers Sheet. The dashboard and the KPI Trend sheet then compare current actuals with previous-year data.
Do I need advanced Excel skills?
No. The template is designed for users at all levels. The Home sheet has 6 buttons for navigation, and you only need to type data into the input, target and previous year sheets.
How does the dashboard show whether a KPI is on track?
Conditional formatting adds color-coded arrows that indicate performance against target. Each KPI’s type (lower or upper is better) is defined so results are interpreted correctly.
Where can I learn how the template works?
You can read the detailed blog post linked above, or watch step-by-step video tutorials on our YouTube channel.
Visit our YouTube channel to learn step-by-step video tutorials: Youtube.com/@PKAnExcelExpert
Also check our HR KPI Dashboard
Last updated: October 2026
Compatibility and Requirements
- Works in Microsoft Excel desktop (Excel 2016 or later, or Microsoft 365).
- The month selector on the Dashboard sheet is a drop-down list. Microsoft’s guide Create a drop-down list explains how these lists work.
Related Warehouse and Supply Chain Templates
- Warehouse Management KPI Dashboard in Power BI: the same KPIs in Power BI
- Supply Chain Management Dashboard in Excel: the wider supply chain view
- Inventory Management Dashboard in Excel: focus on stock levels and movement
- Inventory & Warehouse Master Kit: 8 inventory and warehouse templates in one bundle
Browse all Excel KPI dashboards or the Logistics templates.


















Reviews
There are no reviews yet.