

Influencer marketing has become a cornerstone of modern brand growth—but are you measuring its performance effectively?
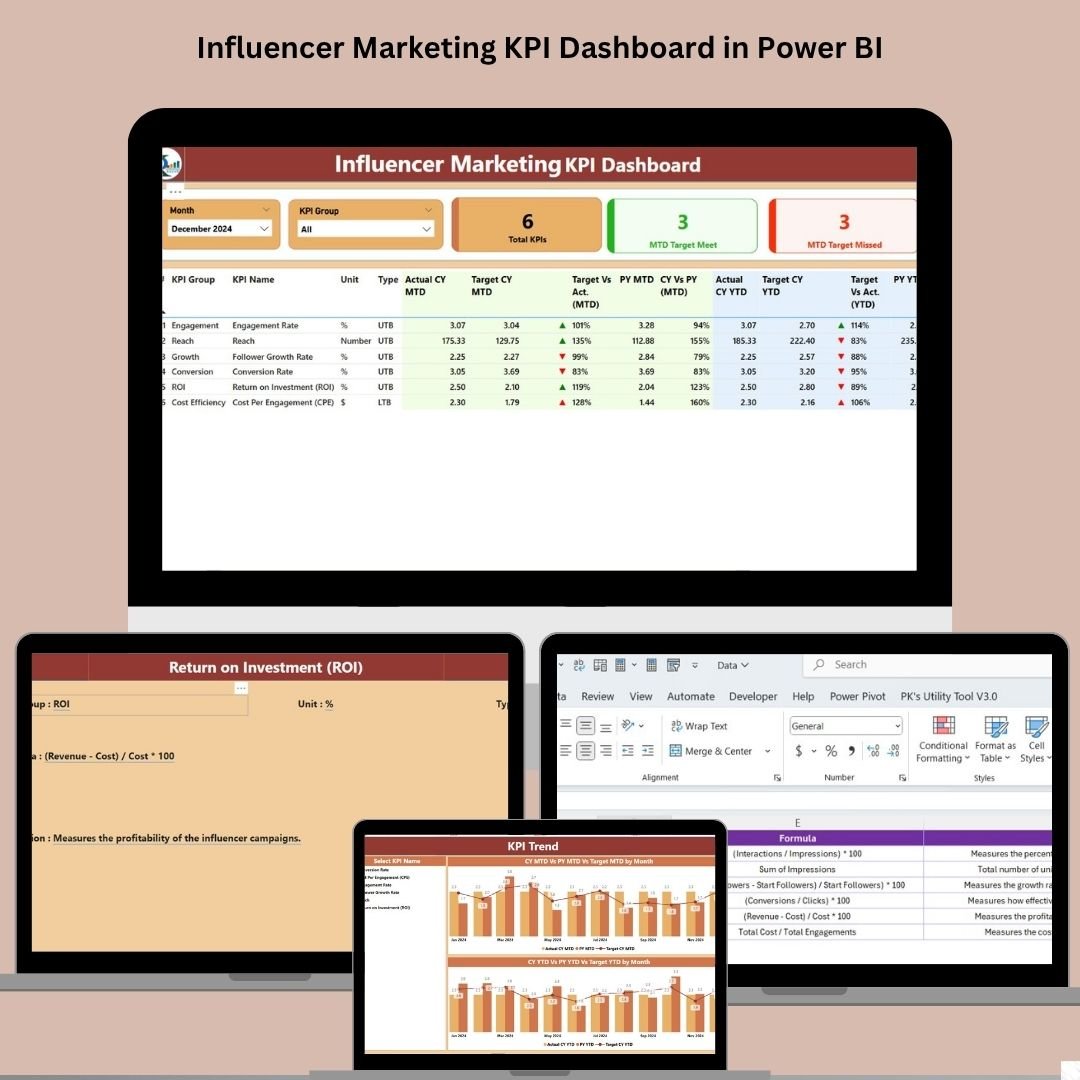
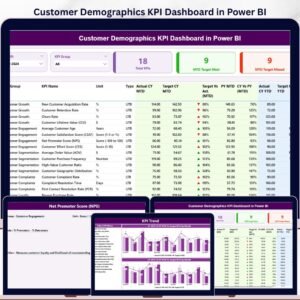
The Influencer Marketing KPI Dashboard in Power BI is a ready-to-use, Excel-powered dashboard designed specifically for marketers, agencies, and brand managers who want real-time clarity on campaign performance. No more static reports or manually stitched data—this tool connects to a simple Excel file and instantly delivers meaningful insights.
Whether you’re evaluating engagement, tracking conversions, or monitoring ROI, this dashboard helps you visualize trends, compare targets, and optimize influencer strategies with confidence.
🔍 What’s Inside the Dashboard?
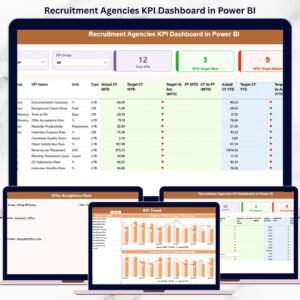
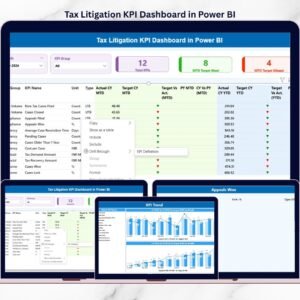
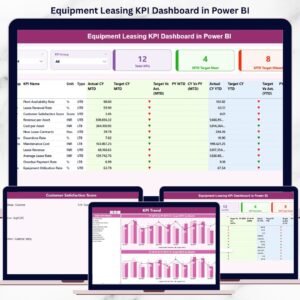
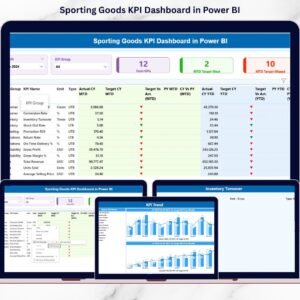
This Power BI file is structured into three intelligent pages that make KPI tracking effortless:
📄 1. Summary Page
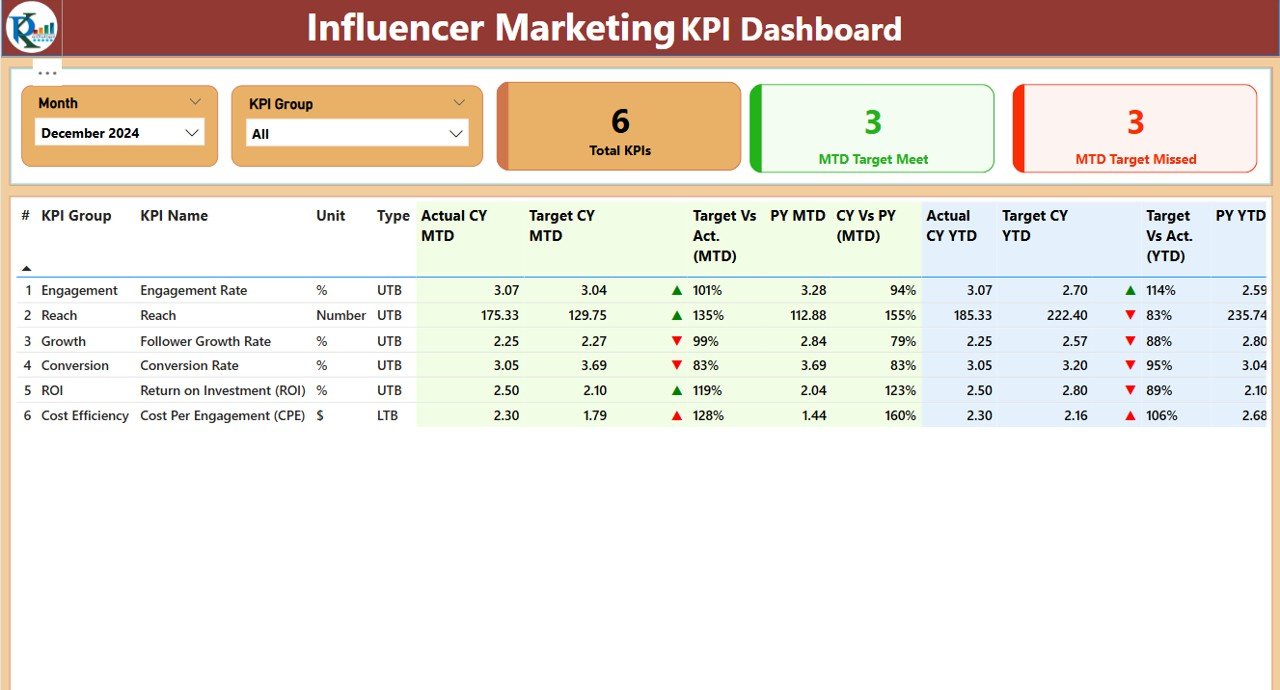
Your high-level control panel with slicers, cards, and a detailed table:
-
Month Selector and KPI Group Filter
-
Cards for Total KPIs, Target Met, and Target Missed
-
A dynamic table with:
-
MTD/YTD Actuals, Targets, Previous Year Values
-
Performance indicators (green/red arrows)
-
% differences vs. targets and PY
-
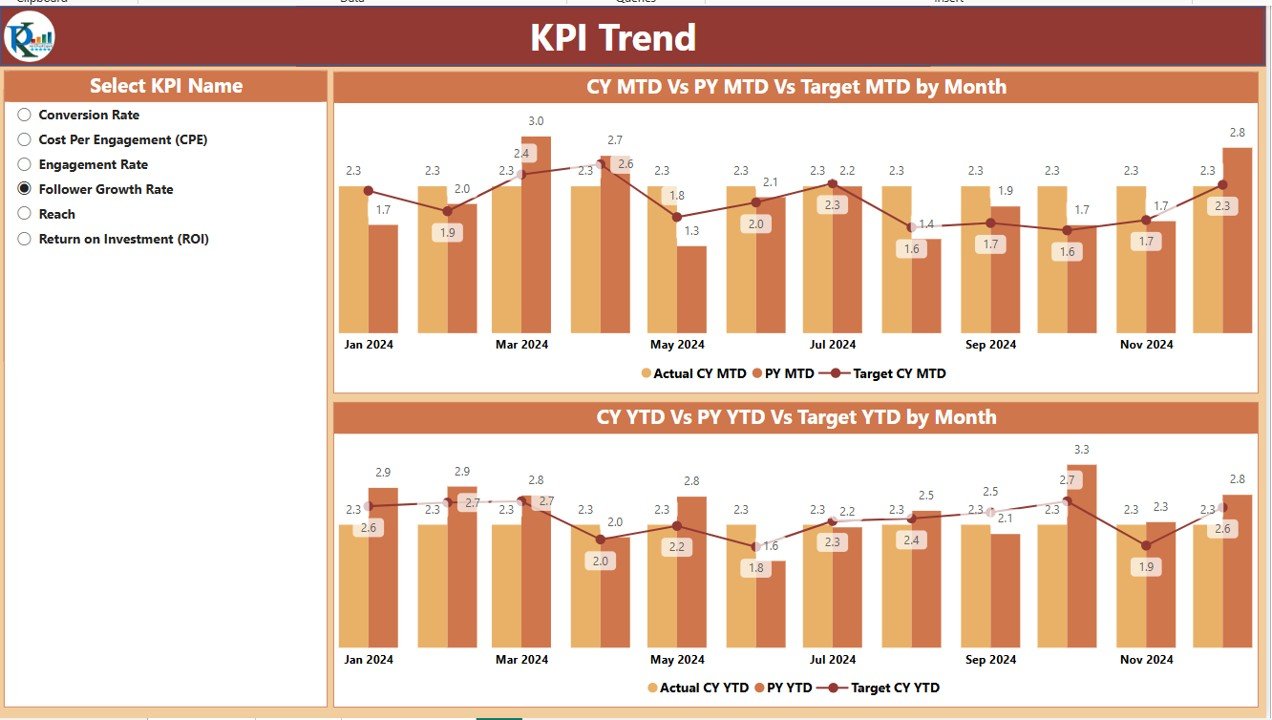
📈 2. KPI Trend Page
Two powerful line+bar combo charts:
-
MTD and YTD trends for Actual vs Target vs PY
-
Includes a KPI Selector for deep focus
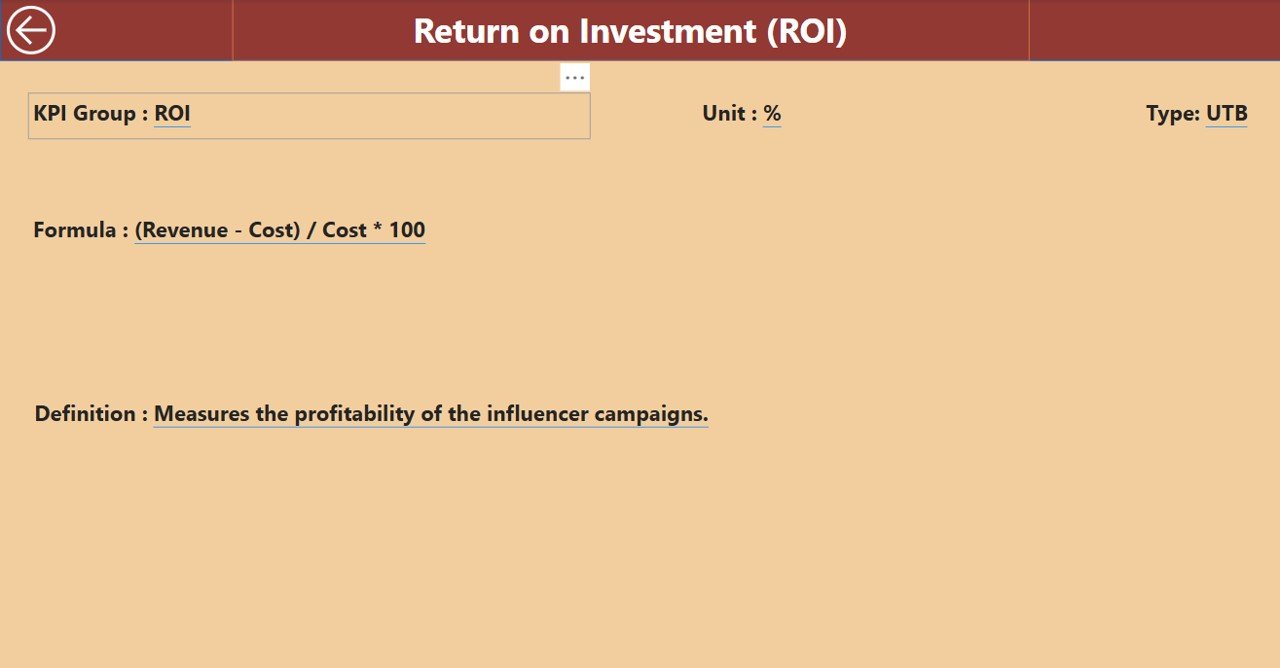
🧾 3. KPI Definition Page
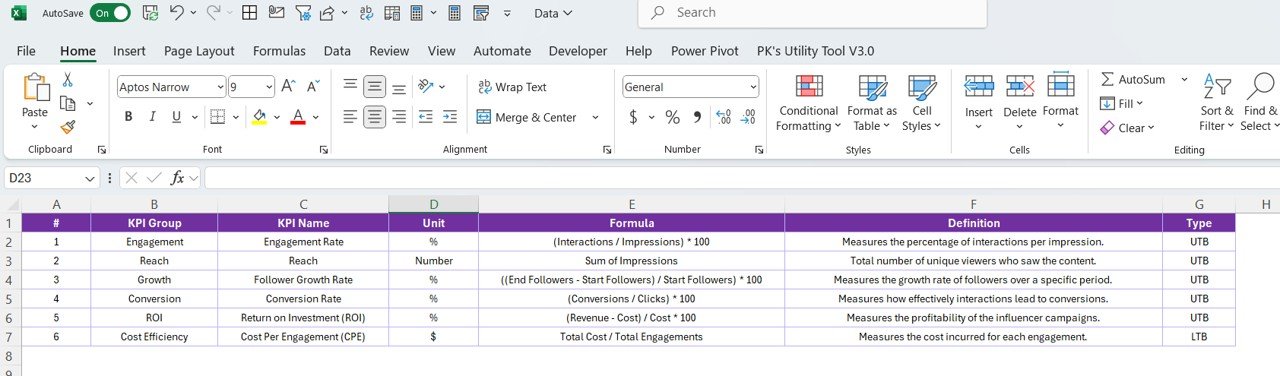
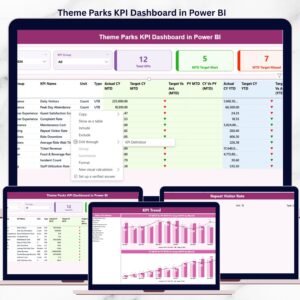
Drill-through enabled view to explore:
-
KPI Name, Formula, Definition, Unit
-
Type indicator (LTB/UTB)
-
Helps your team understand the logic behind each metric
💼 Excel-Powered Data Structure
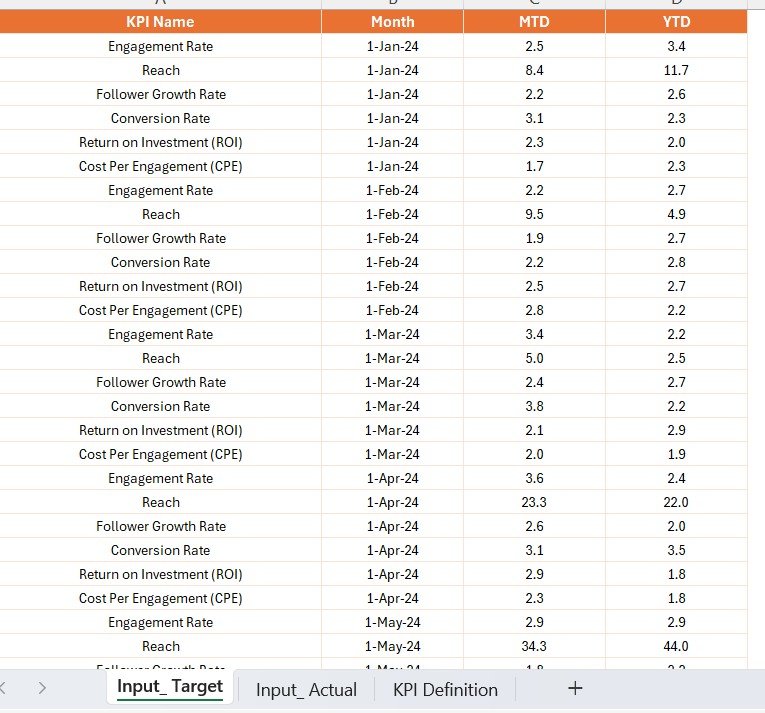
Easily maintain your dashboard with 3 Excel sheets:
-
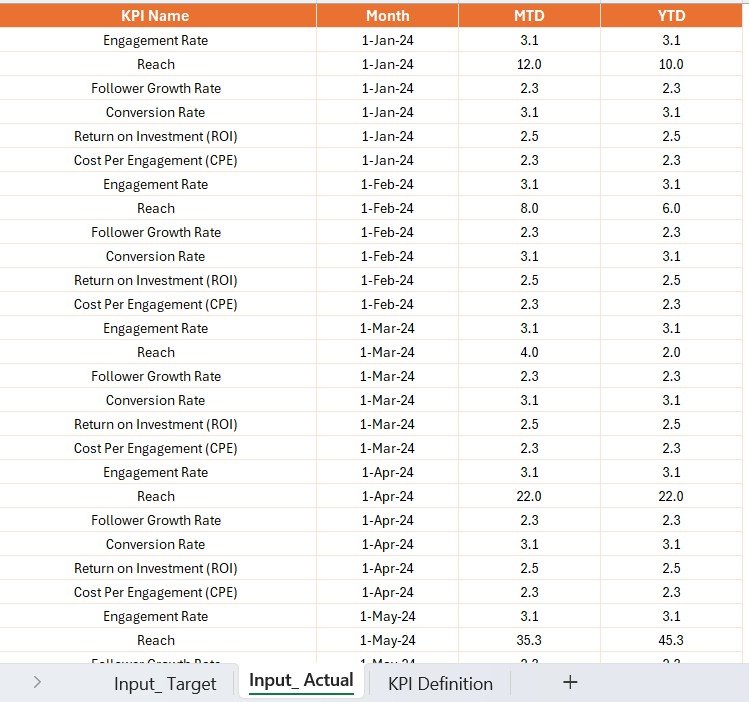
Input_Actual – For monthly and yearly actuals
-
Input_Target – For target goals
-
KPI_Definition – For formulas, units, and type
No coding required. Just enter the data, save, and refresh in Power BI.
🚀 Key Benefits
📡 Real-Time Performance
Make decisions on the fly with always-fresh KPIs and visual summaries.
🧠 Clear Comparisons
See where you stand vs. targets and last year’s performance instantly.
📈 Trend Monitoring
Spot upward or downward shifts before they impact your ROI.
🛠️ Zero Coding Required
Just update Excel. No Power BI expertise needed to get started.
🔍 Drill-Down Insights
Click into any KPI to see its definition and logic without leaving the dashboard.
💡 Best Practices
-
Update your Excel sheets regularly to maintain data accuracy
-
Use categories like Reach, Engagement, Conversion to organize KPIs
-
Customize visuals to match your brand’s style and reporting format
-
Use the Trend Page weekly for actionable forecasting
-
Add filters or new visuals based on your campaign needs
👥 Who Is It For?
This dashboard is perfect for:
-
Marketing Teams tracking ROI from influencers
-
Digital Agencies reporting to clients
-
Brand Managers monitoring campaign KPIs
-
E-commerce Businesses optimizing awareness-to-sales funnel
📦 What You Get
-
Power BI Dashboard File (.pbix)
-
Sample Excel File with prefilled KPIs
-
3 Sheets: Input_Actual, Input_Target, KPI_Definition
-
Fully dynamic visuals and drill-through filters
-
Compatible with Power BI Desktop (2020 or later)
🙋 FAQs
Q: Do I need Power BI skills?
A: Not at all! Just know how to update Excel and click “Refresh” in Power BI.
Q: Can I add new KPIs?
A: Yes—just add them in the Excel file and refresh the report.
Q: Does this dashboard support other data sources?
A: This version uses Excel, but you can upgrade it to connect to APIs, SQL, etc.
Q: How do I know if a KPI is performing well?
A: Look for green arrows! Red indicates underperformance vs. target.
Q: What does UTB and LTB mean?
A: UTB = Upper the Better (e.g., Followers), LTB = Lower the Better (e.g., Cost per Acquisition)










Reviews
There are no reviews yet.