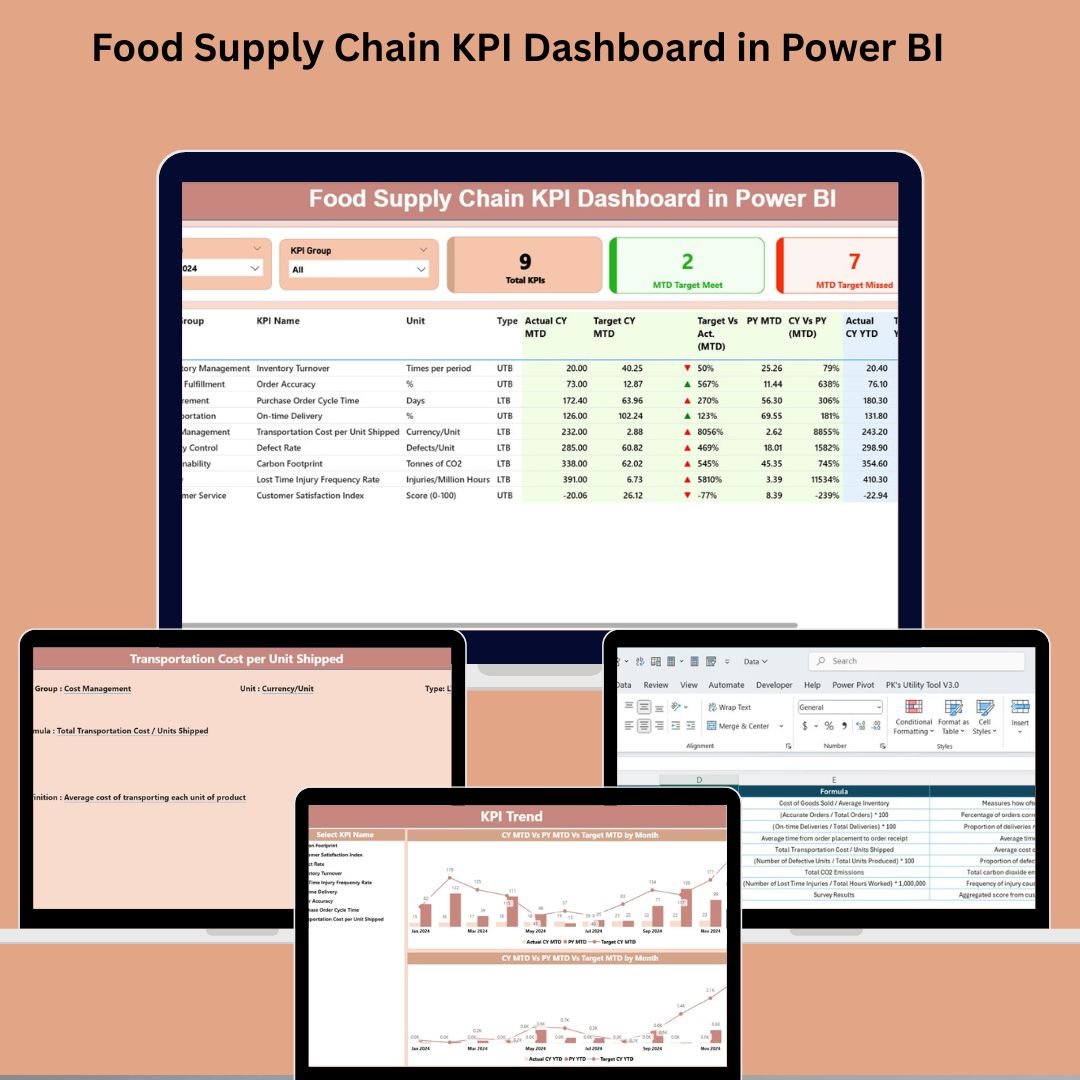
In today’s competitive food industry, efficient supply chain management is the secret sauce to success. From farm to fork, every process must be tracked, measured, and optimized. Introducing the Food Supply Chain KPI Dashboard in Power BI—your all-in-one solution to monitor key performance indicators across sourcing, production, inventory, logistics, and delivery. 📦📈
This interactive dashboard integrates with Excel files and provides real-time visual insights into your food supply chain performance. Whether you’re running a food manufacturing unit, distribution center, or restaurant supply chain, this tool helps you make faster, smarter, data-driven decisions.
💡 Key Features of Food Supply Chain KPI Dashboard in Power BI
🏠 Summary Page – Real-Time Performance Snapshot
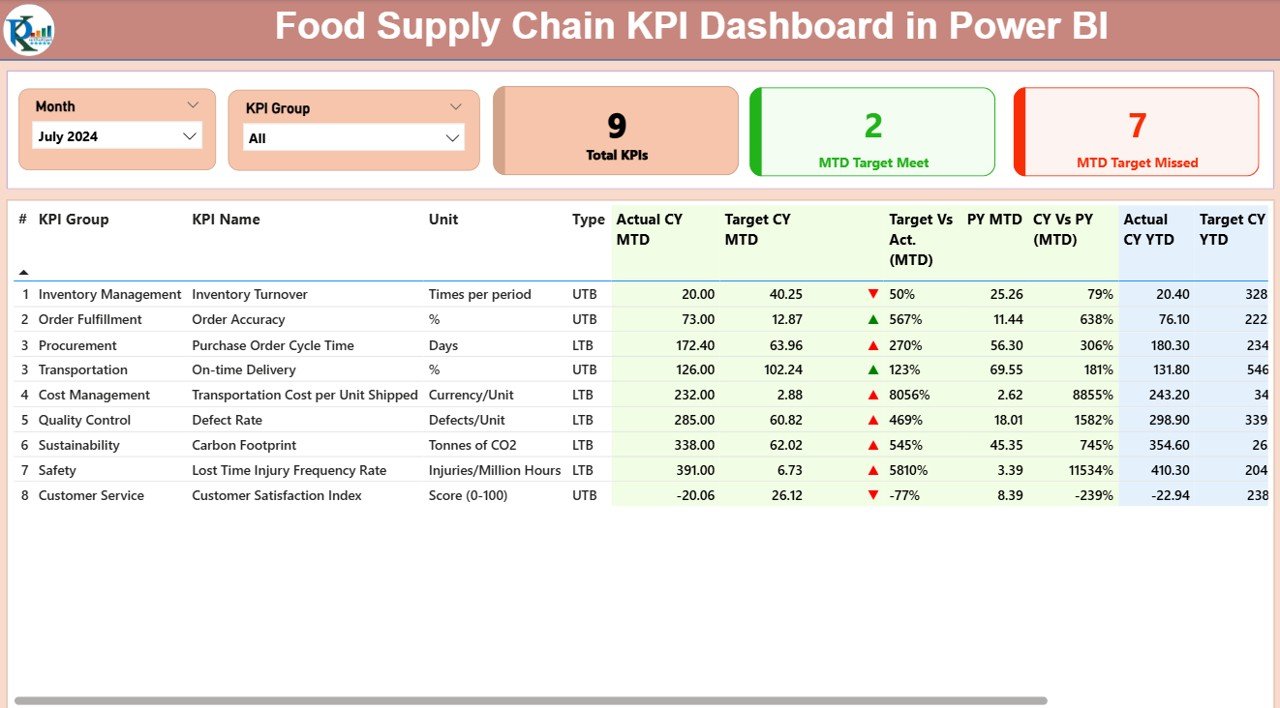
Get a bird’s-eye view of all your KPIs, including:
-
🎯 Total KPIs count
-
✅ MTD Target Met
-
❌ MTD Target Missed
Use slicers to filter by Month and KPI Group, and monitor: -
Actual vs Target (MTD & YTD)
-
Comparison vs Previous Year
-
Performance arrows (▲ or ▼) to indicate success/failure
📊 Detailed KPI Table
Monitor every KPI with fields such as:
-
KPI Number, Group, and Name
-
Unit of Measurement
-
Type: LTB (Lower the Better) or UTB (Upper the Better)
-
MTD/YTD actuals vs targets
-
Icons & % comparisons to targets and previous year
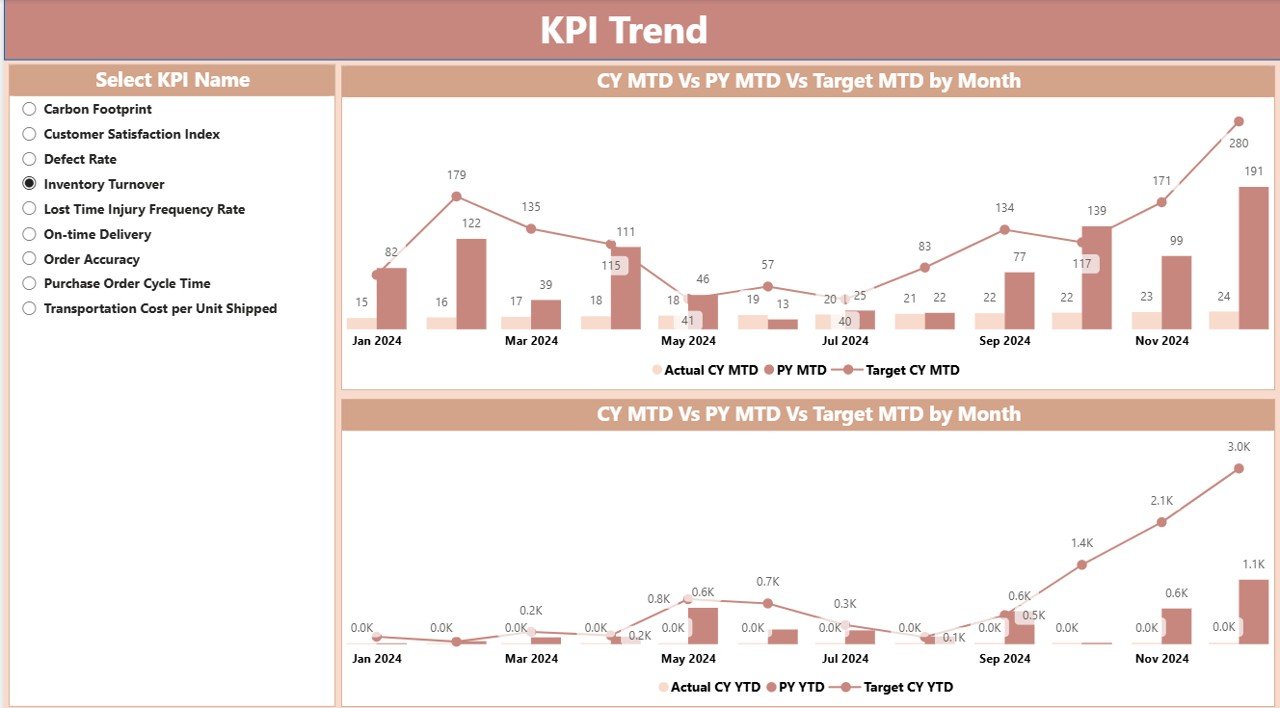
📈 KPI Trend Page – Visual Analysis Over Time
Use combo charts to track performance over time:
-
Current vs Previous Year
-
Actual vs Target
-
MTD and YTD trends
Use the KPI slicer to focus on specific metrics and spot anomalies.
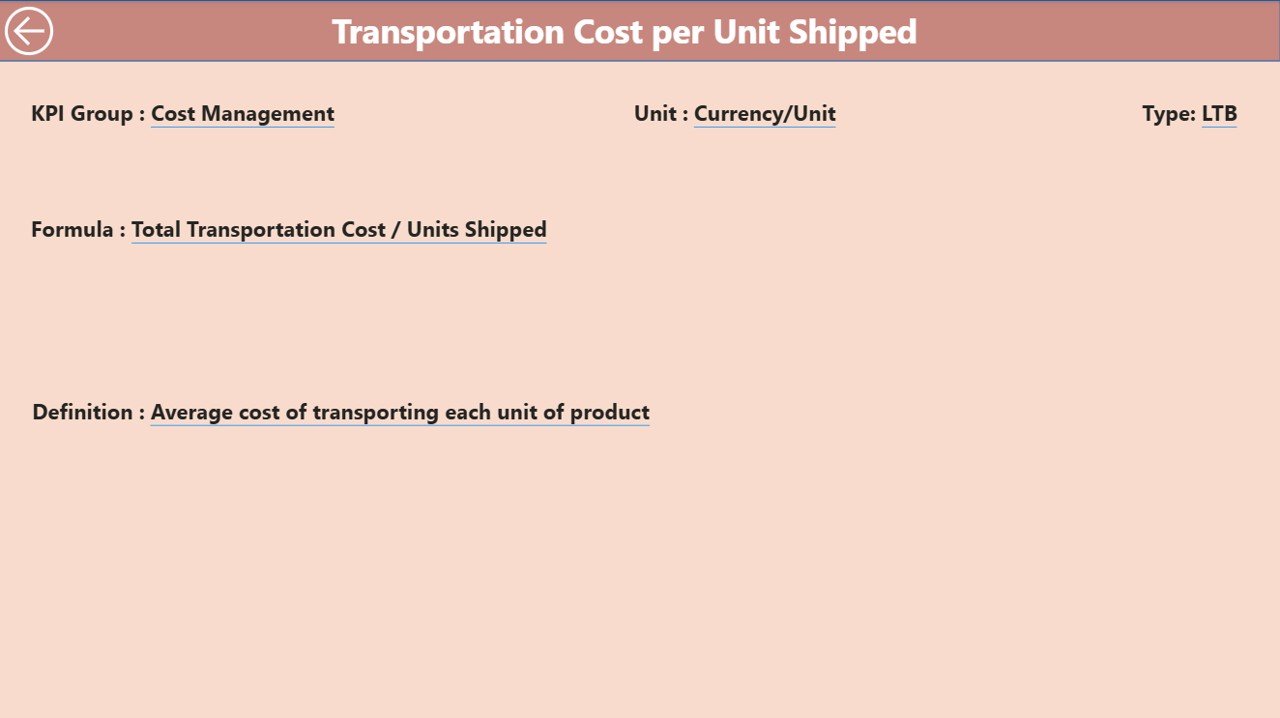
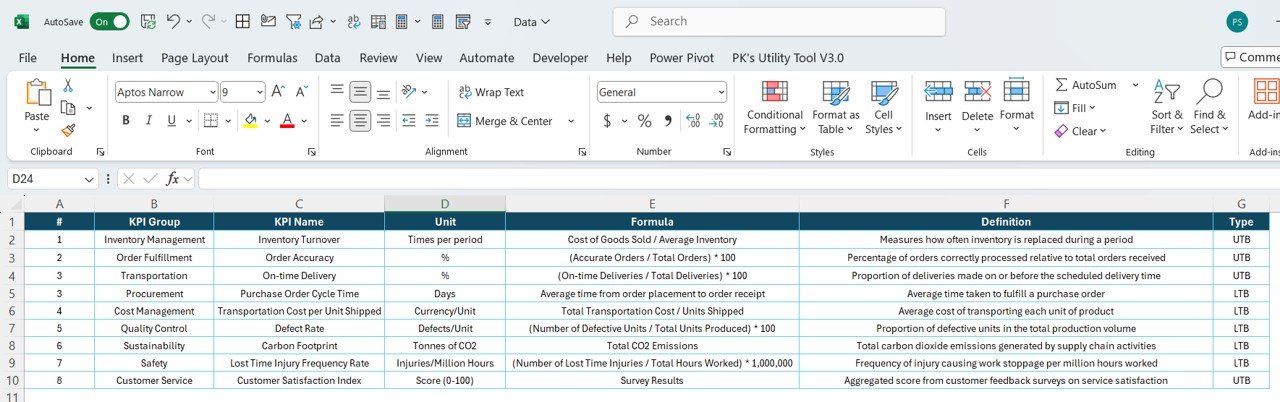
📘 KPI Definition Page – Drill-Down for Clarity
Dive deeper with:
-
KPI Formula
-
KPI Definition and Unit
Accessible via drill-through from the summary page, this gives stakeholders complete transparency into the metrics.
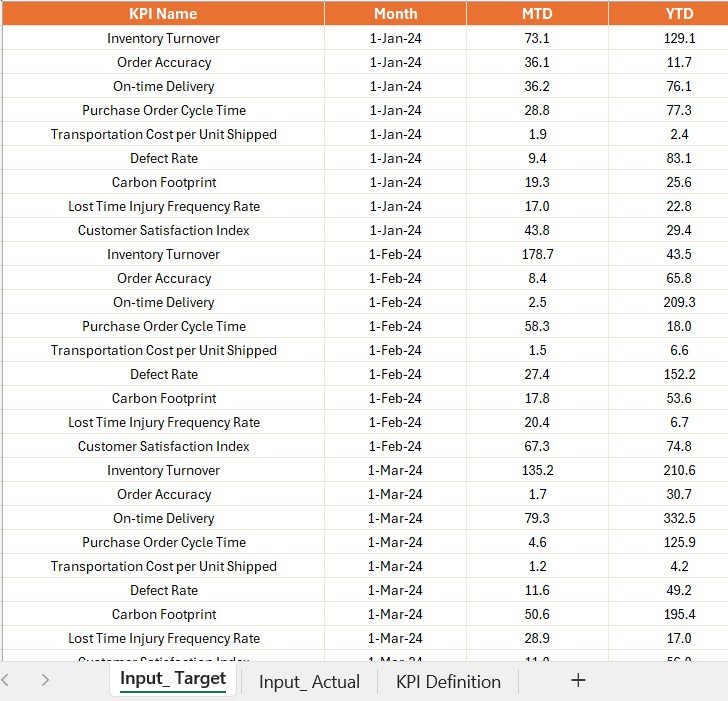
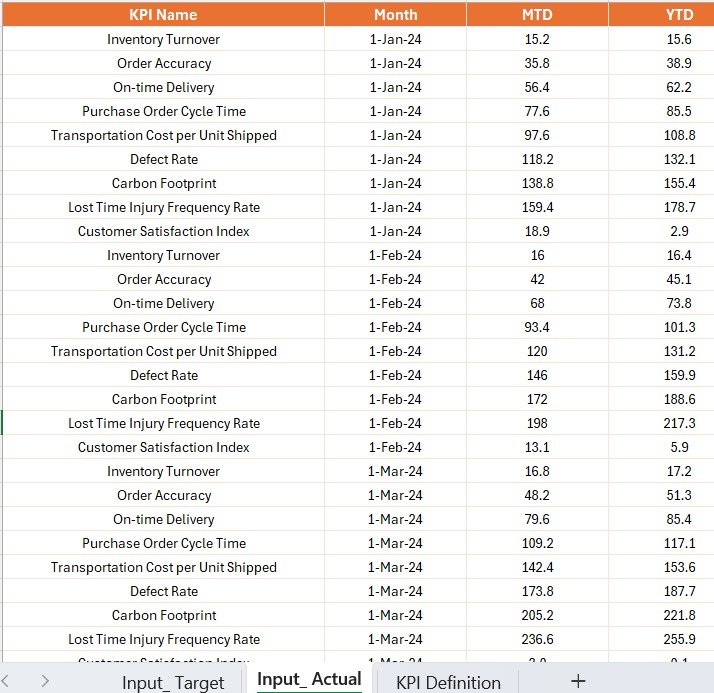
🧾 Excel-Based Data Integration
The dashboard uses three Excel sheets:
-
Input_Actual – Enter monthly actual performance data
-
Input_Target – Record monthly target values
-
KPI Definition – Define KPI names, formulas, units, and types
With these simple data inputs, the dashboard updates dynamically.
📦 What’s Inside the Dashboard?
-
✅ 3 Interactive Pages – Summary, Trend, Definition
-
📂 Excel Integration – No manual editing in Power BI
-
🎯 Performance Indicators – Arrows and % comparisons for easy analysis
-
🧭 KPI Filters & Slicers – Focus on what matters
-
📉 Trend Charts – Track progress or regression over time
-
🛠️ Customizable Metrics – Tailor KPIs to your supply chain operations
🛠️ How to Use the KPI Dashboard
-
Update the Excel Files – Input actuals and targets monthly
-
Refresh Power BI – The dashboard auto-syncs with updated visuals
-
Filter with Slicers – Choose Month, KPI Group, or Specific KPIs
-
Compare with PY – Instantly see how performance has changed year-over-year
-
Drill Through – Click on KPIs to view formulas and definitions
No Power BI experience required—if you can navigate filters and charts, you’re ready to go!
👥 Who Can Benefit from This Dashboard?
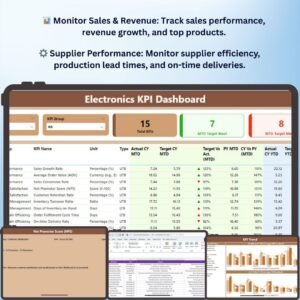
🍽️ Food Manufacturers – Track production efficiency and yield rates
🛒 Retailers & Wholesalers – Monitor inventory turnover and stock levels
🚛 Logistics Managers – Analyze delivery times, shipping accuracy, and route efficiency
📦 Warehouse Operators – Track on-time dispatch, order accuracy, and stock age
💼 Executives & Analysts – Make quick strategic decisions with real-time data
From small startups to enterprise-level supply chains—this dashboard adapts to your workflow.
🔗 Click here to read the Detailed blog post
📺 Visit our YouTube channel to learn step-by-step video tutorials


Reviews
There are no reviews yet.