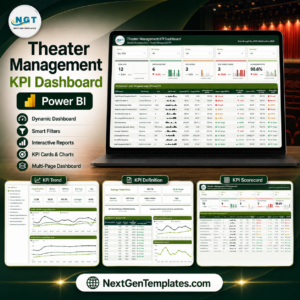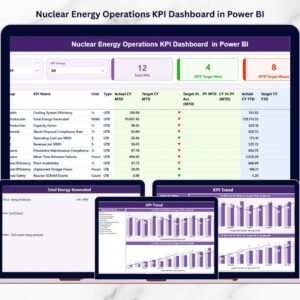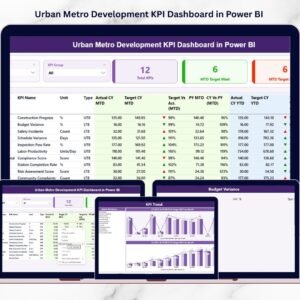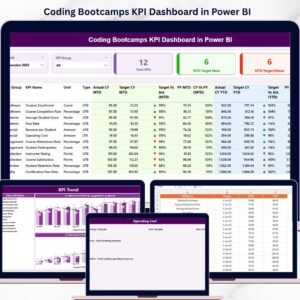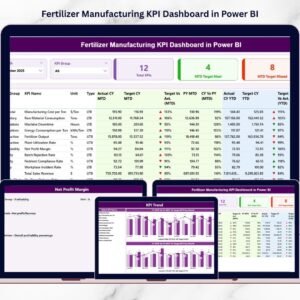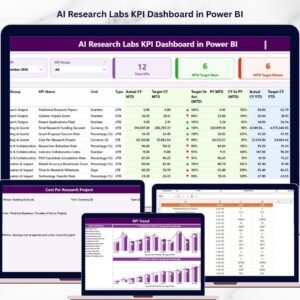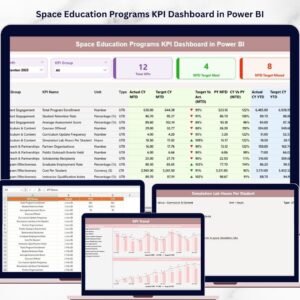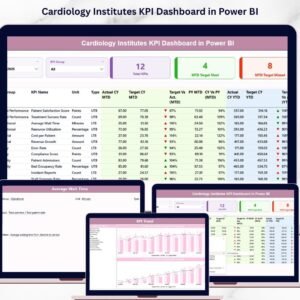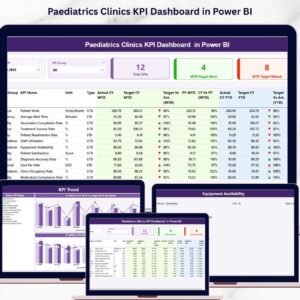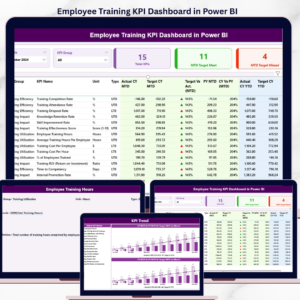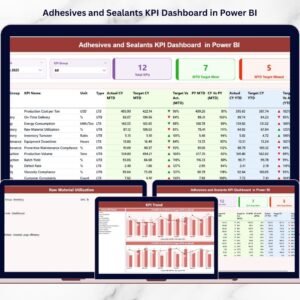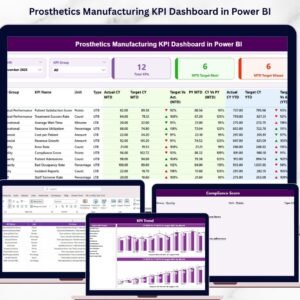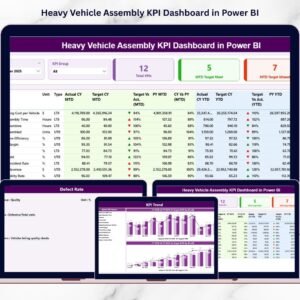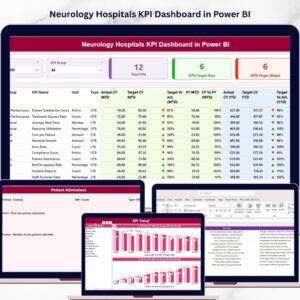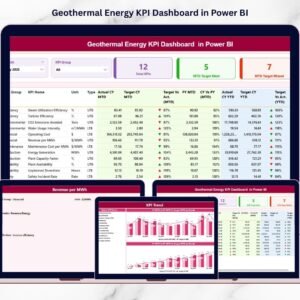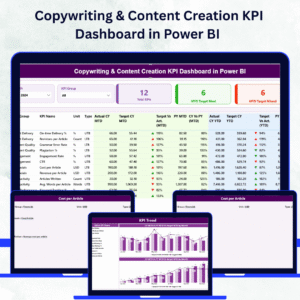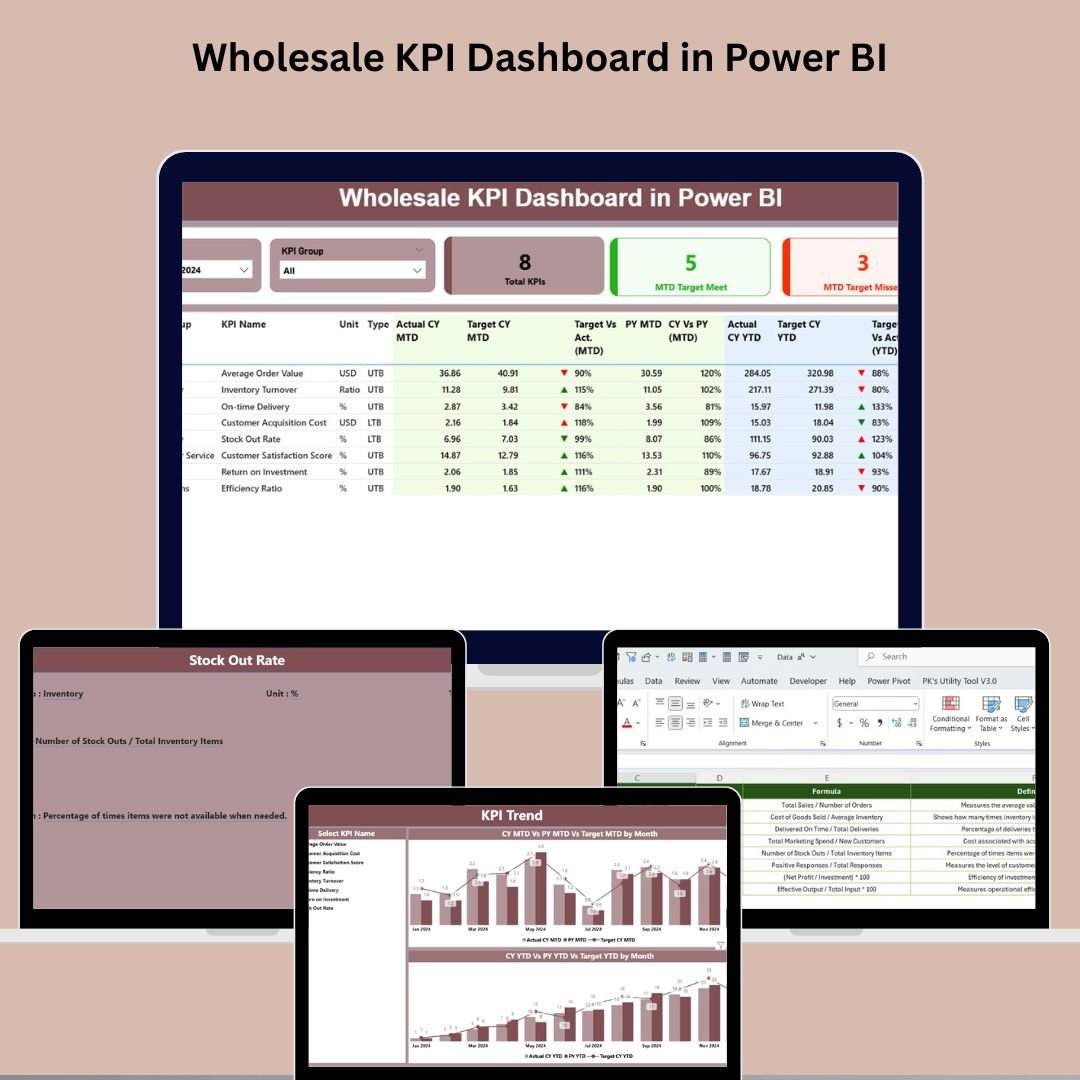
Managing KPIs in a fast-paced wholesale environment can be overwhelming—until now. Say hello to the Wholesale KPI Dashboard in Power BI, a fully interactive, Excel-integrated solution that empowers your team to visualize key metrics, monitor real-time performance, and make faster, smarter decisions—all in one place! 📊⚡
With three power-packed pages, intuitive slicers, KPI insights, and drill-through functionality, this dashboard is designed to streamline your operations and align your team on what truly matters: performance and growth.
✨ Key Features of Wholesale KPI Dashboard in Power BI
🔷 Executive Summary Page
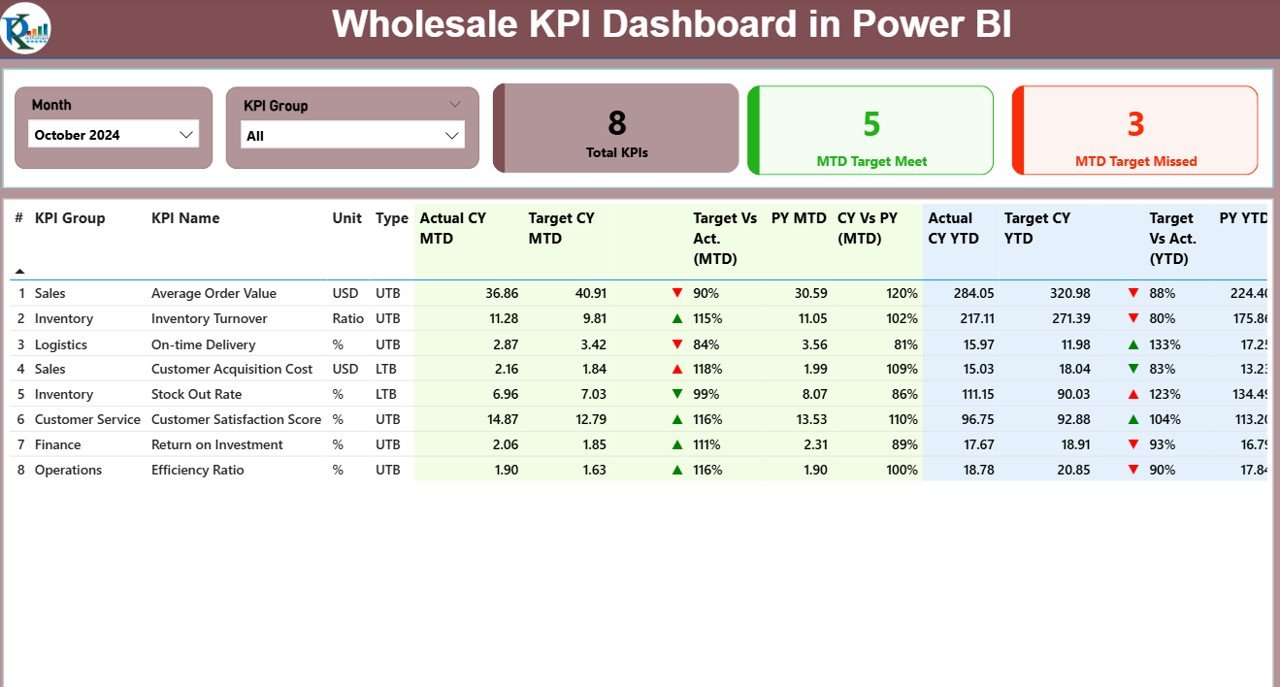
Get a bird’s-eye view of all business KPIs at once
Slice data by Month and KPI Group
Visual indicators (✅/❌, ▲/▼ icons) help you understand performance at a glance
View MTD and YTD Actuals vs Targets along with Previous Year comparisons
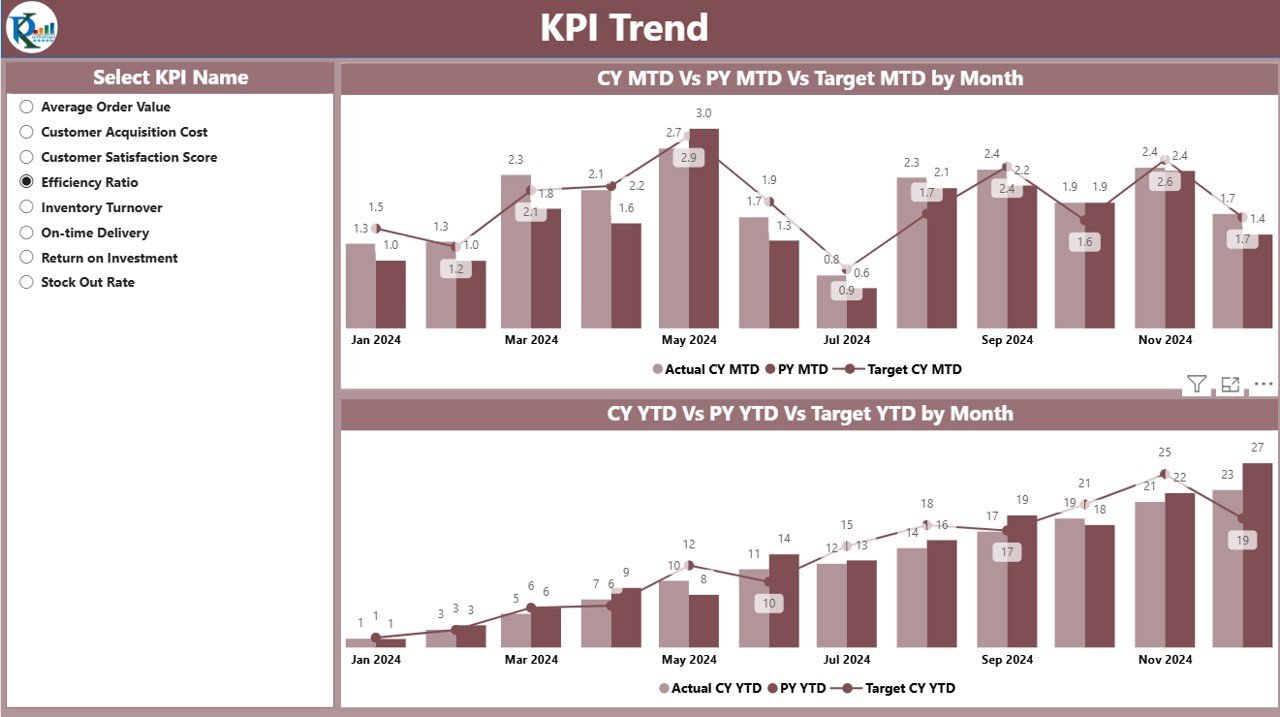
📈 KPI Trend Page
Track monthly performance trends using combo charts
Compare Actual vs Target vs Previous Year
Drill into specific KPIs to analyze fluctuations and improvements
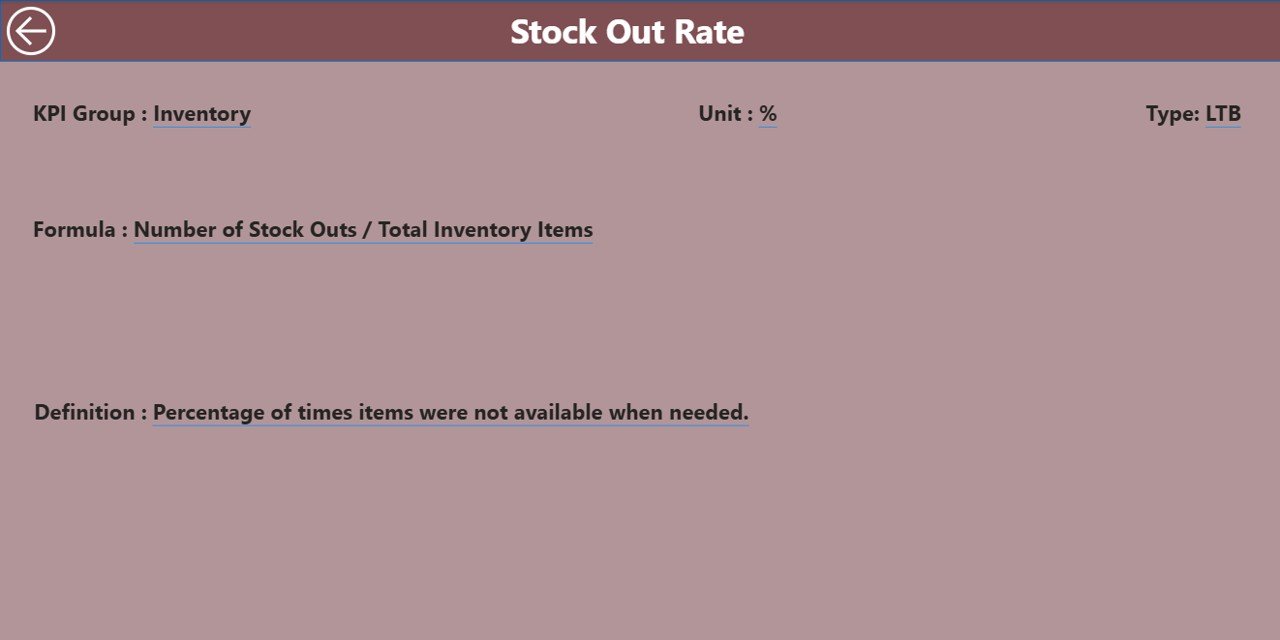
🧾 KPI Definition Drill-Through Page
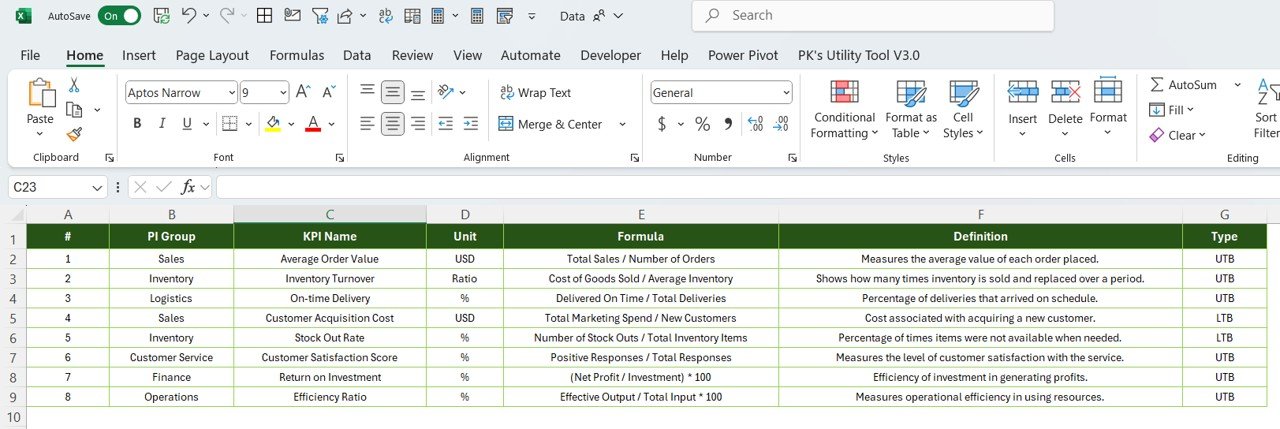
Get formula, unit, type (UTB/LTB), and KPI definitions in one click
Ensure your team understands what they’re measuring and why
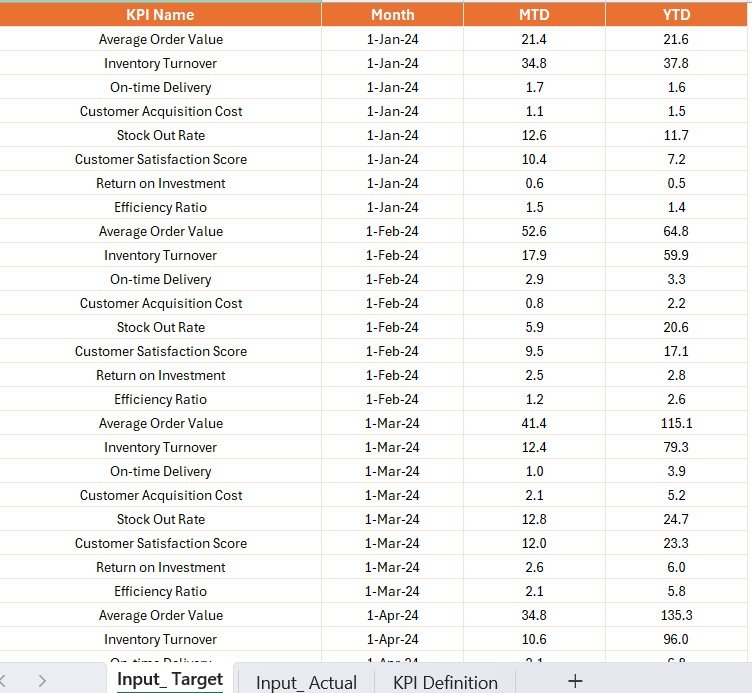
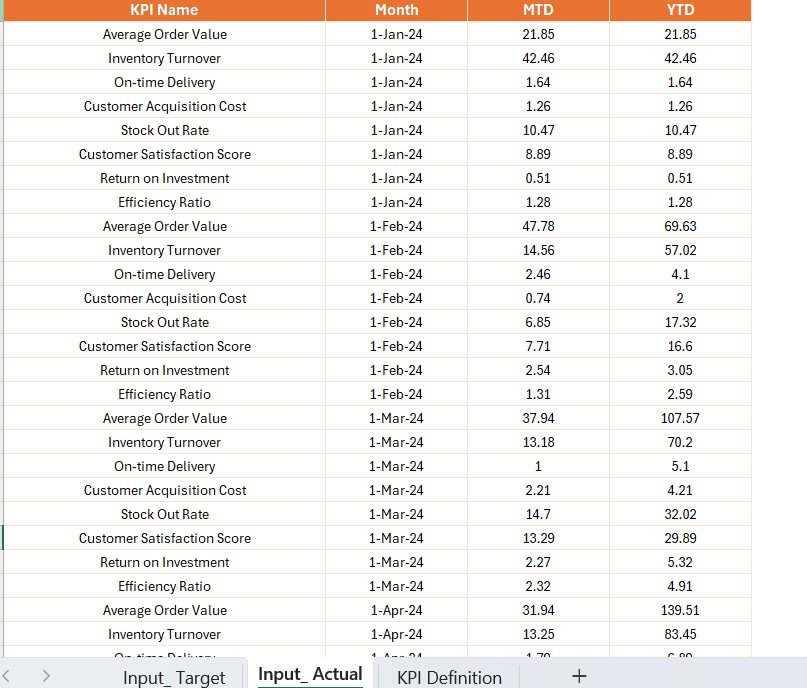
🔗 Excel Integration
Manage KPI Data in Excel: Actual, Target, and Definitions
Easy monthly updates—just refresh Power BI and go!
📦 What’s Inside the Wholesale KPI Dashboard
🧩 This dashboard includes:
✅ Prebuilt Power BI (.pbix) file
✅ Sample Excel data (Actual, Target, KPI Definitions)
✅ Three Pages: Summary, KPI Trend, and Drill-Through Definition
✅ Built-in icons and conditional formatting
✅ Slicers for Month and KPI Group
💡 Example KPIs you can track:
Inventory Turnover Rate
Order Fulfillment Time
Delivery Accuracy
Cost of Goods Sold
Profit Margin %
Sales by Category or Region
🛠️ How to Use the Wholesale KPI Dashboard
🔌 Step-by-Step Setup:
Open the Power BI dashboard file
Link your Excel data to the Power BI model
Click “Refresh” to update KPIs instantly
Use slicers to drill down by month or category
Right-click a KPI for deeper insights on the definition page
🧠 Pro Tip: Use this dashboard during monthly review meetings to keep your team aligned and performance-focused! 💼📍
👥 Who Can Benefit from This Dashboard
🎯 Sales Managers
Analyze revenue trends, product performance, and targets vs actuals.
🏬 Wholesale Operations Teams
Monitor delivery times, fulfillment rates, and supplier efficiency.
💰 Finance Professionals
Keep track of costs, margins, and profit trends over time.
📊 Executives & Business Owners
Make strategic decisions with confidence using real-time insights.
📦 SMEs & Large-Scale Wholesalers
Whether you’re running a local warehouse or a multi-location business, this dashboard will scale with you.
💡 Why Choose This Dashboard?
✅ No coding needed
✅ Fully editable in Power BI
✅ Simple Excel-based data structure
✅ Ready-to-use with real-world visuals
✅ Customizable for any business size
🔗 Click here to read the Detailed blog post
📺 Visit our YouTube channel to learn step-by-step video tutorials