

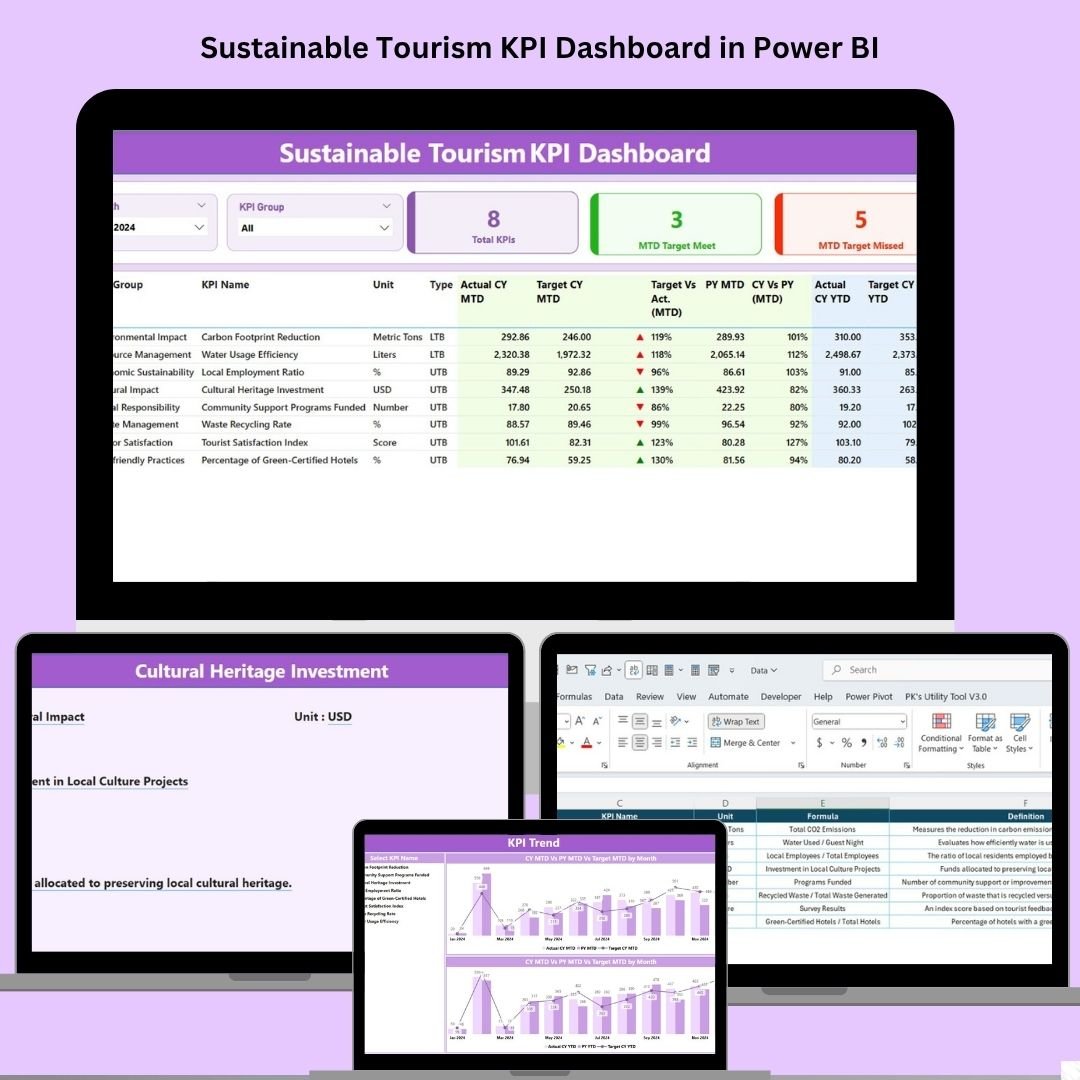
Tourism can be both a force for good and a source of strain—especially when sustainability isn’t measured and managed. That’s why we created the Sustainable Tourism KPI Dashboard in Power BI — a ready-to-use, visually dynamic tool that helps tourism professionals track, analyze, and improve their environmental, economic, and social impact in real time.
Whether you’re part of a national tourism board, a regional travel agency, or an eco-resort team, this dashboard empowers you to make data-driven decisions that align with sustainability goals.
🧭 Key Features of the Dashboard
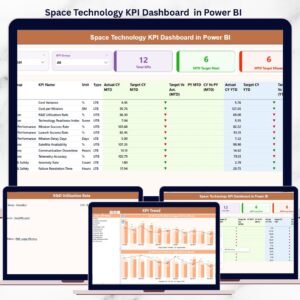
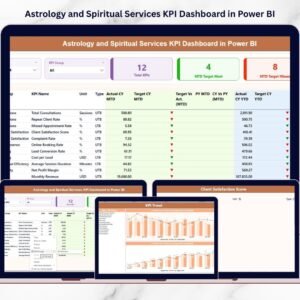
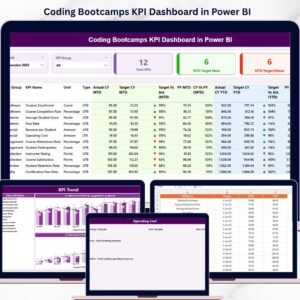
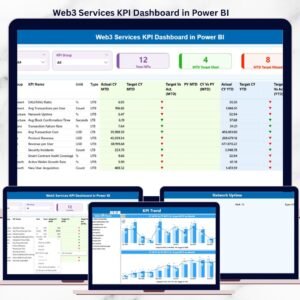
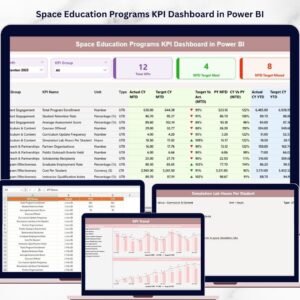
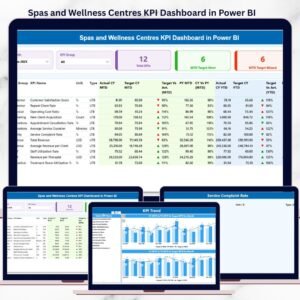
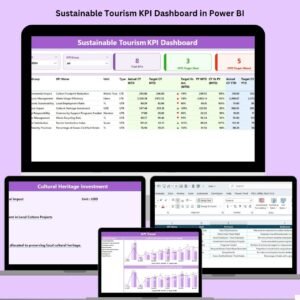
📊 Summary Page
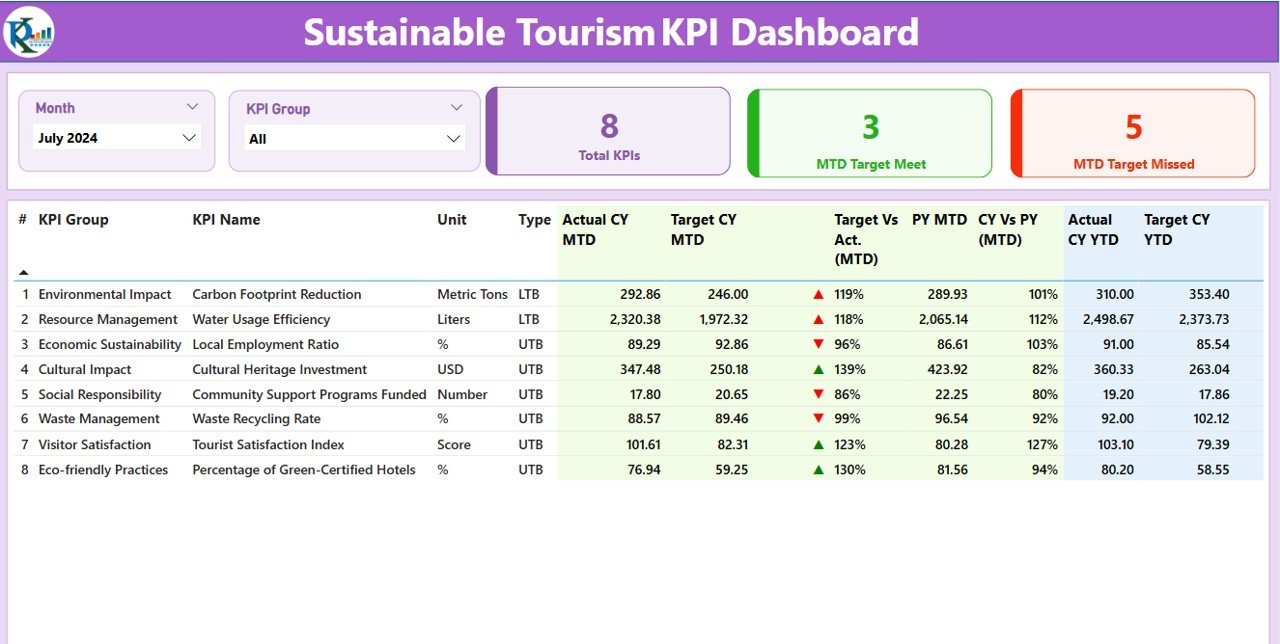
MTD and YTD performance overview
Slicers for Month and KPI Group
Cards showing total KPIs, Target Met, and Missed
Table with actual vs target comparisons, status icons, and PY benchmarks
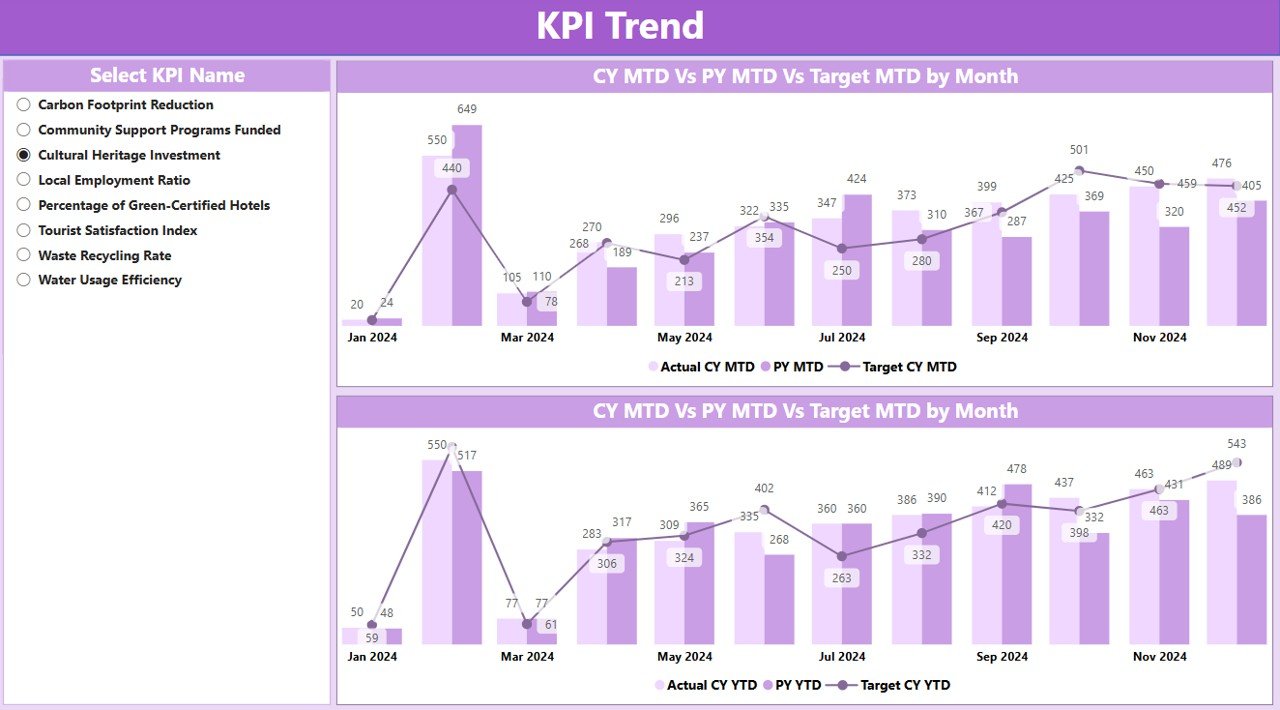
📈 KPI Trend Page
Interactive slicer for KPI selection
Line and combo charts to compare Current Year vs Previous Year
Targets displayed for both MTD and YTD
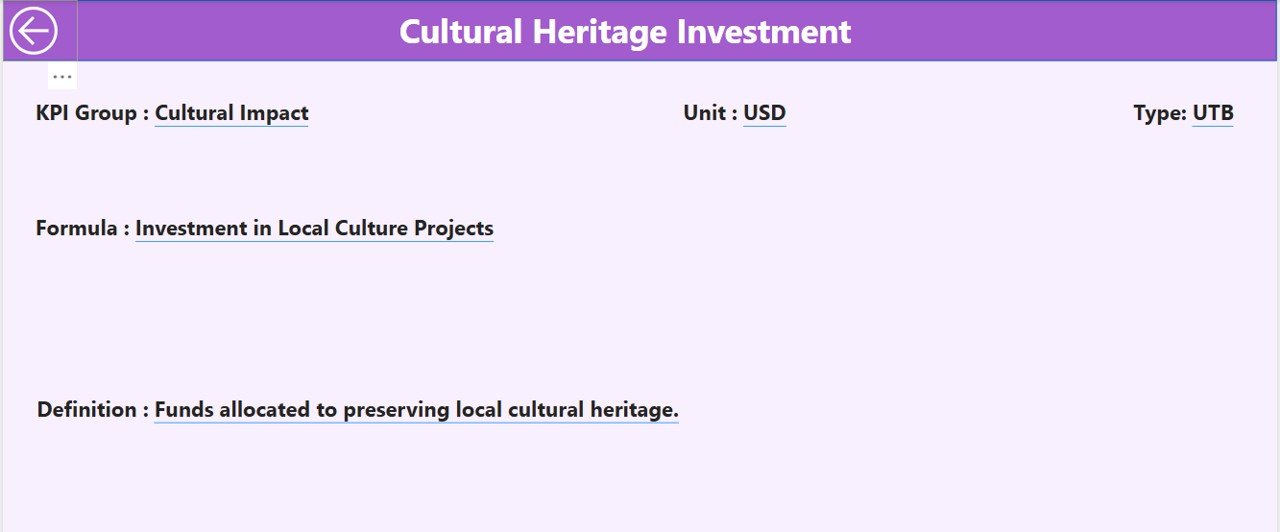
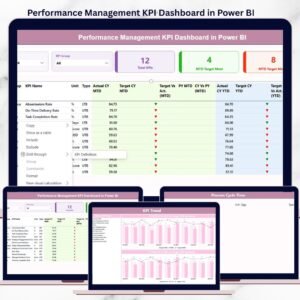
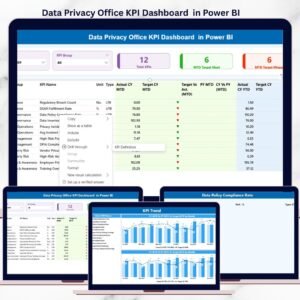
📘 KPI Definition Page (Drill-Through)
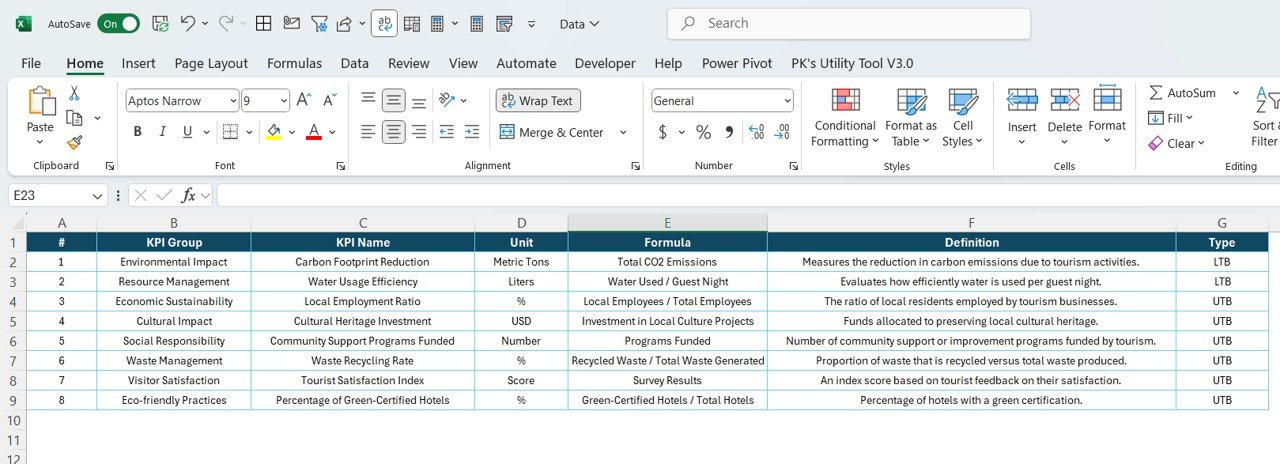
View KPI formulas, unit, and type (UTB or LTB)
Jump into definitions directly from summary view
📂 Data Source & Structure
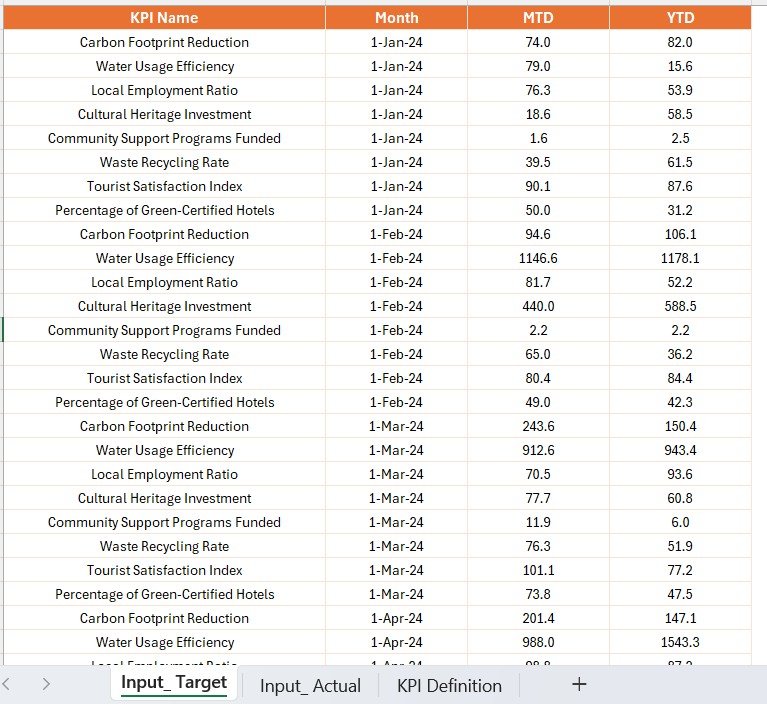
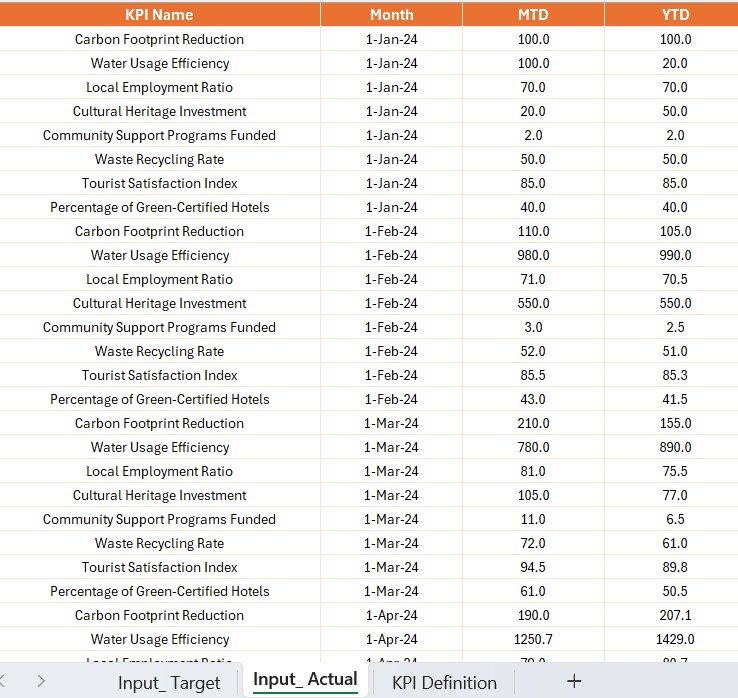
Connects directly to an Excel file structured with three sheets:
Input_Actual – Actual MTD & YTD numbers
Input_Target – Monthly and yearly targets
KPI Definition – Name, Group, Unit, Type, and Formula
This separation ensures accuracy, scalability, and ease of maintenance.
🌟 Advantages of Using This Dashboard
🔢 Real-Time Monitoring – Instantly track sustainability KPIs
📊 Informed Decisions – Visualize what’s working and what needs attention
♻️ Sustainability Focused – Measure eco-impact, community benefit, and efficiency
📤 Stakeholder-Ready – Easy to present to governments, NGOs, and travel boards
🌎 Benchmarking Power – Compare performance with past years or regions
🛠️ Best Practices for Maximum Impact
Choose Meaningful KPIs – Align with UNWTO sustainability pillars
Update Monthly – Keep your data fresh for reliable insights
Use Conditional Formatting – Let arrows and color cues do the talking
Drill into Insights – Leverage drill-through to explore KPI definitions
Segment Smartly – View trends by region, season, or tourism type
🎯 Use Cases
🏞️ National Parks – Track conservation, waste management, and visitor education
🏖️ Beach Cities – Monitor water quality, waste, and crowd control
🏙️ Urban Tourism – Assess traffic impact, local job creation, and energy use
🎭 Cultural Heritage – Measure preservation efforts and tourism revenue













Reviews
There are no reviews yet.