


Running a successful online marketplace means juggling multiple vendors, tracking dozens of metrics, and making fast decisions. That’s exactly why you need the Online Marketplaces KPI Dashboard in Power BI—a dynamic and fully interactive dashboard designed to help eCommerce and marketplace managers stay in control.
This Power BI dashboard connects seamlessly with Excel data sources to provide real-time insights into your most critical KPIs. Whether you’re monitoring sales performance, fulfillment timelines, or customer satisfaction, this tool simplifies everything into an intuitive, visual format.
✨ Key Features of Online Marketplaces KPI Dashboard
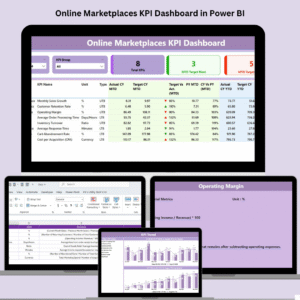
📍 Summary Page – One View for Everything

Month and KPI Group Slicers for flexible filtering
Summary cards showing:
✔ Total KPIs
✔ MTD Target Met
✔ MTD Target MissedDetailed KPI Table displaying:
🔹 KPI Name, Group, Unit, Type (LTB or UTB)
🔹 MTD & YTD actuals and targets
🔹 Target vs Actual %
🔹 Year-over-year performance (CY vs PY)
🔹 Performance Icons (Green ▲ or Red ▼)
📈 KPI Trend Page – Visualize the Journey
Combo charts for MTD and YTD trends
Slicer to select and drill into individual KPIs
Ideal for identifying patterns and performance shifts over time
📘 KPI Definition Page – Your Metadata Hub
Right-click on any KPI to drill through
See definitions, formulas, and units
Easy navigation with a back button to return to Summary
📂 What’s Inside the Dashboard Template
🟢 3 Power BI Pages
Summary Page – Overview of all KPIs with metrics and icons
KPI Trend Page – Performance visualization with filters
KPI Definition Page – Behind-the-scenes info for each KPI
🟢 Connected Excel Data Sources
Input_Actual Sheet – MTD/YTD values
Input_Target Sheet – MTD/YTD target goals
KPI Definition Sheet – KPI metadata (Name, Unit, Formula, Type)
🟢 Automated Measures & DAX Calculations
Target vs Actual %
CY vs PY %
MTD and YTD performance comparisons
Icon-based conditional formatting
🛠️ How to Use the Online Marketplaces KPI Dashboard
👉 Step 1: Connect Your Excel Sheets
Use Power BI to load the Actual, Target, and Definition sheets.
👉 Step 2: Clean & Transform Data
Use Power Query to ensure date formats and relationships are clean.
👉 Step 3: Build Relationships
Link KPI Name across all sheets for a seamless data model.
👉 Step 4: Review Summary Page
Use slicers to filter by month and KPI group. Icons and % metrics update instantly.
👉 Step 5: Use Trend Page for Analysis
See how KPIs are progressing month-by-month with combo charts.
👉 Step 6: Drill into KPI Details
Right-click on any KPI row to view its formula, definition, and more.
👥 Who Can Benefit from This Dashboard?
🛍️ Marketplace Managers – Stay updated on key metrics in real-time
📦 Operations Leads – Monitor fulfillment, logistics, and resolution times
📈 Business Analysts – Discover data-driven trends and opportunities
💻 E-commerce Teams – Optimize sales, conversion, and AOV metrics
📢 Customer Service Leaders – Track complaints, return rates, CSAT
No matter your role, this dashboard helps you make smarter, faster, and more confident decisions.
🔧 Customize the Dashboard for Your Marketplace
⚙️ Add or remove KPIs based on business goals
🎨 Apply custom branding and color schemes
🔁 Connect to SQL, SharePoint, or other data sources
📱 Publish to Power BI Service and view on mobile
📅 Automate data refreshes for always-current insights














Reviews
There are no reviews yet.