


In a world driven by data, staying on top of performance metrics is critical. The Data Analytics KPI Dashboard in Power BI empowers analysts, managers, and decision-makers to monitor KPIs in real-time, discover trends, and act on insights—all from one dynamic, interactive platform.
This ready-to-use Power BI dashboard is designed to track Month-to-Date (MTD) and Year-to-Date (YTD) performance, compare actuals with targets, and evaluate results against previous year benchmarks. Whether you’re measuring financial performance, customer satisfaction, operations, or sales, this dashboard helps you simplify complexity and accelerate decision-making.
✨ Key Features of the Data Analytics KPI Dashboard in Power BI
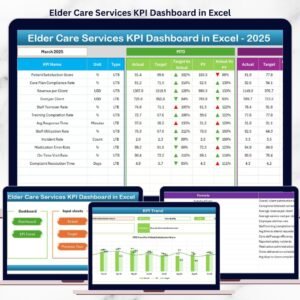
🔹 1. Summary Page – Your High-Level Performance Snapshot

This is the primary dashboard interface that includes:
-
KPI Group and Month Slicers for filtering the data
-
Metric Cards showing:
-
Total KPI Count
-
MTD Target Met
-
MTD Target Missed
-
-
Detailed KPI Table featuring:
-
KPI Number, Group, and Name
-
Unit of Measurement
-
Type (LTB – Lower the Better / UTB – Upper the Better)
-
Actual CY MTD, Target CY MTD, % Target vs Actual
-
PY MTD, % CY vs PY
-
Actual CY YTD, Target CY YTD, % Target vs Actual
-
PY YTD, % CY vs PY
-
The icons (▲▼) and conditional formatting instantly show KPI health.
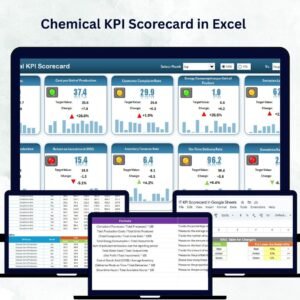
🔹 2. KPI Trend Page – Visualize Performance Over Time
This page allows deeper analysis of selected KPIs:
-
📈 Combo Charts to show:
-
Actual vs Target vs Previous Year for both MTD & YTD
-
-
🎯 KPI Slicer to isolate and analyze a specific KPI
-
Easily spot seasonality, fluctuations, or anomalies
🔹 3. KPI Definition Page – Understand the Metrics You’re Tracking
This hidden, drill-through page contains:
-
📘 KPI Formula
-
🧮 Calculation Logic
-
📋 KPI Type, Unit, and Definition
Just right-click a KPI on the Summary Page and drill down to see its details—no more second-guessing metric logic.
🔄 Excel Data Structure for Seamless Integration
This dashboard connects to an Excel file with 3 key sheets:
-
Input_Actual Sheet – Record actual MTD and YTD values by month and KPI
-
Input_Target Sheet – Enter monthly target values for each KPI
-
KPI Definition Sheet – Define KPI Number, Name, Group, Unit, Formula, and Type
No need for database connections—just update the Excel and refresh Power BI.
🎯 Advantages of Using the Data Analytics KPI Dashboard
✅ Real-Time Monitoring
Get up-to-date performance metrics with dynamic visuals and fast filters.
✅ Visual Insights at a Glance
Leverage combo charts, KPI cards, and conditional formatting to interpret complex data in seconds.
✅ Data Centralization
Pull KPIs from Excel, cloud services, or databases into one streamlined dashboard.
✅ Easy Drill-Down
Click into any KPI to explore underlying data, trends, and definitions.
✅ 100% Customizable
Modify KPI names, add new metrics, or adjust formulas to match your unique goals.
📌 Best Practices for Using This Power BI Dashboard
-
Define Clear KPIs: Ensure each KPI supports your strategic objectives.
-
Clean Your Data: Maintain accuracy with regularly validated inputs.
-
Limit Clutter: Focus on essential KPIs to keep the dashboard readable.
-
Visualize Wisely: Choose charts that communicate your message clearly.
-
Set Thresholds: Add conditional formatting to highlight under/over-performance.
👨💼 Who Should Use This Dashboard?
This tool is ideal for:
-
Business Analysts
-
Operations Managers
-
Finance and Sales Teams
-
Executives and Directors
-
Startups and Enterprises tracking performance metrics
Visit our YouTube channel to learn step-by-step video tutorials
🔗 Click here to read the Detailed blog post


Reviews
There are no reviews yet.