


In a digital-first workplace, managing documents efficiently isn’t just admin—it’s mission-critical. That’s why we created the Document Management KPI Dashboard in Power BI—a powerful, plug-and-play reporting solution designed to help organizations track key metrics, improve compliance, and streamline document workflows in real time.
Built with precision, this dashboard pulls data from a simple Excel file and transforms it into interactive visuals, real-time performance indicators, and trend insights that empower decision-makers at every level.
💡 Key Features of Document Management KPI Dashboard
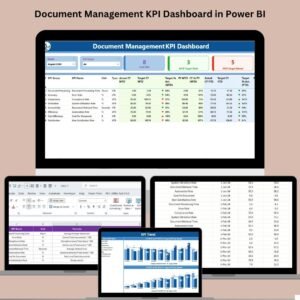
✅ 1. Summary Page – Instant Performance Snapshot

The Summary Page acts as your control center.
-
🎯 Filter by Month or KPI Group to focus on specific segments
-
📌 KPI Cards show:
-
Total KPIs being tracked
-
Count of MTD Targets Met and Missed
-
-
📊 Interactive Table displays:
-
KPI Name, Group, Unit, and Type (UTB/LTB)
-
MTD/YTD performance with conditional icons (▲ for met, ▼ for missed)
-
Year-over-year comparisons
-
📈 2. KPI Trend Page – Track Progress Over Time
Dive into MTD and YTD combo charts to:
-
Compare current vs target vs previous year
-
Spot trends and performance gaps
-
Analyze each KPI in detail using slicers
📋 3. KPI Definition Page – Drill into KPI Logic
Each KPI includes:
-
📐 Definition
-
🧮 Formula
-
📍 Type classification (UTB/LTB)
Just click on any KPI in the Summary Page to drill through and see the logic.
📂 What’s Inside the Dashboard?
This Power BI dashboard runs on a structured Excel file with three intelligent worksheets:
📄 1. Input_Actual Sheet
Track actual MTD and YTD values for each KPI by month.
📄 2. Input_Target Sheet
Enter monthly and yearly target values for every KPI.
📄 3. KPI_Definition Sheet
Store all definitions, formulas, and metadata related to each KPI.
These sheets make updates simple for non-technical users—no coding, no Power BI expertise required.
🚀 How to Use the Document Management KPI Dashboard
-
Download the Power BI file and the Excel source workbook.
-
Update your actuals and targets monthly in Excel.
-
Load the Excel file into Power BI and refresh the dashboard.
-
Use the filters, slicers, and trend charts to monitor progress and identify gaps.
-
Drill through to understand KPI logic or troubleshoot outliers.
👥 Who Can Benefit from This Dashboard?
🔐 Compliance Officers – Monitor document adherence and audit readiness
⚙️ Operations Managers – Track delays and processing efficiency
💾 IT Departments – Evaluate system response and storage usage
📊 Executives – View high-level KPI cards and trend visuals in reviews
🔧 Customize It for Your Organization
Want to make it yours? You can:
-
Add more KPI groups like Legal, Archiving, or Compliance
-
Change units (Hours, Days, Percentage, Count)
-
Connect to SharePoint or OneDrive for live refresh
-
Embed additional visuals for department-level reporting
✅ Why You Need This Dashboard
📊 Live Performance Tracking – See where your process stands, instantly
📉 Error Reduction – Eliminate manual reporting with Excel-based inputs
📈 Year-Over-Year Analysis – Track performance across months and years
🔍 Drill-Down Capability – Go deeper into any KPI with just one click
💼 Executive Ready – Present clean visuals in reviews and meetings
📘 Best Practices for Success
🗓️ Update your Excel data monthly
📌 Keep KPI formulas consistent over time
👥 Train your team to interpret UTB and LTB metrics
📂 Keep archived versions for each month
🔁 Use Power BI Service to schedule automatic refreshes
🔗 Click here to read the Detailed blog post
▶️ Visit our YouTube channel to learn step-by-step video tutorials

















Reviews
There are no reviews yet.