


📦 Monitor Food Packaging Performance with Precision Using This KPI Dashboard in Power BI 📊🔥
Struggling to track the performance of your food packaging operations? The Food Packaging KPI Dashboard in Power BI is a game-changing solution designed to give you real-time insights, actionable metrics, and full visibility into every packaging performance indicator—all powered by clean data from a simple Excel sheet.
Whether you’re a packaging manager, quality control lead, or operations executive, this plug-and-play Power BI dashboard gives you everything you need to analyze performance, meet targets, and optimize productivity in your food packaging line.
✨ Key Features of Food Packaging KPI Dashboard in Power BI
🧭 Three Powerful Pages
This dashboard comes with 3 core pages to cover all your tracking needs:
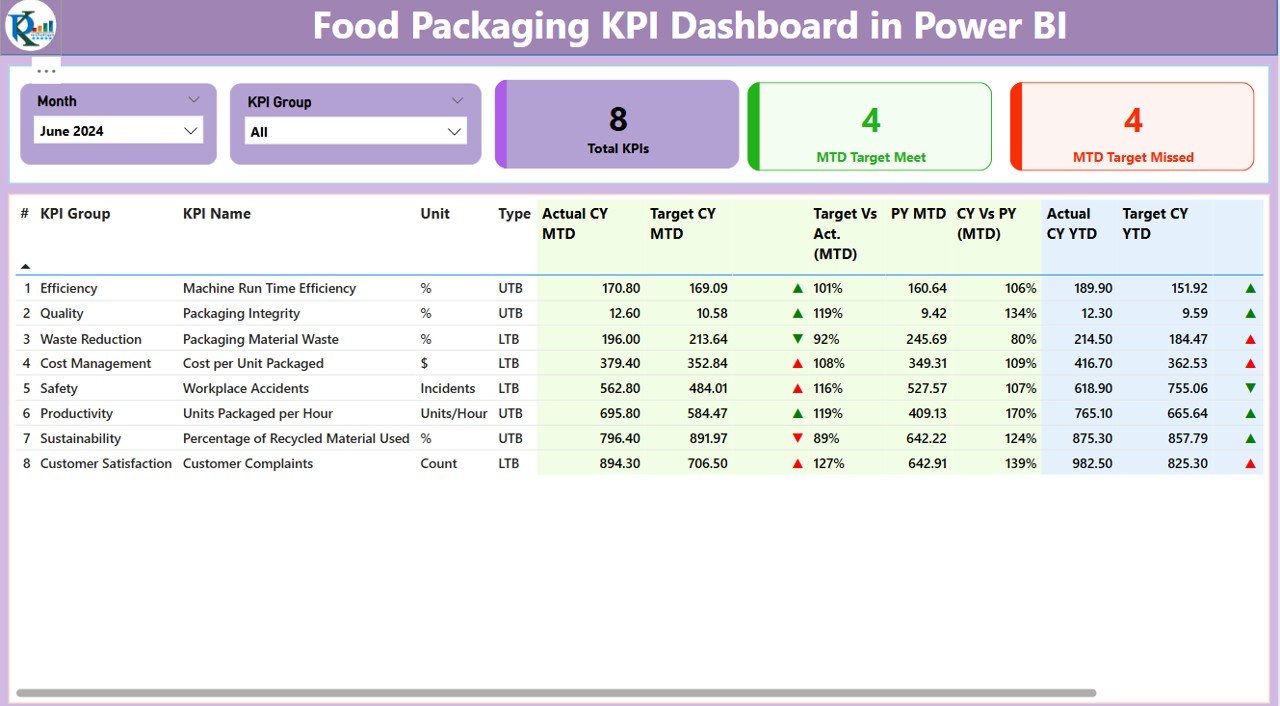
1️⃣ Summary Page – View overall KPI status with slicers, indicators, and percentage comparisons
2️⃣ KPI Trend Page – Visualize trends with combo charts (Actual, Target, Previous Year)
3️⃣ KPI Definition Page – Drill-through page to access formulas and definitions for each KPI
🔍 Interactive Slicers
Filter by Month and KPI Group on the Summary Page for targeted insights.
📈 Live KPI Cards
Monitor 3 summary cards:
-
Total KPIs
-
MTD Target Met
-
MTD Target Missed
📋 Detailed KPI Table
Key metrics shown include:
-
Actual vs Target (MTD & YTD)
-
MTD & YTD Icons (green/red arrows)
-
% Difference from Target and Previous Year
-
KPI Unit, Group, and Type (UTB or LTB)
📊 Trend Visualization
Use the KPI Trend Page to compare Actual, Target, and Previous Year values in a combo chart format for MTD and YTD values.
🔁 Drill-Through KPI Definition
Click on a KPI from the summary and instantly drill through to the hidden KPI Definition page to view formula and explanation.
📂 What’s Inside the Dashboard?
The dashboard is powered by three Excel-based input sheets that feed real-time data into Power BI:
1️⃣ Input_Actual Sheet
Enter actual KPI performance data for MTD and YTD, linked by KPI Name and Month (use the first day of the month format).
2️⃣ Input_Target Sheet
Set monthly MTD and YTD performance goals to evaluate against actual numbers.
3️⃣ KPI Definition Sheet
Define each KPI clearly with:
-
KPI Number
-
KPI Group
-
KPI Name
-
Unit of Measurement
-
Formula
-
Short Definition
-
Type (LTB or UTB)
🛠️ How to Use the Food Packaging KPI Dashboard
-
📥 Download the Excel + PBIX file
-
🧾 Fill in Actual and Target data in the respective Excel sheets
-
🔄 Refresh the Power BI report to pull the latest data
-
🔍 Filter by Month or KPI Group using slicers
-
📉 View trends in the KPI Trend Page
-
ℹ️ Drill through to see KPI formulas and definitions
-
📈 Analyze real-time results and take informed action
You’ll instantly see which KPIs are meeting targets and where action is needed!
👥 Who Can Benefit from This Dashboard?
-
🏭 Packaging Managers – Track daily performance and identify issues
-
📦 Production Teams – Stay aligned with output goals
-
🧪 Quality Assurance – Ensure KPIs meet safety and compliance standards
-
💼 Operations Leaders – Monitor trends and drive continuous improvement
-
📊 Analysts & Planners – Generate performance reports quickly
🔗 Click here to read the Detailed blog post
🔗 Visit our YouTube channel to learn step-by-step video tutorials


Reviews
There are no reviews yet.