



In the age of digital branding, your employees are not just team members — they are your most authentic brand ambassadors 💪. The Employee Advocacy KPI Dashboard in Power BI transforms this potential into measurable, data-driven success. Designed for HR, Marketing, and Communications teams, this dashboard empowers organizations to track, analyze, and amplify employee-driven brand engagement with ease.Employee Advocacy KPI Dashboard in Power BI
With real-time visualizations, interactive filters, and smart performance tracking, this ready-to-use Power BI template provides everything you need to measure advocacy, engagement, and reach — all from a single dashboard.
⚙️ Key Features of Employee Advocacy KPI Dashboard in Power BI
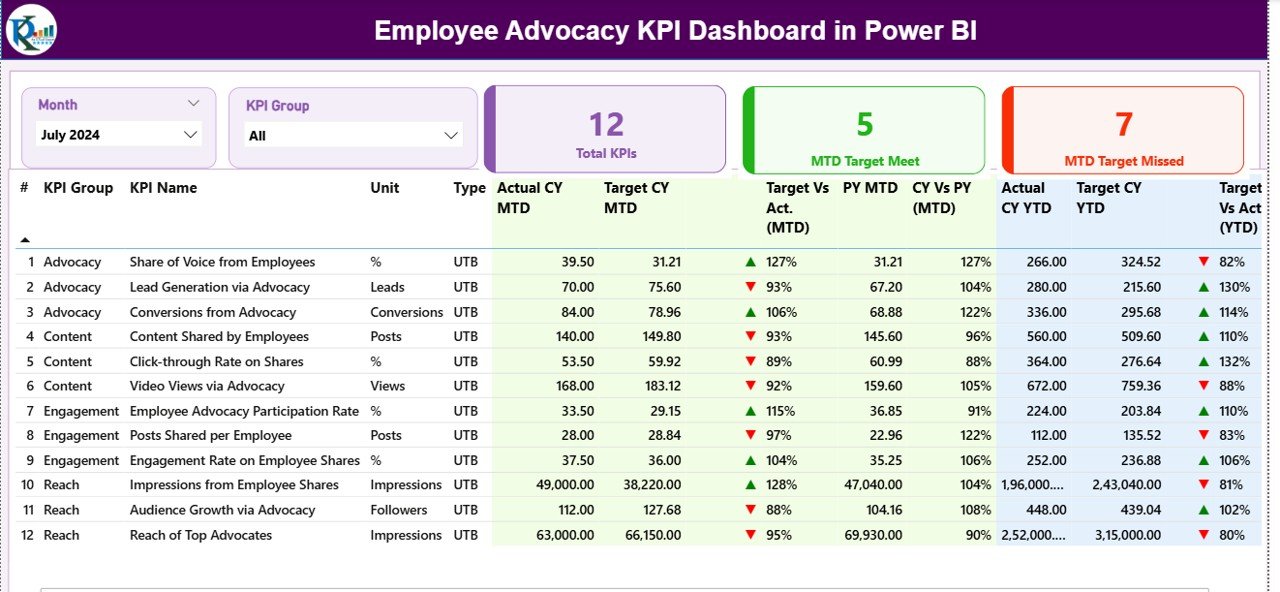
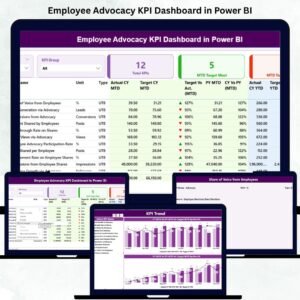
✨ All-in-One Performance View: Track all advocacy metrics including Total Posts, Engagements, Reach, and Top Advocates from one intuitive summary page.
📊 Dynamic KPI Analysis: Compare MTD vs YTD performance, visualize trends, and spot underperforming areas with interactive charts and conditional formatting arrows.
🎯 Actual vs Target Insights: Evaluate progress against defined goals and analyze variance with clear visual indicators.
⚡ Automated Data Refresh: Eliminate manual work — Power BI automatically updates your reports using live connections or scheduled refreshes.
💡 Customizable Layout: Add or modify KPIs, pages, and filters to suit your organization’s unique advocacy strategy.
🧠 Data Transparency: View KPI definitions, formulas, and calculation logic directly from the dashboard for clarity and accuracy.
📱 Multi-Device Access: Monitor advocacy data anytime, anywhere — from desktops, tablets, or smartphones.
🏆 Top Advocates Recognition: Identify and reward employees contributing most to brand awareness.
📦 What’s Inside the Employee Advocacy KPI Dashboard in Power BI
This professional Power BI template includes 7 powerful pages, each crafted for decision-making clarity:
1️⃣ Summary Page – A central hub showing overall performance metrics and navigation buttons.
2️⃣ KPI Trend Page – Interactive analysis of KPIs by month, department, or region.
3️⃣ KPI Definition Page – Displays KPI group, formula, definition, and MTD/YTD trends.
4️⃣ Input_Actual Sheet – Stores monthly actual KPI data.
5️⃣ Input_Target Sheet – Holds benchmark target values for comparison.
6️⃣ KPI Definition Sheet – Contains metadata for accurate calculations.
7️⃣ Dashboard Navigation System – Allows one-click access between analytical pages.
Each element is designed for simplicity, accuracy, and real-time decision-making — enabling managers to focus on strategy, not spreadsheets.
🧭 How to Use the Employee Advocacy KPI Dashboard in Power BI
🚀 Step 1: Import your organization’s data into the Input_Actual and Input_Target sheets.
📅 Step 2: Use the Month Selector to switch between MTD and YTD performance.
📈 Step 3: Review Actual vs Target and PY comparisons using up/down arrow visuals.
🧩 Step 4: Explore KPI trends to identify top-performing employees or departments.
🎁 Step 5: Customize visuals, filters, or slicers based on your advocacy objectives.
💬 Step 6: Share the dashboard with HR or marketing teams for collaboration and real-time decision-making.
With just a few clicks, you’ll transform employee engagement data into actionable advocacy insights!
👥 Who Can Benefit from This Employee Advocacy KPI Dashboard in Power BI
💼 Marketing Teams: Measure how employee engagement boosts brand visibility.
🧍♂️ HR Departments: Monitor participation, recognize top advocates, and build stronger culture.
📢 Communication Managers: Track campaign reach and storytelling effectiveness.
📊 Executives & Decision Makers: Get clear advocacy insights to guide corporate branding strategies.
🌐 Social Media Managers: Understand which employees drive maximum impact across platforms.
🏢 Large Enterprises & Startups: Scale your advocacy tracking for any organization size.
This dashboard isn’t just a report — it’s a brand amplification tool that turns your workforce into your strongest marketing asset.
Click here to read the Detailed blog post
Watch the step-by-step video tutorial:
Visit our YouTube channel to learn step-by-step video tutorials
Compatibility and Requirements
- Works in Power BI Desktop, which is free to download from Microsoft.
- You enter your monthly figures in the Input_Actual and Input_Target sheets. Microsoft explains how to install it in Get Power BI Desktop.
Frequently Asked Questions
How many pages does the dashboard have?
It has 7 pages: Summary, KPI Trend, KPI Definition, Input_Actual, Input_Target, KPI Definition sheet and the navigation system that links them.
Where do I enter my data?
Enter your monthly actual figures in the Input_Actual sheet and your goals in the Input_Target sheet. The report then compares Actual with Target and with the previous year.
Can I switch between MTD and YTD?
Yes. Use the Month Selector to change the month and view MTD or YTD performance.
Can I add my own KPIs or change the layout?
Yes. You can add or edit KPIs, pages, slicers and filters to fit your advocacy goals.
Is there an Excel version?
Yes. See the Employee Advocacy KPI Dashboard in Excel.
Related Employee and HR Dashboards
- Employee Advocacy KPI Dashboard in Excel: the same advocacy KPIs in Excel
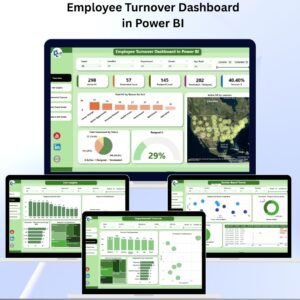
- Employee Turnover Dashboard in Power BI: another HR report in Power BI
- Employee Turnover Dashboard in Excel: turnover analysis in Excel
- Employee Productivity Dashboard in Excel: a productivity view for managers
- Power BI Dashboard Mega Collection: 15 Power BI templates in one download
Browse all Power BI KPI dashboards.













Reviews
There are no reviews yet.