

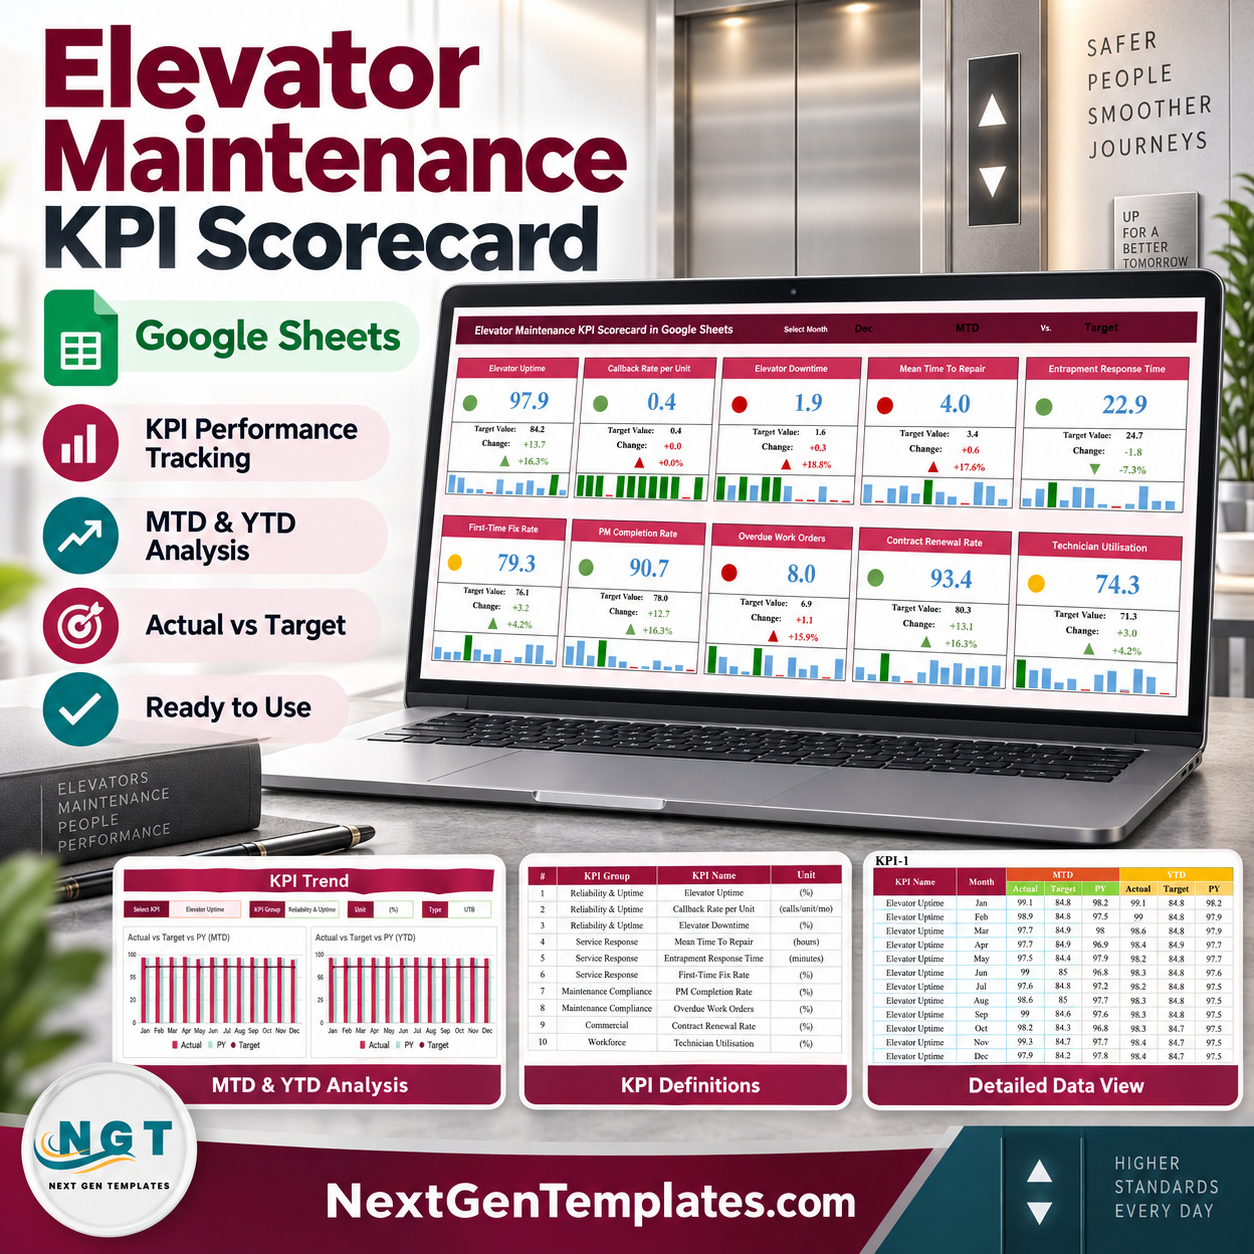

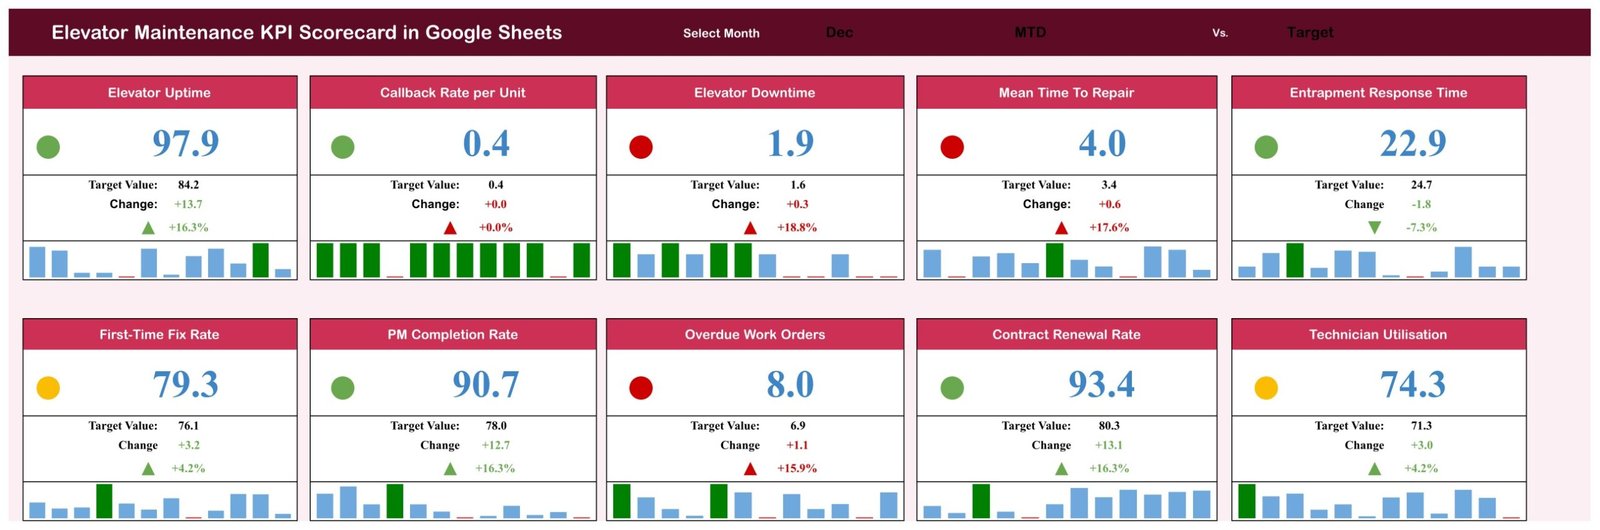
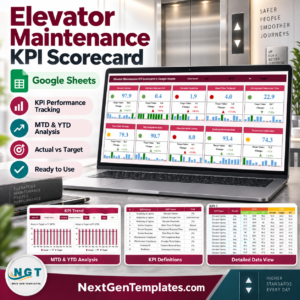
The Elevator Maintenance KPI Scorecard in Google Sheets puts ten monthly lift-service measures on one board, colour-coded against the target you set. Pick a month in the header and every card refreshes: actual value, target value, absolute change, percentage change, a direction arrow, a red/amber/green light and a twelve-bar mini trend. In the December sample five cards are green, two amber and three red – uptime and contract renewals are strong, downtime, mean time to repair and overdue work orders are not. It is a live Google Sheets file, not a subscription: 8 tabs, 10 KPIs, 120 rows of twelve-month data, and a copy link that lands in your own Drive in under two minutes. Help within 72 hours if anything does not work.
Key Features of the Elevator Maintenance KPI Scorecard in Google Sheets
- Ten elevator-service KPIs in five groups – Reliability & Uptime (3), Service Response (3), Maintenance Compliance (2), Commercial (1) and Workforce (1).
- Month picker on the header – one dropdown drives all ten cards.
- MTD or YTD basis – a second dropdown switches every card between month-to-date and year-to-date.
- Target or prior-year comparison – a third dropdown re-points the comparison column from Target to PY.
- Direction-aware traffic lights – six KPIs are upper-the-better and four lower-the-better, so a rise in Elevator Downtime turns a card red while a rise in Elevator Uptime turns it green.
- A twelve-bar sparkline on every card – the full year under each number.
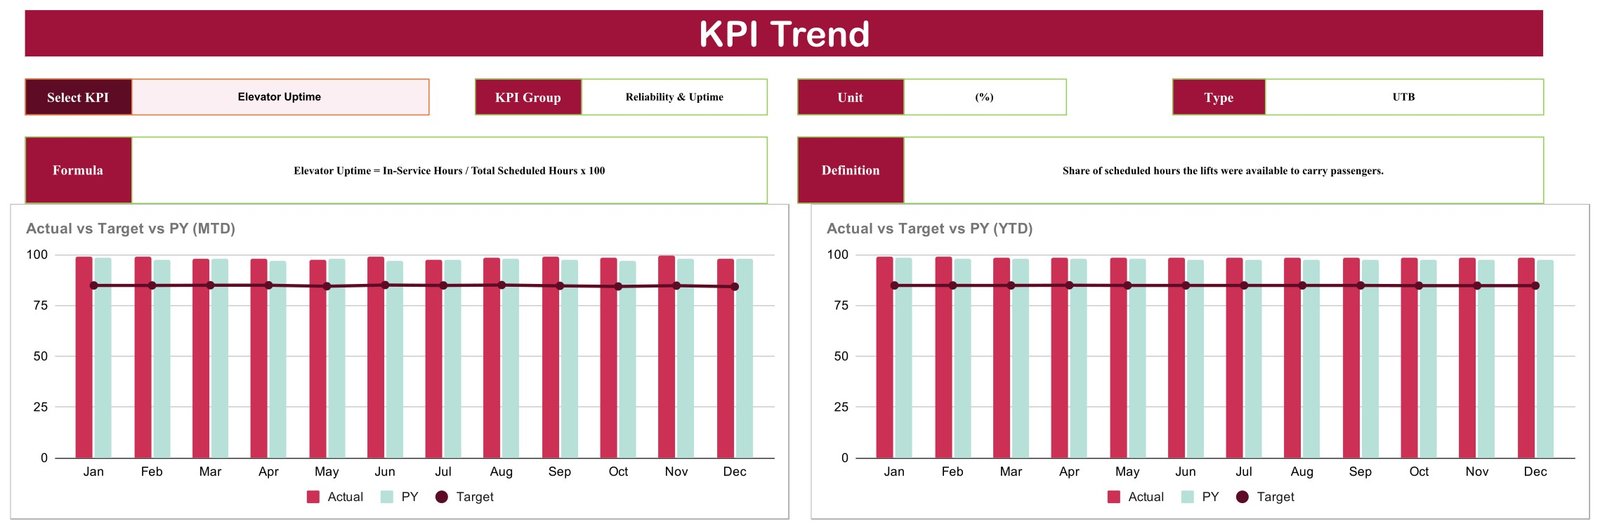
- A KPI Trend page – pick one KPI and read its group, unit, type, formula and definition beside two twelve-month Actual vs Target vs PY charts, MTD and YTD.
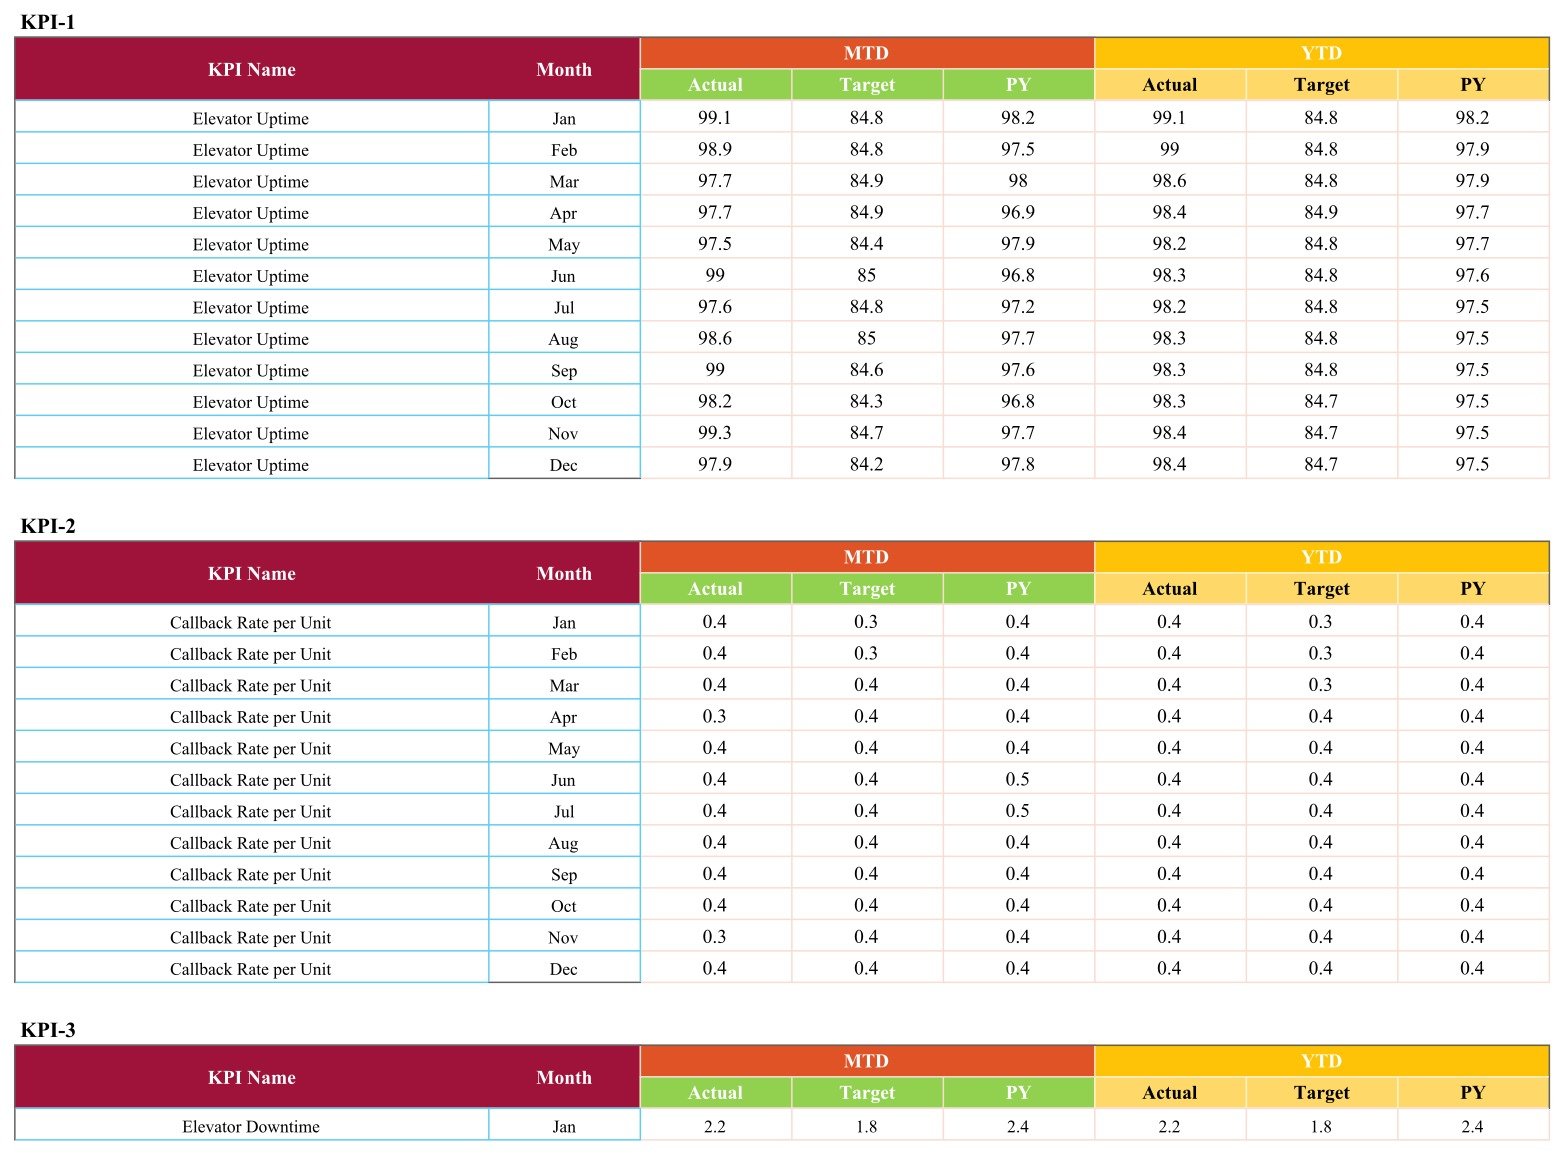
- 120 rows of editable sample data – ten KPI blocks of twelve months, each row carrying MTD and YTD Actual, Target and PY.
What’s Inside the Elevator Maintenance KPI Scorecard in Google Sheets
Eight tabs. Scorecard is the two-row board of ten cards with the three selectors. KPI Trend is the single-KPI drill-down. Input Data is where you work – ten labelled blocks, twelve month rows each, six numeric columns. KPI Definition lists number, group, name, unit, formula, definition and type for all ten measures. Read Me, Color Settings, Support and Trend_Support complete the file; the last two hold the calculation engine and are not meant to be edited.
The ten KPIs, exactly as the sheet defines them:
- Elevator Uptime (%) – In-Service Hours / Total Scheduled Hours x 100
- Callback Rate per Unit (calls/unit/mo) – Unplanned Service Calls / Units Under Contract
- Elevator Downtime (%) – Out-of-Service Hours / Total Scheduled Hours x 100
- Mean Time To Repair (hours) – Total Repair Hours / Number of Repairs
- Entrapment Response Time (minutes) – Total Response Minutes / Entrapment Calls
- First-Time Fix Rate (%) – Faults Fixed on First Visit / Total Faults x 100
- PM Completion Rate (%) – Preventive Visits Completed / Visits Scheduled x 100
- Overdue Work Orders (%) – Work Orders Past Due / Total Open Work Orders x 100
- Contract Renewal Rate (%) – Contracts Renewed / Contracts Up for Renewal x 100
- Technician Utilisation (%) – Billable Field Hours / Total Paid Hours x 100

Elevator Maintenance KPI Scorecard in Google Sheets vs. Excel vs. Paid Field-Service SaaS – Where This Fits
| This scorecard (Google Sheets) | An Excel KPI workbook | Paid field-service SaaS | |
|---|---|---|---|
| Cost | 8.99 one-off | Usually 10-20 one-off | 30-90 per user per month |
| Platform | Google Sheets in any browser | Desktop Excel | Vendor web app |
| Setup time | Under 2 minutes to copy | Download and open | Days of onboarding |
| Real-time collaboration | Yes, native Sheets sharing | Only via OneDrive co-authoring | Yes |
| Mobile access | Yes, Sheets mobile app | Limited | Yes |
| Customizable fields | Yes – rename KPIs, edit formulas | Yes | Rarely without a paid tier |
| Share with link | Yes | No | Seat-based |
| Year-1 cost at 5 users | 8.99 | Around 15 | 1,800-5,400 |
| Direction-aware RAG lights | Yes, per KPI (6 UTB / 4 LTB) | Depends on the workbook | Yes |
| Pulls data from service software | No – figures are typed in | No | Yes |
Who This Template Is For – and Who It’s Not For
It is for lift service companies running a monthly management review, portfolio managers who want one page a month instead of a stack of job reports, and operations leads who already pull these numbers out of a CMMS or job book but have nowhere tidy to put them.
It is not for anyone expecting a live feed – there is no import, API, scheduled refresh, alert or reminder. It is also not an inspection, certification or safety record: the group named Maintenance Compliance measures whether planned visits were completed and whether work orders are past due, nothing more. Statutory inspection records, engineer certifications and incident reports belong in whatever system your jurisdiction requires. If you need per-building rather than per-portfolio numbers, this layout will fight you.
How to Use the Elevator Maintenance KPI Scorecard in Google Sheets
- Open the PDF in your download and click the copy link. A private copy lands in your Google Drive.
- On KPI Definition, rename any KPI that does not match your language and set its unit, formula, definition and type – UTB where higher is better, LTB where lower is better.
- On Input Data, replace the sample numbers. Six columns per row: MTD Actual, Target, PY, then YTD Actual, Target, PY. Leave the month labels alone.
- Return to Scorecard, pick your month, then set the basis to MTD or YTD and the comparison to Target or PY.
- Open KPI Trend for the twelve-month picture of any single KPI, then share the file read-only with whoever attends the review.
Real-World Use Cases
Rehan, service manager for a 600-unit portfolio. First Tuesday of the month he types last month’s figures into Input Data and screens the Scorecard in the operations meeting. The red cards set the agenda, and nobody argues about the numbers because the formula is written on KPI Definition.
Anita, owner of a five-technician lift company. She watches Callback Rate per Unit and Technician Utilisation on KPI Trend across twelve months against prior year before quoting her next maintenance contract.
Daniel, facilities lead at a hospital group. He buys the service rather than employing the engineers, types in what the contractor reports, and brings the twelve-month uptime chart to the contract review.
Frequently Asked Questions
How many KPIs does it hold?
Ten are built and named. The grids are formatted past that so you can add a few, but ten is what ships and what the Scorecard is laid out for.
Can I switch between MTD and YTD?
Yes. The header has a basis dropdown, and every row of Input Data carries both MTD and YTD values.
Can I compare against last year instead of target?
Yes. Change the comparison dropdown from Target to PY.
Can I change the red/amber/green thresholds?
Not from the Color Settings tab – that tab documents the bands but no formula reads it. The live thresholds sit in the Support tab’s calculation block, so edit them there.
Does it connect to my CMMS or service software?
No. There is no import, no API and no automatic refresh. You type summarised monthly figures.
Is this an inspection or safety compliance record?
No. It is a management scorecard. It measures service performance only, and it does not evidence statutory inspection, engineer certification or code conformance.
What exactly do I download?
A PDF carrying the Google Sheets copy link plus a page-by-page preview. Click the link and the sheet copies into your own Drive.
About the Author
Built by PK – Microsoft Certified Professional with 15+ years of Excel, Google Sheets, and Power BI experience. Founder of NextGenTemplates, reaching 300K+ subscribers across YouTube channels. Every template is hand-built and tested before release.
Explore Related Templates
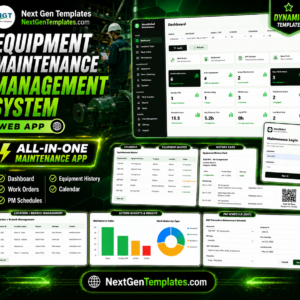
This is the scorecard line – a month-picker board of ten cards. It is a different product from the analytical Facility Services Dashboard in Google Sheets, which slices a transaction table, and from the KPI dashboard line such as the HVAC Contractor KPI Dashboard in Google Sheets. Pair it with the Elevator Maintenance Checklist in Google Sheets for the job-level record, the Maintenance Work Order Data Entry System in Excel for logging jobs, or the Equipment Maintenance Management System Web App when a spreadsheet is no longer enough. Same-line neighbours include the Locksmith Business KPI Scorecard and the Fencing Contractor KPI Scorecard. Browse the Google Sheets category or the Google Sheets KPI collection.
Two things to know before you buy. The Scorecard month dropdown offers “June” and “July” in full while Input Data stores “Jun” and “Jul” – selecting either of those two months blanks all ten cards until you shorten the two entries in the data validation list. The Read Me tab also ships empty. Neither affects the other ten months, and both are one-minute fixes; they are disclosed here rather than discovered later.
Buy the Elevator Maintenance KPI Scorecard in Google Sheets for 8.99 (regular 13.99), copy it into your Drive, and run your next monthly service review off one page. Help within 72 hours if anything does not work.
Watch the step-by-step video Demo:
Last updated: 6 September 2026.
Compatibility and Requirements
- Works in Google Sheets. You need a free Google account and a web browser.
- You pick the month, the MTD or YTD basis and the Target or PY comparison from dropdowns on the Scorecard tab. Google explains dropdowns in Create an in-cell dropdown list.
- The file has no import, API or automatic refresh. You type the monthly figures into the Input Data tab.
More Questions About This Template
Is there an Excel version of this scorecard?
Yes. See the Elevator Maintenance KPI Scorecard in Excel.
Is there a dashboard version instead of a scorecard?
Yes. The Elevator Maintenance KPI Dashboard in Google Sheets, the Excel edition and the Power BI edition are separate products.
Which tabs hold the data I need to edit?
Edit Input Data for the monthly figures and KPI Definition for KPI names, units, formulas and type. Support and Trend_Support hold the calculation engine and are not meant to be edited.
Related Elevator Maintenance Templates
- Elevator Maintenance KPI Scorecard in Excel: the same scorecard for Excel
- Elevator Maintenance KPI Dashboard in Google Sheets: a dashboard view of elevator service KPIs
- Elevator Maintenance KPI Dashboard in Power BI: the Power BI edition
- Equipment Maintenance Log Tracker in Google Sheets: a log for individual maintenance jobs
- Maintenance Schedule Calendar in Google Sheets: plan service visits by date
Browse all Google Sheets KPI dashboards.


































Reviews
There are no reviews yet.