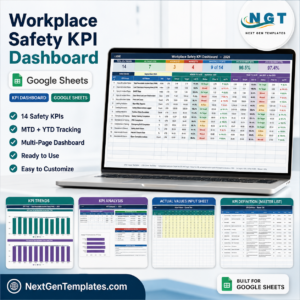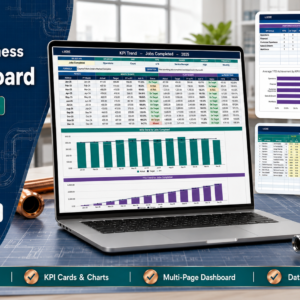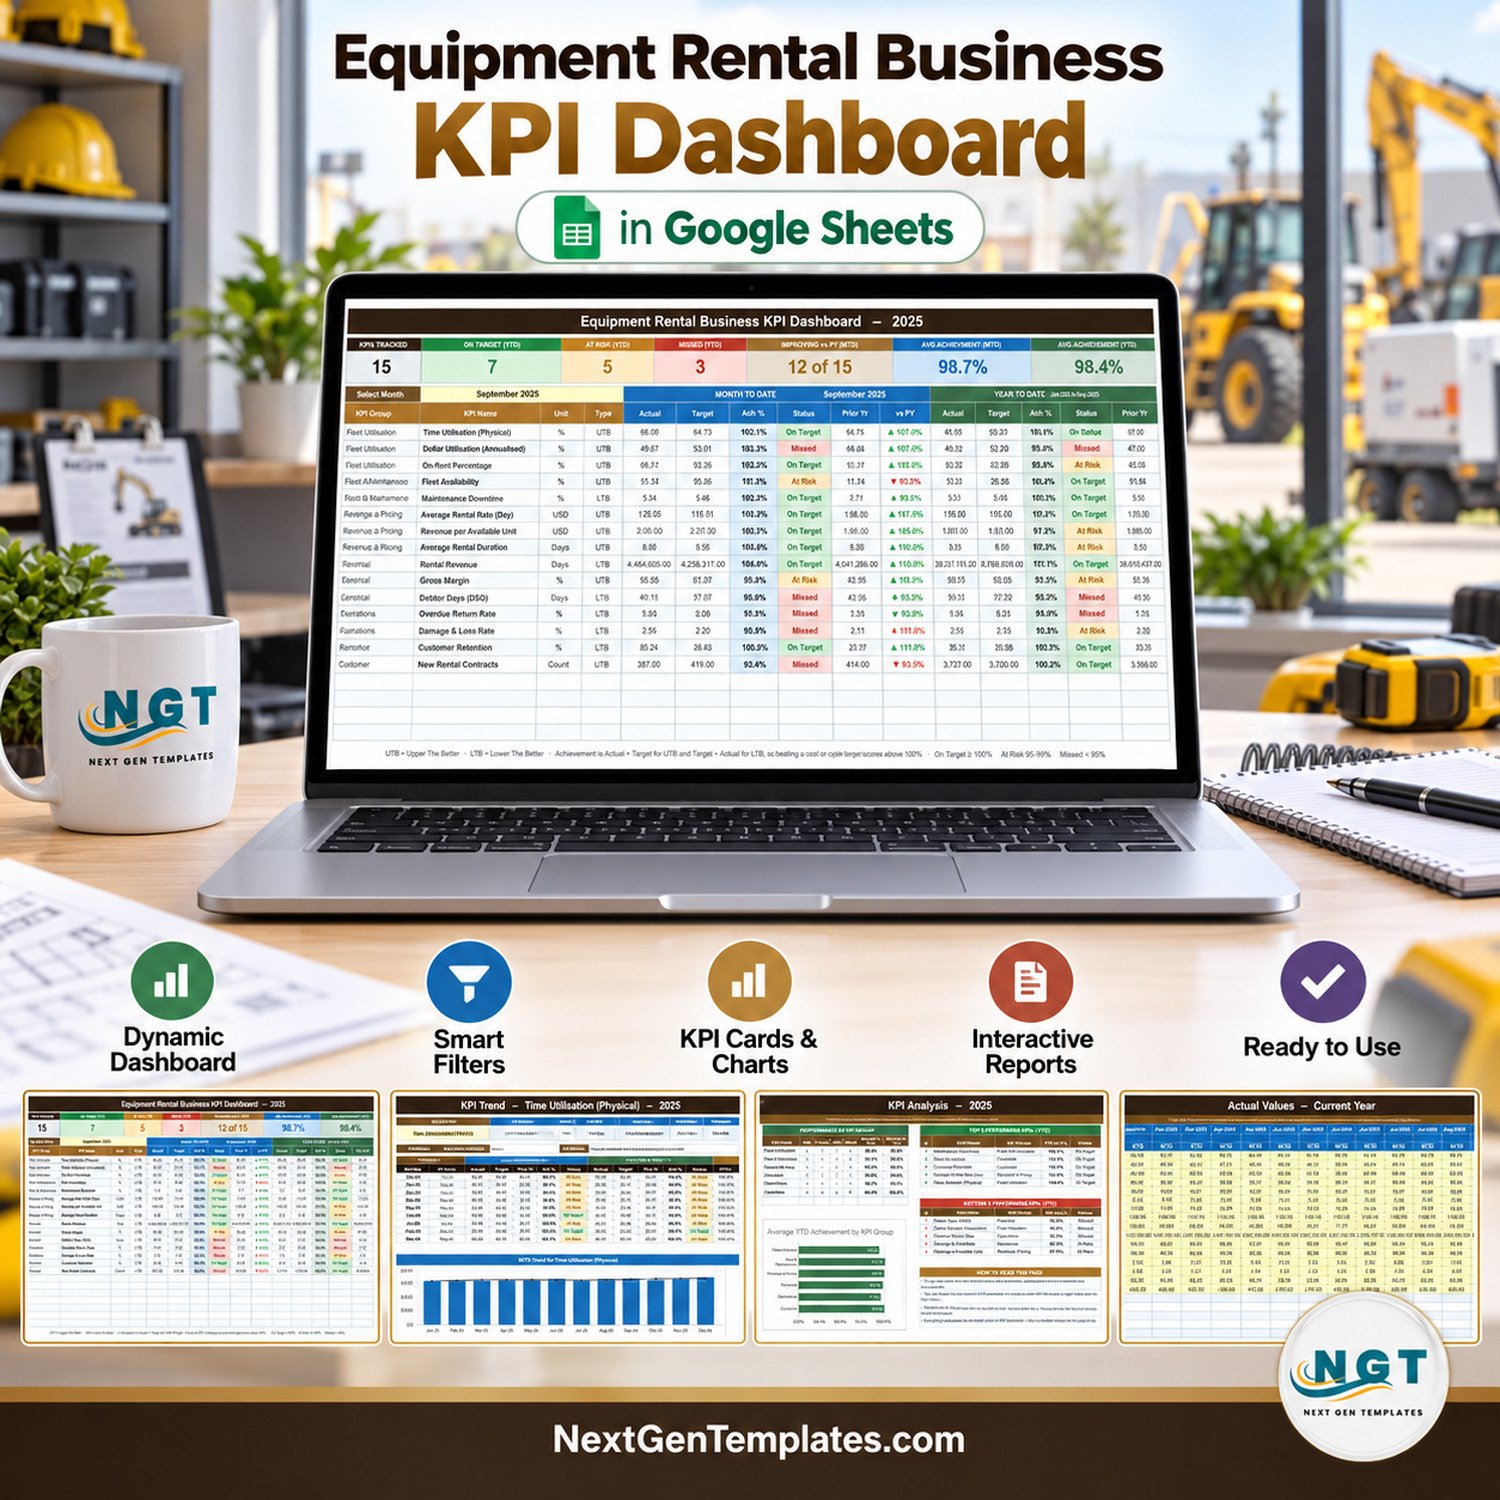
A machine that sits in the yard still carries its purchase cost, its servicing and its insurance. The Equipment Rental Business KPI Dashboard in Google Sheets puts 15 monthly measures of a plant and tool hire company on one scorecard, grouped into 6 KPI groups, with month-to-date and year-to-date achievement, traffic lights and a prior-year comparison in every row. In the September 2025 sample, 7 KPIs are On Target for the year, 5 are At Risk and 3 are Missed, 12 of 15 are improving on last year, and average achievement reads 98.7% MTD and 98.4% YTD. Every figure is a worksheet formula: no add-ons, no Apps Script and nothing to install.
✅ Instant download · One-time payment · No subscription · No per-user fees · Lifetime access to your own copy
This listing belongs to our KPI Dashboard family: a month-picker scorecard with a KPI Trend page and a KPI Analysis page. It is a different template from our analytical Google Sheets dashboards and from the Equipment Rental Business KPI Scorecard in Google Sheets, which belongs to the separate KPI Scorecard line with its own layout.
🔑 Key Features of the Equipment Rental Business KPI Dashboard in Google Sheets
🚜 15 rental KPIs in 6 groups – Fleet Utilisation (3), Fleet & Maintenance (2), Revenue & Pricing (3), Financial (3), Operations (2) and Customer (2). They cover Time Utilisation (Physical), Dollar Utilisation (Annualised), On-Rent Percentage, Fleet Availability, Average Rental Rate (Day), Revenue per Available Unit, Gross Margin, Debtor Days (DSO), Overdue Return Rate and Customer Retention, among others.
📅 One month picker drives the workbook – choose a month in the dropdown on KPI Dashboard and the scorecard, its seven summary cards and the KPI Analysis page all recalculate. There is no refresh button and no query to run.
↕️ Direction-aware scoring – 11 KPIs are upper-the-better (UTB) and 4 are lower-the-better (LTB): Maintenance Downtime, Debtor Days (DSO), Overdue Return Rate and Damage & Loss Rate. Achievement is Actual ÷ Target for UTB and Target ÷ Actual for LTB, so cutting overdue returns below target scores above 100%.
🚦 Traffic lights with editable thresholds – On Target from 100%, At Risk from 95% to 99%, Missed below 95%. The thresholds live in the Status formulas on KPI Dashboard, so you can match them to your own reporting rules.
📈 Prior-year comparison in every row – each KPI shows last year’s value and a vs PY percentage with an arrow. The arrow shows the raw direction and its colour shows whether that direction is good for that KPI, so a falling Maintenance Downtime shows a green down-arrow.
🧩 Room for 22 KPIs – 15 slots are filled and 7 live rows wait empty, so adding a KPI on KPI Definition needs no formula edits.
🗓️ Any reporting year – cell E3 on KPI Input – Actual sets the first month of the year; the month dropdown, the Target and Prior Year sheets and every sheet title re-base from it.
📦 What Is Inside the Equipment Rental Business KPI Dashboard
Page 1: Home
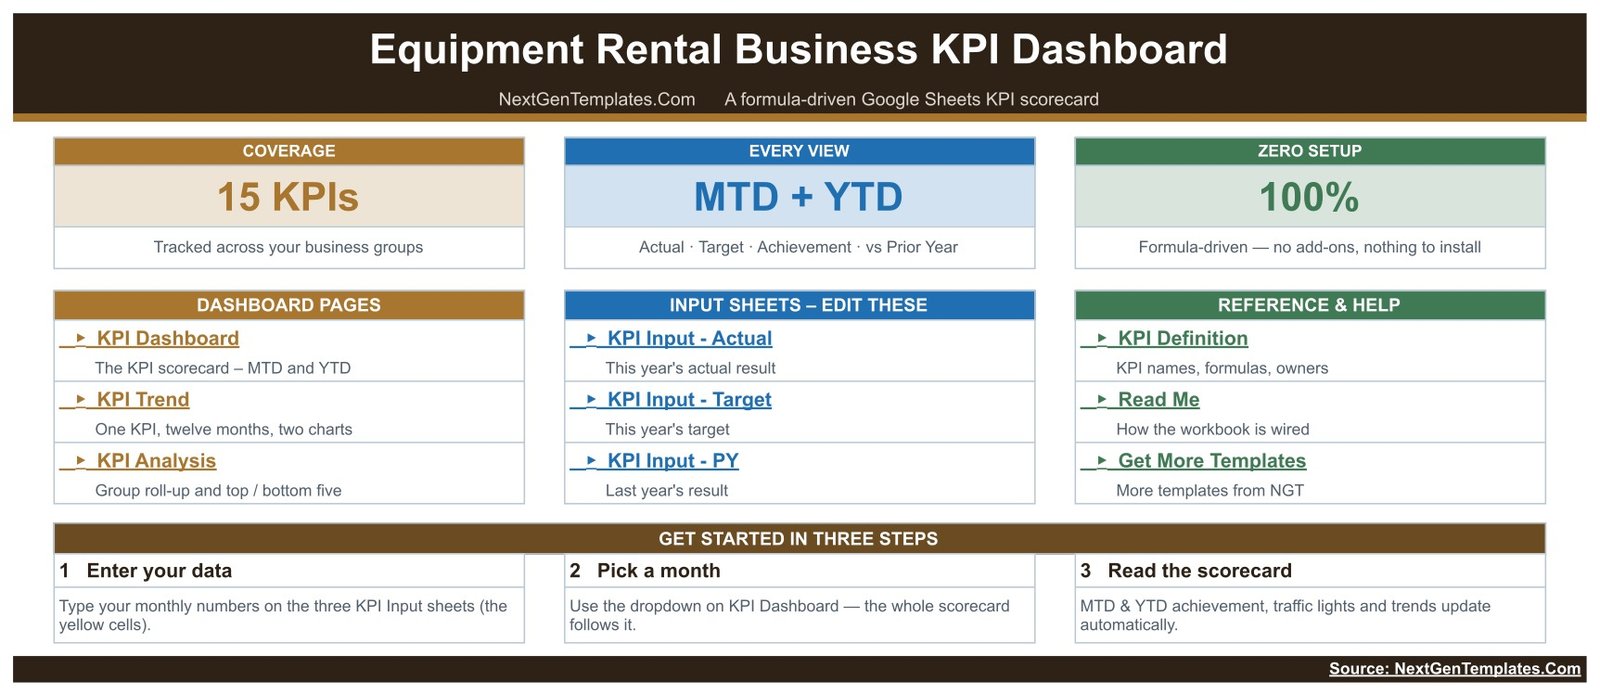
Three header cards (15 KPIs, MTD + YTD, 100% formula-driven), links to the three dashboard pages, the three input sheets and the reference sheets (KPI Definition, Read Me, Get More Templates), and a three-step get-started strip.
Page 2: KPI Dashboard
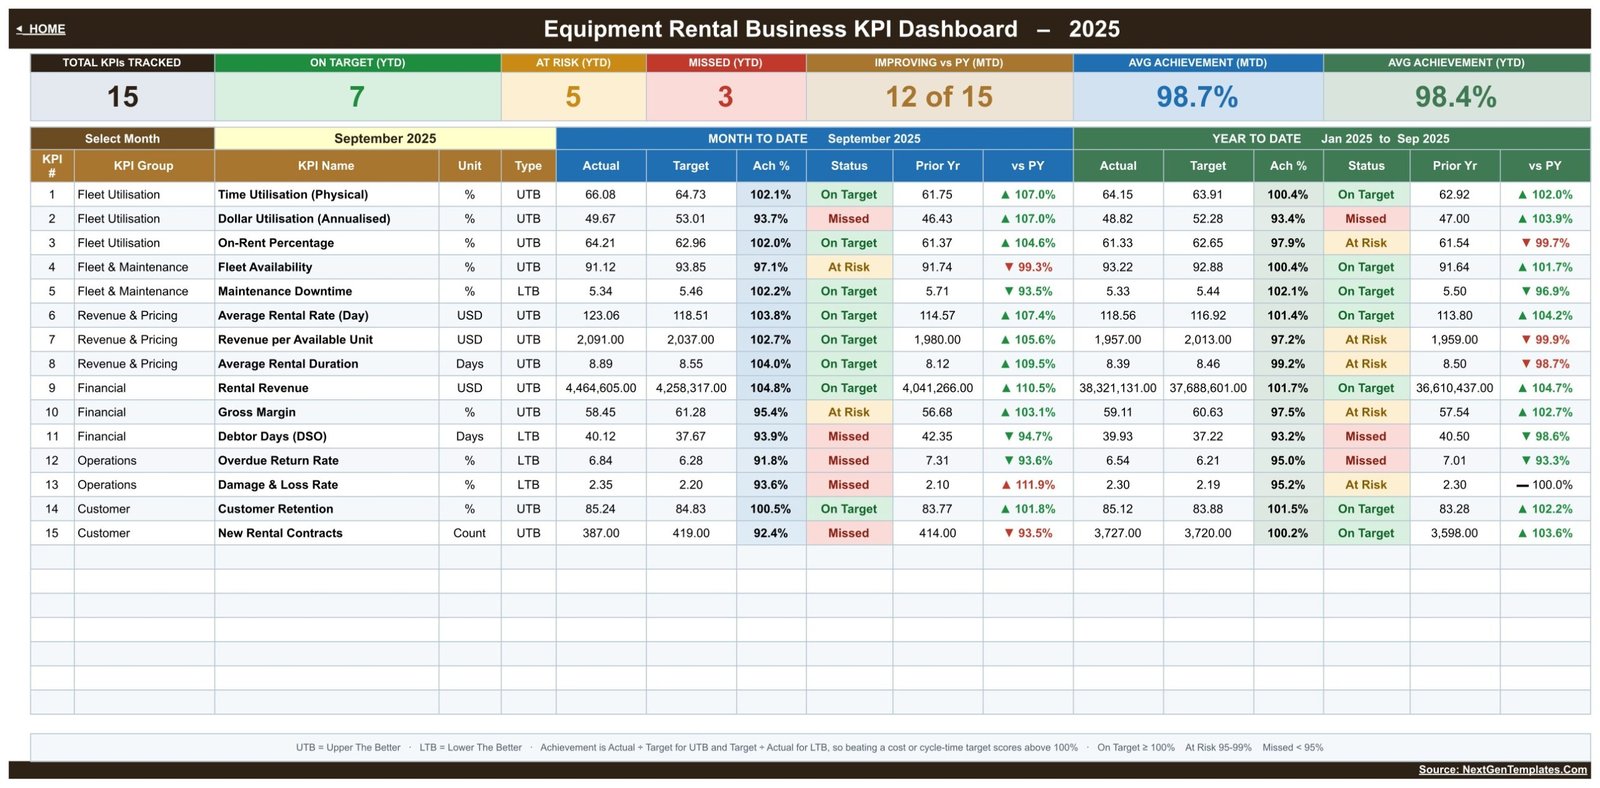
The scorecard. Seven cards – Total KPIs Tracked, On Target (YTD), At Risk (YTD), Missed (YTD), Improving vs PY (MTD), Avg Achievement (MTD) and Avg Achievement (YTD) – sit above one row per KPI with group, unit, type and the MTD and YTD actual, target, achievement %, status, prior year and vs PY. In the sample, Rental Revenue reaches 104.8% of its monthly target while Dollar Utilisation (Annualised) is Missed at 93.7%.
Page 3: KPI Trend
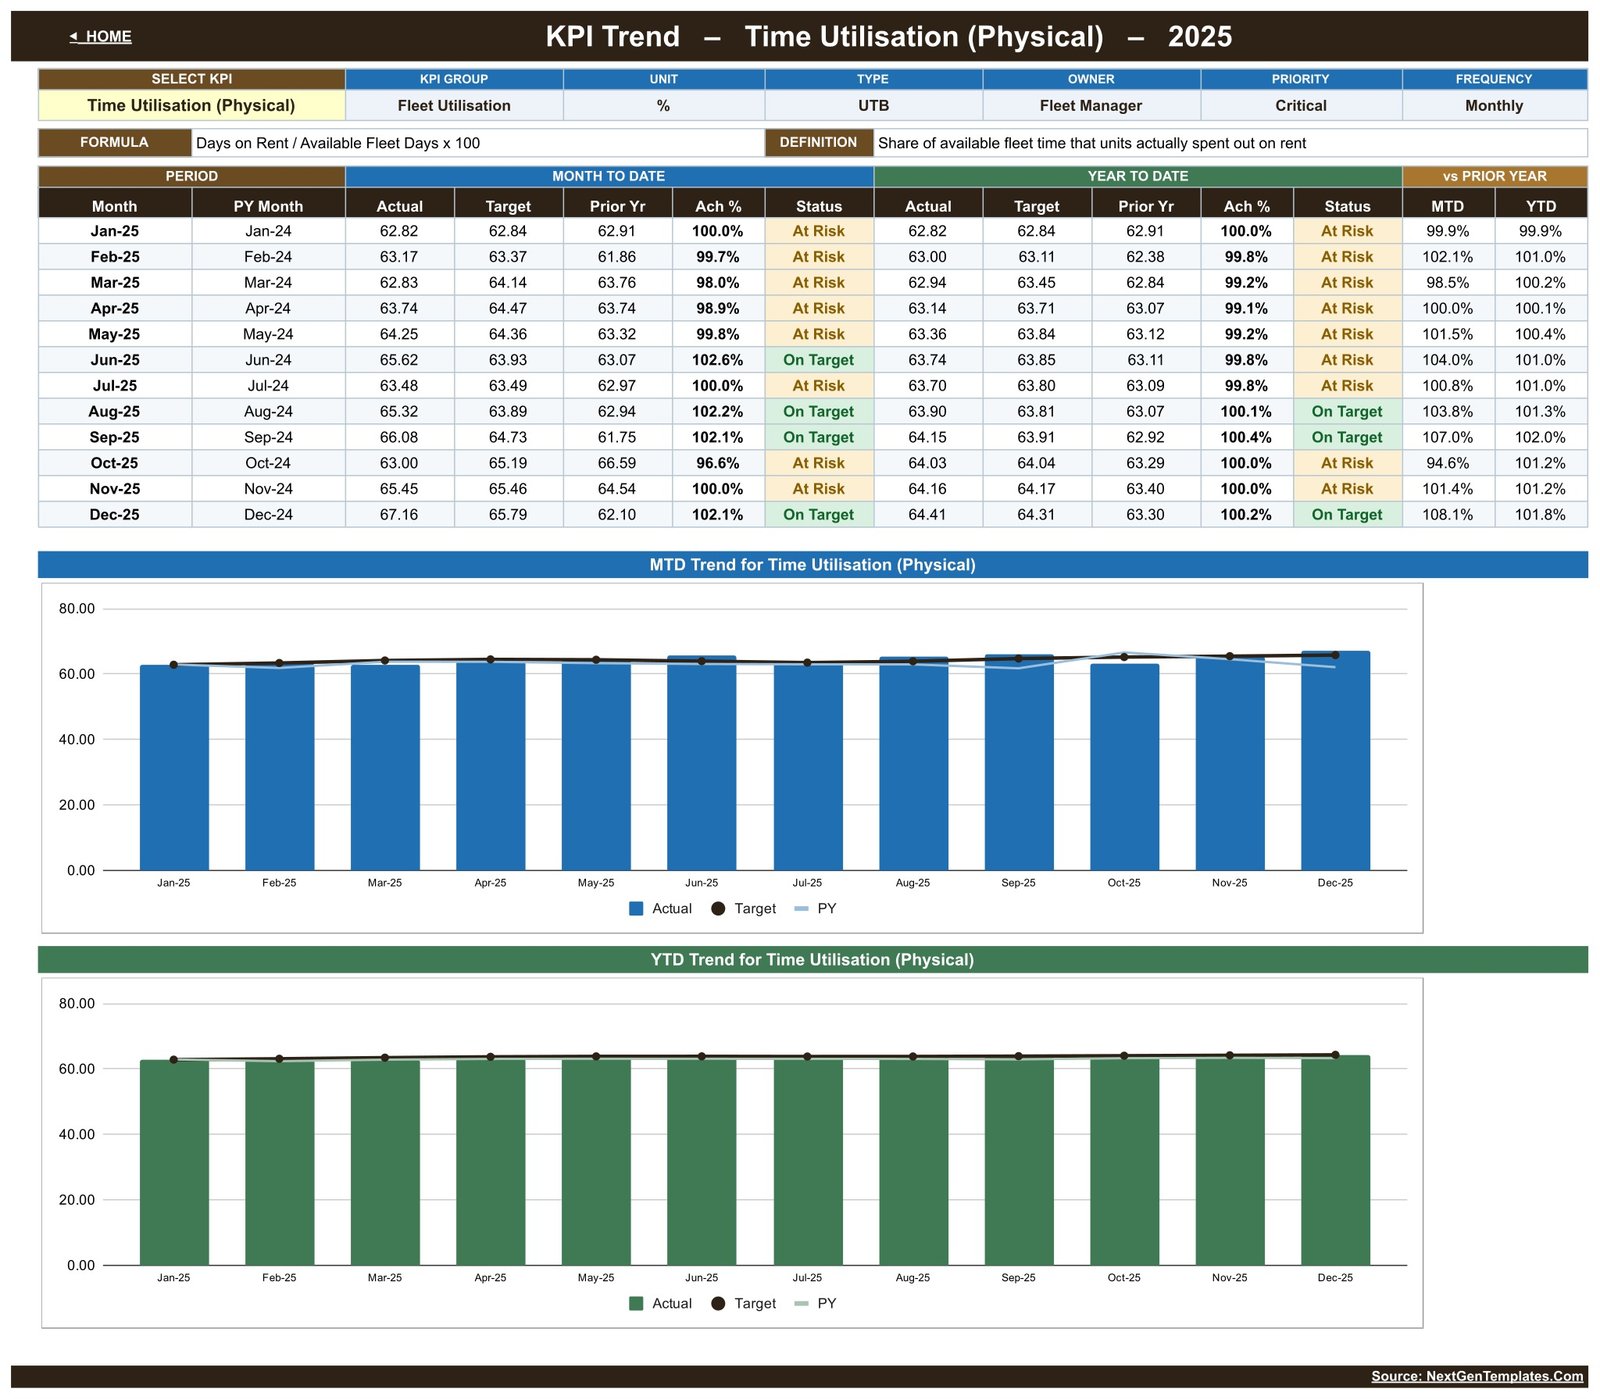
Pick one KPI to see its group, unit, type, owner, priority, frequency, formula and definition, a twelve-month MTD and YTD table, and two charts: MTD Actual, Target and Prior Year by Month, and YTD Actual, Target and Prior Year by Month.
Page 4: KPI Analysis
Performance by KPI Group counts On Target, At Risk and Missed KPIs and averages MTD and YTD achievement per group, with an Average YTD Achievement by KPI Group chart – Fleet & Maintenance leads at 101.2% YTD and Operations trails at 95.1%. The Top 5 and Bottom 5 tables rank KPIs by YTD achievement: Maintenance Downtime tops the list at 102.1% and Debtor Days (DSO) sits at the bottom with 93.2%.

Page 5: KPI Input – Actual
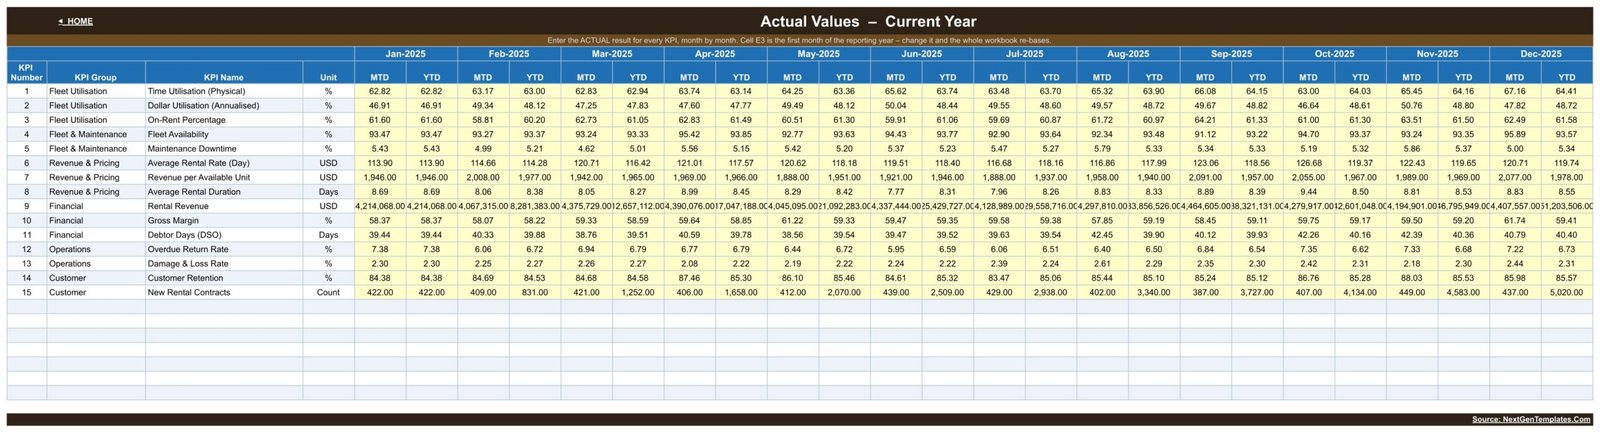
The yellow input grid holds an MTD and a YTD cell for every KPI in every month. KPI Input – Target and KPI Input – PY use the same layout for targets and last year’s results.
Page 6: KPI Definition
The master list: number, group, name, unit, formula, definition, UTB/LTB type, owner, priority and frequency for each KPI – for example Dollar Utilisation is defined as annualised rental revenue divided by original equipment cost. Rename or add a KPI here and every other sheet follows.

📊 Google Sheets vs. Excel vs. Paid Rental Software – Where This Fits
| Feature | Equipment Rental KPI Dashboard (Google Sheets) | Excel KPI workbook | Paid rental management software |
|---|---|---|---|
| Cost | ✅ One-time template price | Template plus a Microsoft 365 or Office licence | Recurring subscription, usually per user or per asset |
| Platform | ✅ Any browser with a Google account | Excel desktop | Vendor cloud app |
| Setup time | ✅ Replace the sample numbers and pick a month | Similar, file based | Configuration and data migration |
| Real-time team collaboration | ✅ Built into Google Sheets | Needs OneDrive or SharePoint co-authoring | Yes, per paid seat |
| Mobile access | ✅ Google Sheets app | Limited on phones | Vendor app |
| Customizable KPIs | ✅ Edit KPI Definition, 22 slots | Yes, with formula work | Limited to vendor reports |
| Share with a link | ✅ Yes | Through OneDrive | User logins |
| Year-1 cost at 5 users | ✅ The same one-time price | Template plus 5 licences | 5 subscriptions |
| Bookings, fleet tracking and invoicing | ❌ Not included – reporting only | ❌ Not included | ✅ Core feature |
For hire companies that want a monthly KPI review without paying for another subscription, this Google Sheets scorecard sits in the sweet spot.
👥 Who This Template Is For – and Who It Is Not For
✅ This template is built for:
- Owners and general managers of plant, tool and equipment hire companies who review results once a month
- Fleet and workshop managers who report utilisation, availability and maintenance downtime to leadership
- Pricing, sales and finance leads tracking day rates, revenue per unit, gross margin, retention and debtor days
- Consultants building a monthly KPI pack for a rental client
❌ This template is NOT for:
- Firms that need bookings, contracts, check-in and check-out, telematics or invoicing – this is a reporting template, not rental management, booking or fleet-telematics software
- Anyone looking for equipment inspection, safety or certification records – none are kept here, and the figures are sample data
- Teams that want live machine data – the scorecard runs on monthly numbers you type in
⚙️ How to Use the Equipment Rental Business KPI Dashboard
- Open the PDF in your download and click its link to make your own editable copy in Google Drive.
- Review KPI Definition and rename, add or clear KPIs to match your fleet.
- Set the first month of your reporting year in cell E3 on KPI Input – Actual.
- Type monthly MTD and YTD figures into the yellow cells on KPI Input – Actual, KPI Input – Target and KPI Input – PY.
- Pick a month on KPI Dashboard and read the traffic lights and summary cards.
- Open KPI Trend for one KPI over twelve months, and KPI Analysis for the group roll-up and the top and bottom five.
💼 Real-World Use Cases
Tom runs the fleet at a regional plant hire depot. Before the monthly review he picks the month, checks Time Utilisation, On-Rent Percentage and Fleet Availability, then opens KPI Trend to show whether utilisation has held up since spring.
Aisha leads pricing and sales. She reads Average Rental Rate (Day), Revenue per Available Unit and New Rental Contracts side by side, and uses the Bottom 5 table to decide which numbers go on the next commercial agenda.
Ravi handles credit control. Debtor Days (DSO) is lower-the-better, so a rising figure scores below 100% and turns red. He brings the twelve-month chart and the prior-year comparison to the finance meeting instead of rebuilding it by hand.
❓ Frequently Asked Questions
Do I need a paid Google Workspace account?
No. The Equipment Rental Business KPI Dashboard in Google Sheets works with a free Google account. Open the PDF in your download, click the link, and Google Drive creates your own editable copy. No add-ons, Apps Script or macros are needed, and it runs in any modern browser or the Google Sheets app.
Can I change the 15 KPIs to my own?
Yes. KPI Definition is the master list. Rename a KPI there and every sheet follows; fill one of the 7 empty rows to add a KPI, up to 22 in total; clear a row to remove one. You also set its unit, formula text, owner, priority and whether it is upper- or lower-the-better.
Does the template calculate YTD for me?
No, and that is deliberate. Each input sheet holds both an MTD and a YTD value per month, so you decide whether YTD is a running total, like Rental Revenue, or an average, like Gross Margin. The dashboard then picks the chosen month, calculates achievement and status, and compares both against target and prior year.
Are the figures in the screenshots real?
No. The dashboard ships with twelve months of fictional 2025 sample data so you can see every page working before you type a number. Replace the actual, target and prior-year figures with your own and the scorecard, charts and rankings update automatically.
Does it track bookings, equipment location or inspections?
No. It reports monthly management numbers such as utilisation, availability, overdue returns and damage and loss. It does not take bookings, raise invoices, track machines by GPS or keep inspection or certification records, and it does not replace your rental or safety systems.
Is there an Excel or Power BI edition?
An Equipment Rental Business KPI Dashboard in Excel and one in Power BI are in preparation and not available yet. Today the Google Sheets edition is the one you can buy. Browse our Google Sheets KPI Dashboard templates for other industries.
How is this different from the Equipment Rental Business KPI Scorecard?
They are separate products. This one belongs to the KPI Dashboard family – 15 KPIs, a month picker, MTD and YTD traffic lights, a KPI Trend page and a KPI Analysis page. The Equipment Rental Business KPI Scorecard in Google Sheets comes from our KPI Scorecard line, with a different layout.
👤 About the Author
Built by PK – Microsoft Certified Professional with 15+ years of Excel, Google Sheets and Power BI experience, and founder of NextGenTemplates. Tutorials on YouTube at @PKAnExcelExpert, @NextGenTemplates and @NeoTechNavigators. Every template is hand-built and tested before release.
🔗 Explore Related Templates
🚜 Equipment Rental Business KPI Scorecard in Google Sheets – the same industry in our KPI Scorecard line.
🏗️ Crane Rental KPI Scorecard in Google Sheets – for crane hire fleets.
⚙️ Heavy Machinery Dashboard in Google Sheets – an analytical dashboard for machinery data.
🗓️ Fleet Maintenance Calendar in Google Sheets – plan service dates across the fleet.
💻 Rental Equipment Management System Web App – if you need the day-to-day rental records this scorecard does not keep.
📊 Construction Equipment KPI Dashboard in Google Sheets – KPIs for contractors who own their plant.
Browse every Google Sheets template.
📖 Click here to read the Detailed Blog Post
🎥 Visit our YouTube channel for step-by-step video tutorials
👉 YouTube.com/@NextGenTemplates
New to Sheets? Google Docs Editors Help covers copying files, dropdowns and sharing.
Watch the step-by-step video Demo:
📅 Last updated: September 2026