

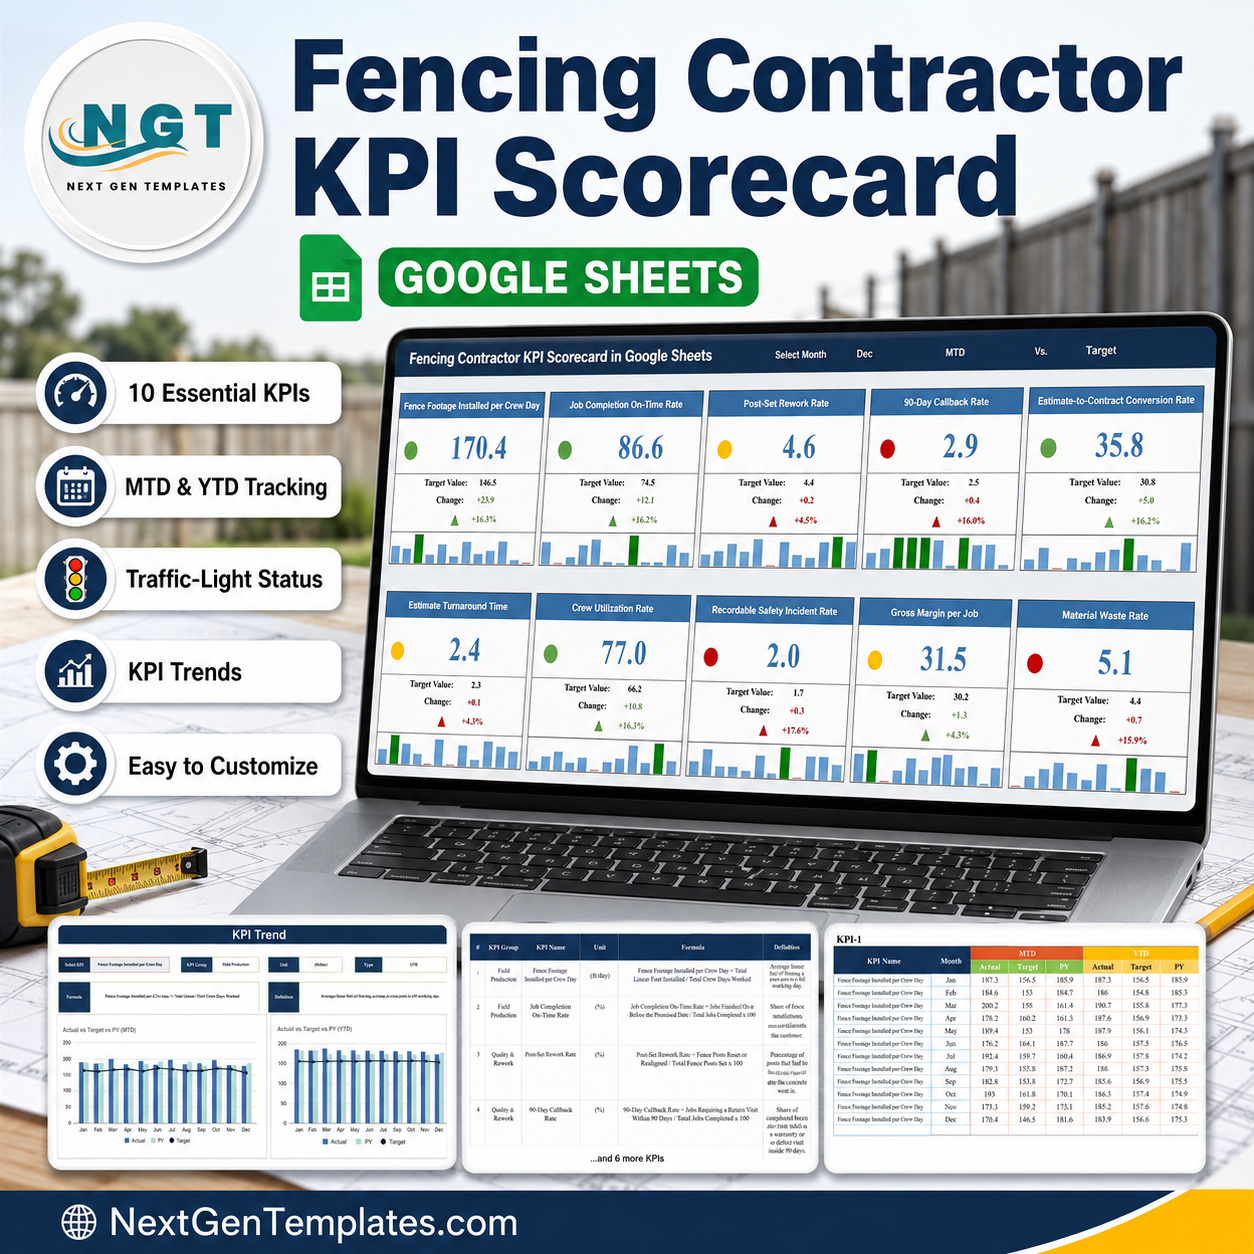

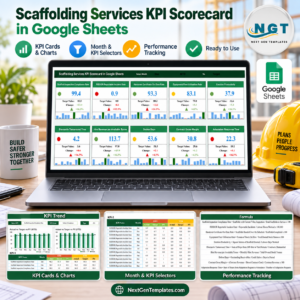
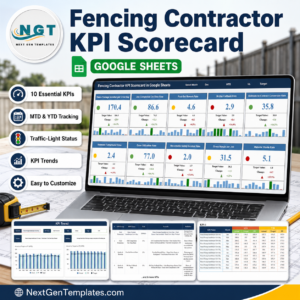
The Fencing Contractor KPI Scorecard in Google Sheets puts 10 fencing KPIs across 5 KPI groups on one screen, with a month picker, an MTD/YTD switch, a Target-or-Prior-Year comparison and direction-aware traffic lights. The sample year is fully populated: 12 months of Actual, Target and Prior Year numbers for every KPI – 120 month-rows in all – so you can see exactly how it behaves before you type a single figure of your own. It runs on formulas only: no Apps Script, no macros, no add-ons, and it opens in any browser on a free Google account. Instant download, lifetime access, and support if anything does not work as described.
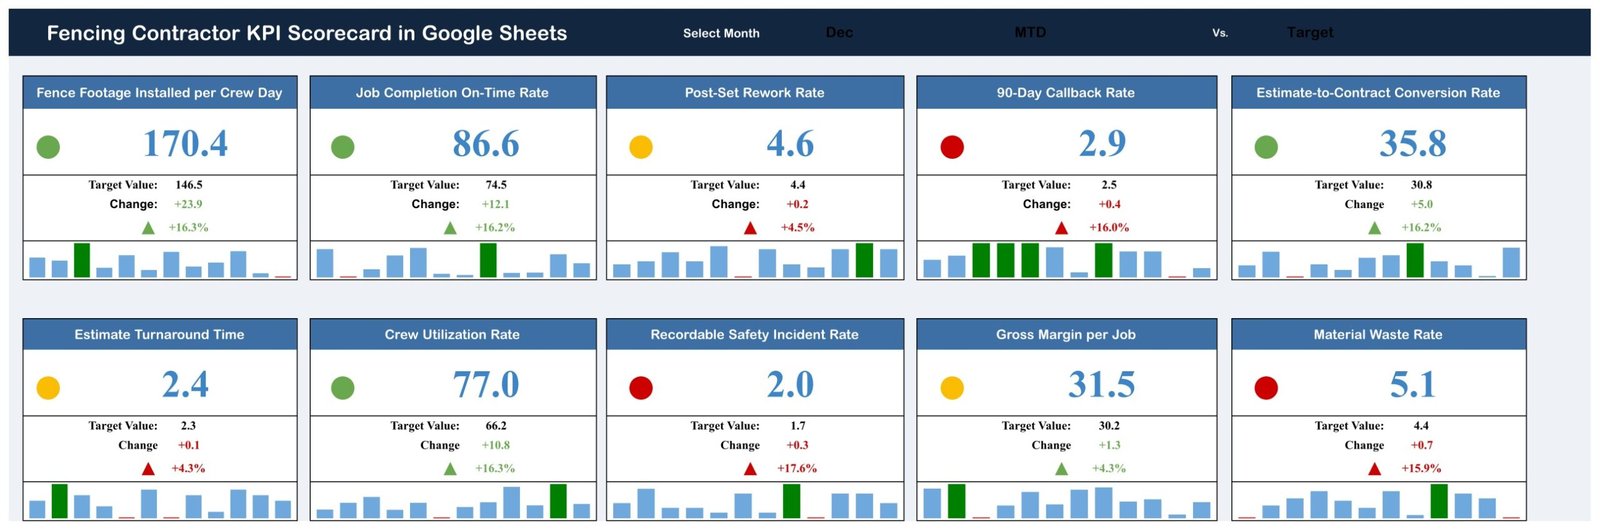
This is the KPI Scorecard line – not an analytical dashboard, and not the KPI Dashboard line. A scorecard answers one question, is this number good or bad this month and by how much, for a fixed set of measures. If you want slicers, pivot-style breakdowns and drill-through instead, the KPI Dashboard templates are the different product you are after.
Key Features of the Fencing Contractor KPI Scorecard in Google Sheets
- Ten fencing-specific KPIs, not generic business metrics. Fence Footage Installed per Crew Day, Job Completion On-Time Rate, Post-Set Rework Rate, 90-Day Callback Rate, Estimate-to-Contract Conversion Rate, Estimate Turnaround Time, Crew Utilization Rate, Recordable Safety Incident Rate, Gross Margin per Job and Material Waste Rate.
- Five KPI groups, two KPIs each. Field Production, Quality & Rework, Sales & Estimating, Crew & Safety and Financial.
- Direction-aware traffic lights. Five KPIs are Upper-the-Better and five are Lower-the-Better, so a rising Material Waste Rate turns red instead of green. Every card also carries a coloured up/down arrow that follows the same rule.
- Month picker plus two comparison switches. Choose the month, switch the whole sheet between MTD and YTD, and compare against Target or Prior Year. All ten cards recalculate together.
- A 12-month sparkline under every card, with the selected month highlighted, so each tile shows the level and the shape at the same time.
- KPI Trend page. Pick any of the ten KPIs from a drop-down and get its group, unit, direction, formula and plain-English definition, plus two combo charts – “Actual vs Target vs PY (MTD)” and “Actual vs Target vs PY (YTD)” – running Jan to Dec.
- A KPI Definition sheet you can rewrite. Change a KPI name, unit, formula text or direction there and the Scorecard cards, the Trend page drop-down and the calculation chain all follow it.
- Formula-driven throughout – SUMIFS over named ranges plus VLOOKUP and INDEX/MATCH for the definitions. Nothing to install, no script to authorise.
What’s Inside the Fencing Contractor KPI Scorecard in Google Sheets
The file is a single Google Sheet with eight tabs. Four are the ones you work in; the rest do the arithmetic.
1. Scorecard. The main page: ten cards in two rows of five. Each card shows the KPI name, the current value in large type, a red/amber/green dot, the Target Value (or PY Value, depending on the switch), the absolute Change, an arrow and the Change %. The header strip carries Select Month, the MTD/YTD selector and the Vs. Target/PY selector.
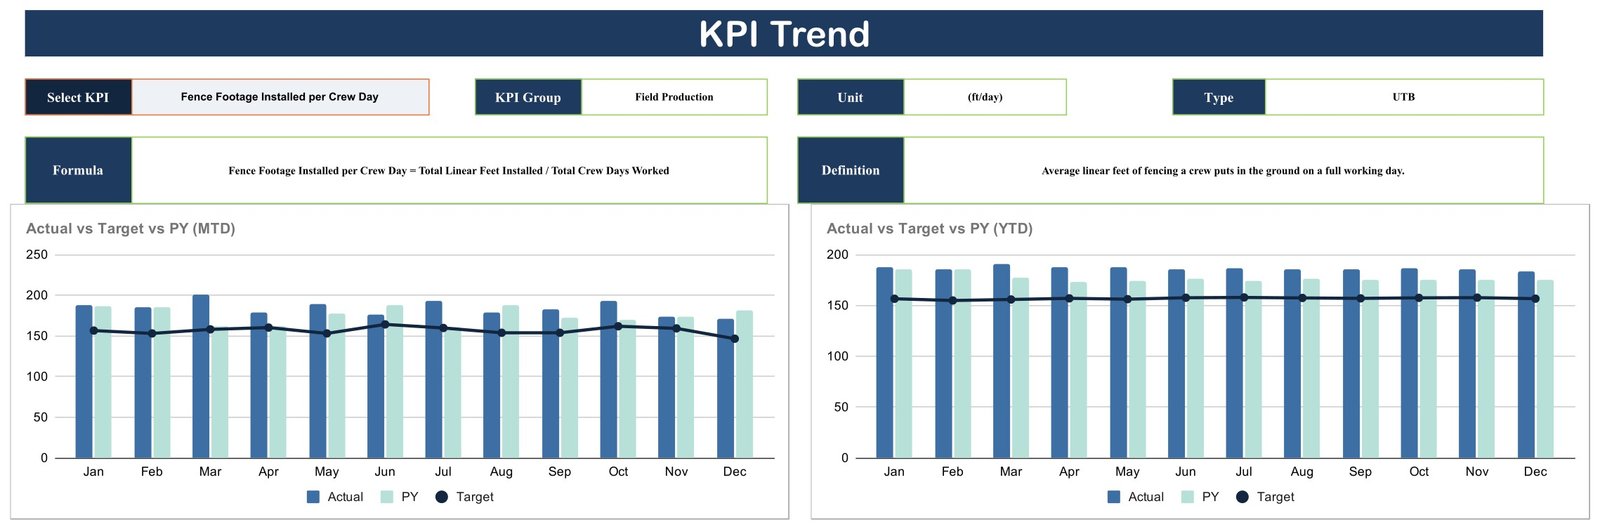
2. KPI Trend. One KPI at a time, chosen from a drop-down. The page prints the KPI Group, Unit and Type (UTB or LTB), the full formula – for example Fence Footage Installed per Crew Day = Total Linear Feet Installed / Total Crew Days Worked – and the definition, then the MTD and YTD charts underneath. The bars are Actual and Prior Year; the dark line is Target.

3. KPI Definition. The dictionary: number, KPI Group, KPI Name, Unit, Formula, Definition and Type for all ten measures. This is where you rename a KPI, change its unit, or flip it between UTB and LTB.
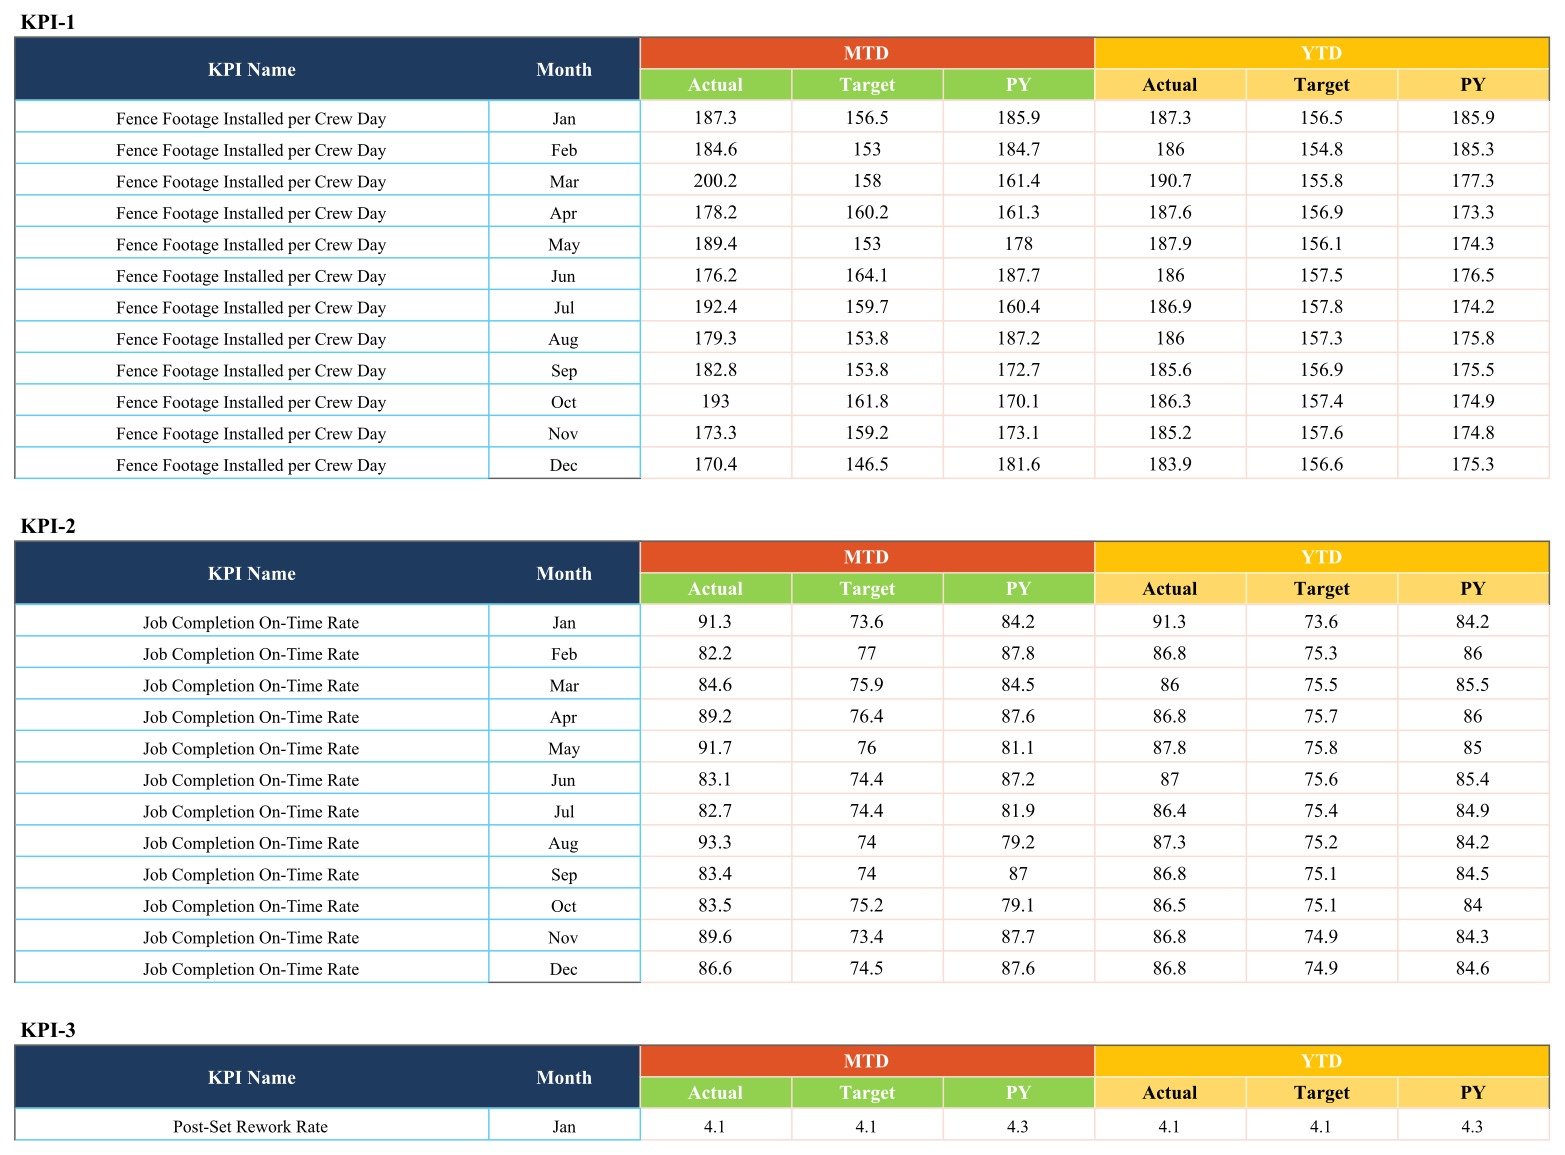
4. Input Data. Where your numbers go. One block per KPI – KPI-1 through KPI-10 – with twelve month rows each and six value columns: MTD Actual, MTD Target, MTD PY, then YTD Actual, YTD Target and YTD PY.
5. Color Settings documents the RAG rule as a variance-percentage table for both directions. 6. Support is the calculation engine: it resolves the selected month, pulls MTD or YTD, and works out Change, Change %, arrow colour and traffic-light colour per KPI – the amber and red thresholds the sheet actually reads live here. 7. Trend_Support feeds the two trend charts. 8. Read Me is a blank tab left for your own notes.
Google Sheets vs. Excel vs. Paid Field-Service SaaS – Where This Fits
| This scorecard (Google Sheets) | Excel KPI scorecard | Paid field-service SaaS | |
|---|---|---|---|
| Cost | 8.99 one-off | 9.99 one-off | 49-300+ per user per month |
| Platform | Any browser, free Google account | Excel 2016 or later, Windows or Mac | Web plus mobile apps |
| Setup time | About 20 minutes – copy the sheet, paste your months in | About 20 minutes | Days to weeks, often with onboarding fees |
| Real-time team collaboration | Yes – native, several people in the file at once | Only through OneDrive co-authoring | Yes |
| Mobile access | Yes – Google Sheets app or browser | Limited | Yes |
| Customisable KPIs | Yes – rename all ten on the KPI Definition tab | Yes | Only the fields the vendor exposes |
| Share with a link | Yes | No – you send the file | Seat-based invitations |
| Year-1 cost, 5 users | 8.99 | 9.99 | 3,000-18,000 |
| Direction-aware RAG (UTB/LTB) | Yes – set per KPI | Yes | Varies; often up-is-good only |
| Job scheduling and invoicing | No | No | Yes – that is what you are paying for |
The honest read: SaaS runs your fencing operation, this scorecard measures it. Plenty of contractors already have a scheduling tool and still have nowhere to see rework and callback rates sitting next to margin. That gap is what this fills, for the price of a tank of fuel.
Who This Template Is For – and Who It’s Not For
It fits owner-operator and small-to-mid fencing companies running 2 to 20 crews; operations managers who report monthly to an owner or a board; estimators who want conversion rate and turnaround time tracked rather than guessed at; and anyone already living in Google Workspace who does not want another login.
It does not fit if you need job scheduling, dispatch, invoicing or a customer portal – buy software for that. It is not a safety or OSHA recordkeeping system: it carries a Recordable Safety Incident Rate as a monthly summary KPI you type in, and nothing more. It will not import from your accounting package – the twelve monthly numbers are entered by hand or pasted from a report. And if you want to slice a KPI by crew, region or fence type, that is analysis work the KPI Dashboard line does and a scorecard deliberately does not.
How to Use the Fencing Contractor KPI Scorecard in Google Sheets
- Open the PDF in your download and click the copy link. It creates your own editable copy in your Google Drive. The original stays view-only, so you can always take a fresh copy.
- Decide your ten KPIs. Keep the shipped set or rewrite the KPI Definition tab – name, group, unit, formula text, definition and Type (UTB or LTB). Getting Type right matters more than anything else on that sheet, because it drives every traffic light.
- Enter your numbers on the Input Data tab. Work down KPI-1 to KPI-10 and, for each of the twelve months, fill MTD Actual, Target and PY, then the YTD trio. Replace the sample values in place; do not insert or delete rows.
- Read the Scorecard. Pick a month, choose MTD or YTD, choose Target or PY. Ten cards, ten answers.
- Work the reds. Open KPI Trend, select the red KPI, and check whether it is a one-month spike or a six-month slide before you act on it.
- Share it. Give crew leads view access and the office team edit access. The monthly review takes ten minutes because nobody has to rebuild anything.
Real-World Use Cases
Dave, owner of a six-crew residential fencing company. He knew jobs were slipping but not by how much. Two months in, Job Completion On-Time Rate sat amber while Estimate Turnaround Time was red – quotes were going out days late, which pushed the whole schedule. He moved measuring to a dedicated estimator and watched both cards move.
Priya, operations manager at a commercial fencing contractor. Her monthly pack used to be four spreadsheets. Now the Scorecard tab is the pack. The KPI that changed behaviour was Post-Set Rework Rate: sitting just above target, it was quietly eating crew time that nobody had costed.
Marcus, estimator turned part-owner. He watches Estimate-to-Contract Conversion Rate and Gross Margin per Job side by side. When conversion climbed past target while margin drifted amber, the answer was obvious – he was winning work by underpricing it. The scorecard made the trade-off visible on one screen.
Frequently Asked Questions
Is this the same file as the Fencing Contractor KPI Scorecard in Excel?
No – they are companion editions, not the same template ported across. The Excel edition is built on a different base: eleven sheets, twenty KPI slots, a KPI Analysis page with group achievement and Top 5 / Bottom 5, four charts per KPI on its trend page, and a Prior Month comparison as well as Target and PY. This Google Sheets edition has eight tabs, ten filled KPIs, one KPI Trend page with two charts, and Target or PY comparison. The KPI sets differ too: this edition splits five Upper-the-Better against five Lower-the-Better and includes a Recordable Safety Incident Rate, which the Excel edition does not carry. Buy the one that matches where your team already works.
Do I need a paid Google Workspace account?
No. A free personal Google account is enough. Everything is native Google Sheets formulas, so there is nothing to install and no script to authorise.
Can I change the KPIs to my own?
Yes. Rewrite the rows on the KPI Definition tab and the Scorecard cards, the KPI Trend drop-down and the calculation chain all follow. Update the matching KPI names on the Input Data tab as well, so the SUMIFS lookups still find their rows.
Can I add an eleventh KPI?
The sheet ships laid out for ten – ten cards on the Scorecard page and ten blocks on Input Data. Adding more means extending those layouts by hand, so treat ten as the practical limit unless you are comfortable editing formulas.
How do the traffic lights decide red, amber and green?
By variance percentage against the comparison you have selected, and by KPI direction. For an Upper-the-Better KPI, variance at or below 0% is red, up to +10% is amber and above +10% is green; for a Lower-the-Better KPI the logic is mirrored, so coming in under target is the good outcome. The Color Settings tab spells the rule out, and the thresholds the sheet actually reads sit on the Support tab, so they can be moved.
What exactly do I download?
A PDF. It is a preview of the scorecard plus the “Make a copy” link to the live Google Sheet – that link is the product. There is no .xlsx or .zip in this listing.
Is this an OSHA or safety recordkeeping system?
No. It reports one monthly safety KPI – Recordable Safety Incident Rate per 200,000 field hours – as a summary figure you enter yourself. It does not record incidents, store investigations or produce any regulatory return. Keep your OSHA 300 log exactly where it is.
About the Author
Built by PK – Microsoft Certified Professional with 15+ years of Excel, Google Sheets, and Power BI experience. Founder of NextGenTemplates, reaching 300K+ subscribers across YouTube channels. Every template is hand-built and tested before release.
Explore Related Templates
Other trades in the same KPI Scorecard line: Concrete Contractor KPI Scorecard in Google Sheets, Drywall Contractor KPI Scorecard in Google Sheets, Roofing Contractor KPI Scorecard in Google Sheets and Masonry Contractor KPI Scorecard in Google Sheets. If you want breakdowns and filters rather than a fixed card set, look at the KPI Dashboard line instead. Browse everything in Google Sheets templates, or narrow to Google Sheets KPI templates.
Get the Fencing Contractor KPI Scorecard in Google Sheets for 8.99 (regularly 13.99). Instant download, lifetime access, free bug fixes, help within 72 hours if anything does not work. A full walkthrough is on the blog: Fencing Contractor KPI Scorecard in Google Sheets.
Watch the step-by-step video Demo:
Last updated: September 2026.
Compatibility and Requirements
- Works in Google Sheets. You need a free Google account and a web browser. There is no Apps Script, no macros and no add-ons to install.
- You pick the month, the MTD or YTD view and the Target or Prior Year comparison from dropdowns on the Scorecard page. Google explains dropdowns in Create an in-cell dropdown list.
More Questions About This Template
Who is this scorecard for?
It is for owner-operators and small to mid-size fencing companies, operations managers who report monthly, and estimators who want conversion rate and quote turnaround tracked. It is not a scheduling, dispatch or invoicing tool.
How many KPIs are tracked and how are they grouped?
Ten fencing KPIs in five groups of two: Field Production, Quality and Rework, Sales and Estimating, Crew and Safety, and Financial. Five are Upper-the-Better and five are Lower-the-Better.
Where do I enter my own numbers?
On the Input Data sheet. Each KPI has a block of twelve month rows with MTD and YTD columns for Actual, Target and Prior Year. Replace the sample values in place and do not insert or delete rows.
Is there a Google Sheets dashboard or Power BI version for fencing contractors?
Yes. See the Fencing Contractor KPI Dashboard in Google Sheets and the Fencing Contractor KPI Dashboard in Power BI.
Related Fencing Contractor Templates
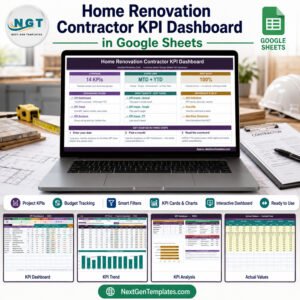
- Fencing Contractor KPI Dashboard in Google Sheets: the dashboard view of fencing KPIs in Google Sheets
- Fencing Contractor KPI Scorecard in Excel: the Excel edition of this scorecard
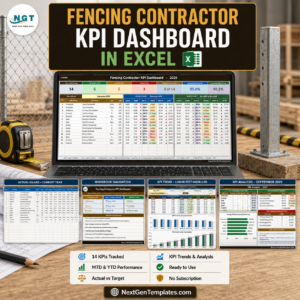
- Fencing Contractor KPI Dashboard in Excel: a fencing dashboard in Excel
- Fencing Contractor KPI Dashboard in Power BI: the Power BI edition
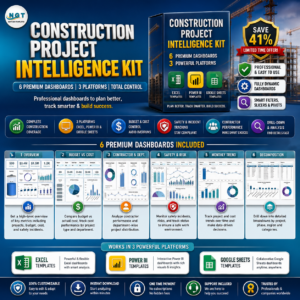
- Construction Project Intelligence Kit: 6 construction templates in one download
Browse all Google Sheets KPI dashboards.



























Reviews
There are no reviews yet.