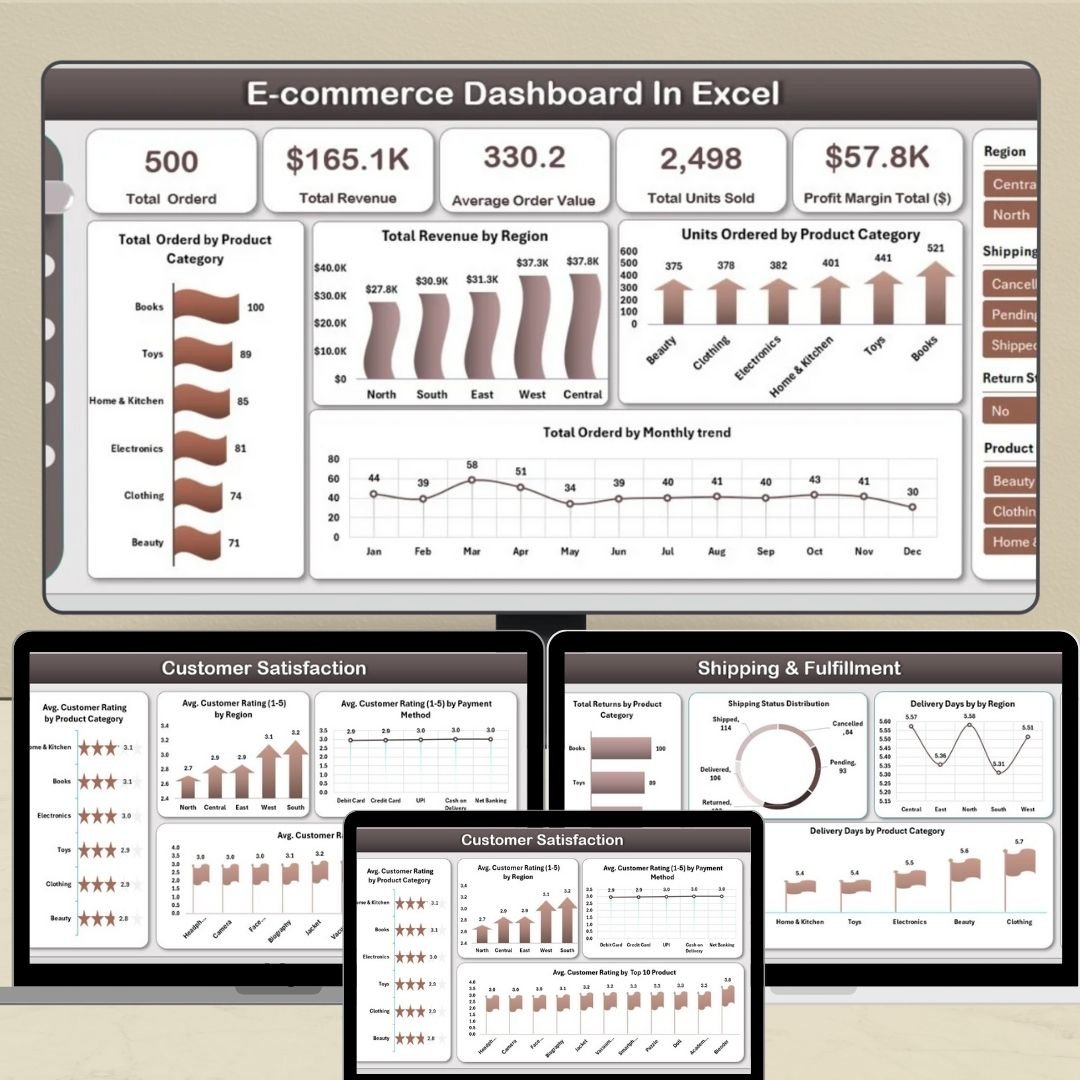
E-commerce Dashboard in Excel
Managing an e-commerce business in today’s fast-paced market requires a strategic approach to tracking performance, sales, customer satisfaction, and inventory. The E-commerce Dashboard in Excel is the perfect tool to streamline these tasks, offering a powerful, easy-to-use solution to monitor your e-commerce metrics and make data-driven decisions that drive growth and profitability.
This comprehensive template consolidates your key e-commerce metrics into a single dashboard, providing real-time insights to optimize your business operations, track sales, manage inventory, and evaluate customer feedback, all within an intuitive interface.

Key Features of the E-commerce Dashboard in Excel
🔑 Centralized Data Overview
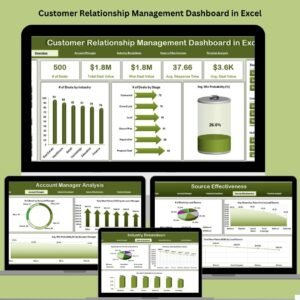
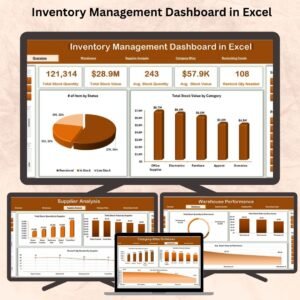
Access all your essential business data in one place. The dashboard consolidates performance metrics such as orders, revenue, customer ratings, and profit margins, making it easy to evaluate your e-commerce success.
📊 Real-Time Insights
The dashboard updates instantly as you enter data, giving you real-time visibility into your business performance. Track key metrics like total revenue, average order value, units sold, and customer ratings without delay.
💼 Comprehensive Data Sheets
This dashboard includes multiple sheets tailored to different aspects of your business:
-
Overview Sheet: Provides a snapshot of key metrics, such as total revenue, average order value, and profit margins.
-
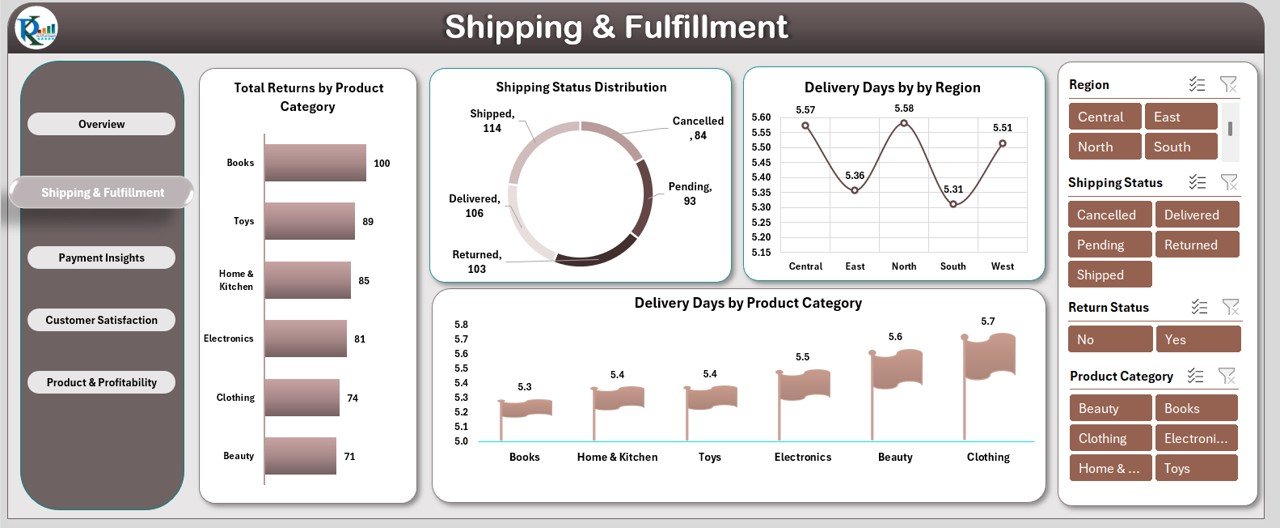
Shipping & Fulfillment Sheet: Track shipping performance and returns, and visualize delivery times by region and product category.
-
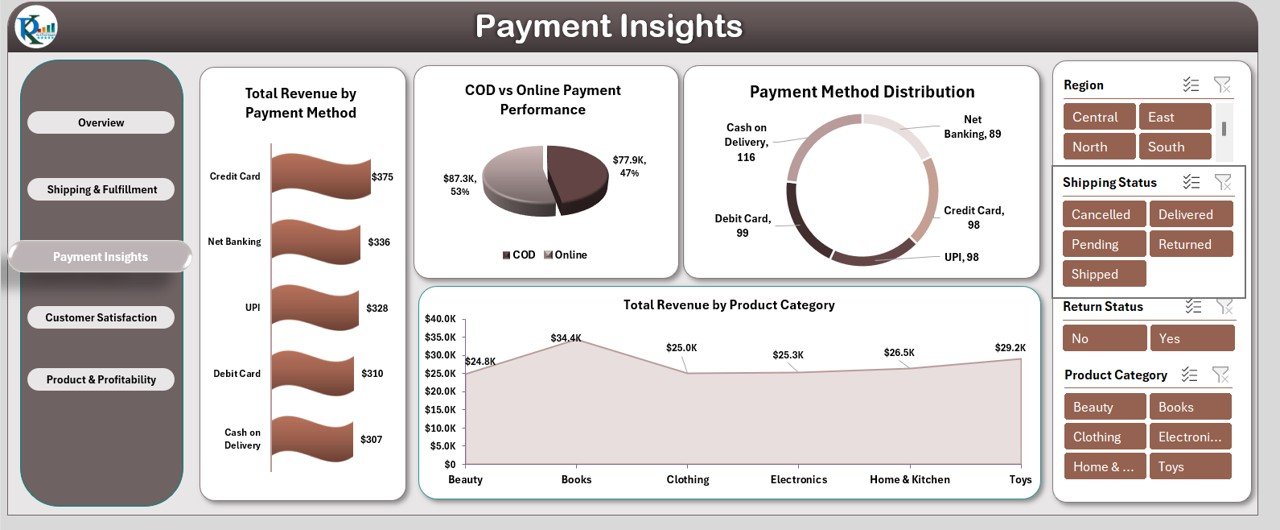
Payment Insights Sheet: Analyze revenue by payment method, and compare COD and online payment performances.
-
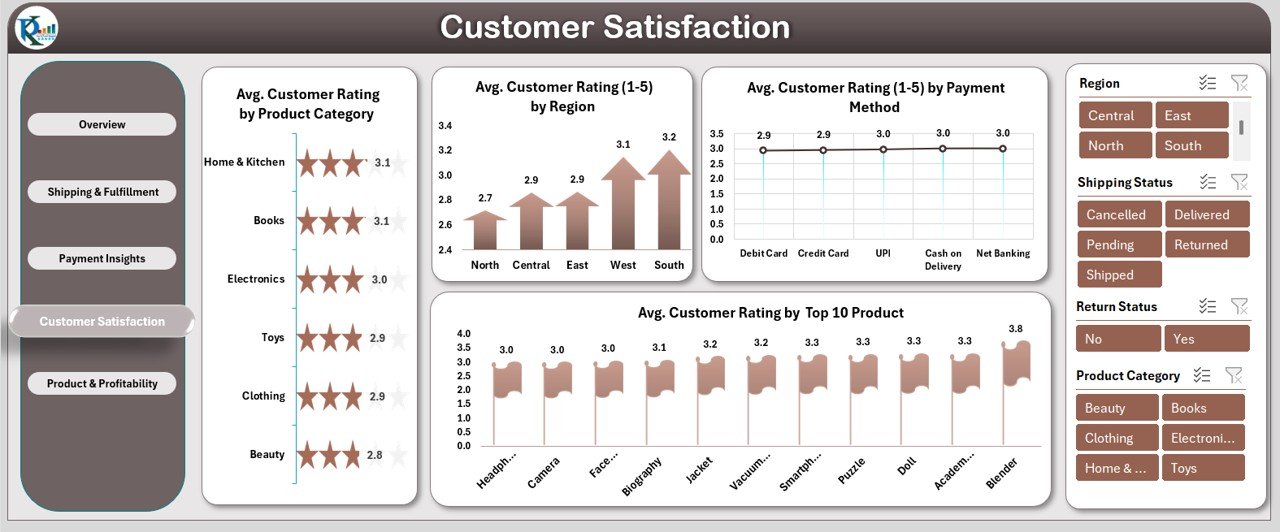
Customer Satisfaction Sheet: Monitor customer feedback and satisfaction with detailed ratings by product and payment method.
-
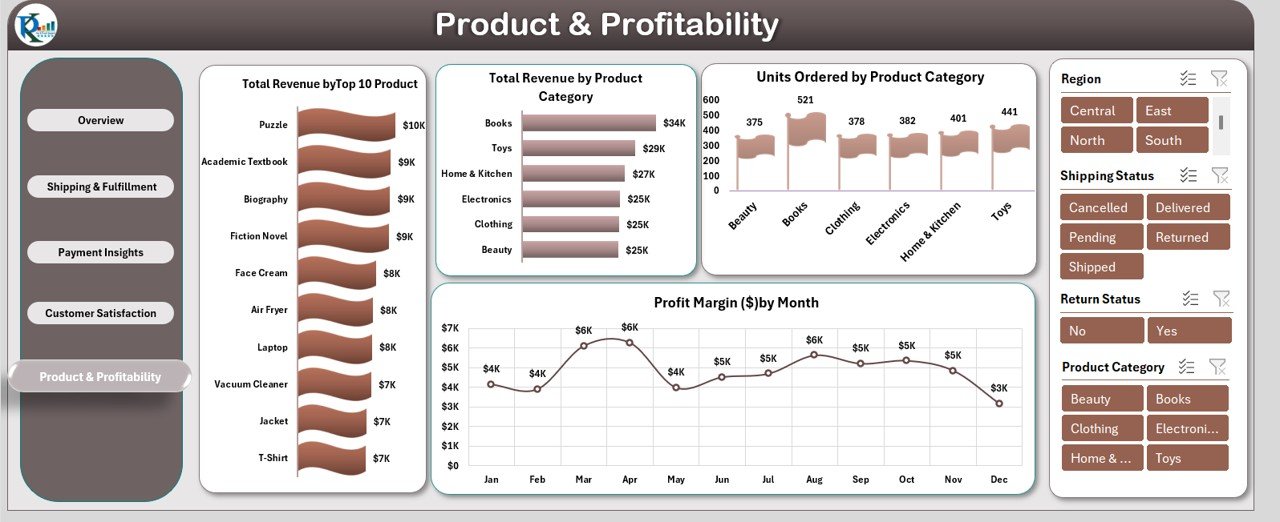
Product & Profitability Sheet: Monitor the performance and profitability of individual products, helping you identify top-sellers.
📈 Customizable Visualizations
The dashboard includes charts and graphs that visualize your data, making trends and patterns easy to understand at a glance. Whether you want to track total revenue by region, or analyze units sold by category, the visualizations bring your data to life.
What’s Inside the E-commerce Dashboard in Excel
📋 Comprehensive Dashboard Sheets
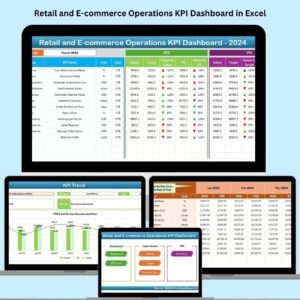
The template includes multiple sheets that track various key aspects of your e-commerce operations, from revenue and sales to customer satisfaction and payment methods. Each sheet is designed to help you visualize and analyze data efficiently.
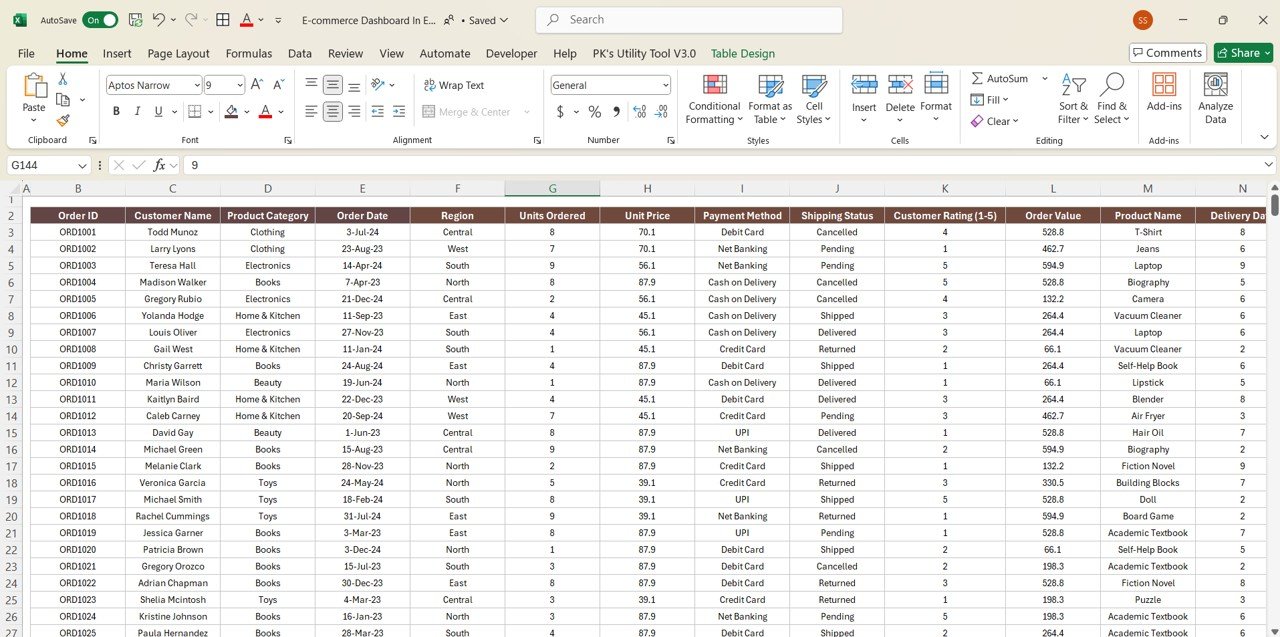
📅 Detailed Data Entries
Input raw data like order IDs, customer names, product categories, and payment methods into the Data Sheet, and watch as the dashboard auto-updates your key metrics and visualizations.
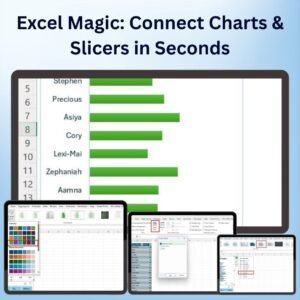
🔄 Slicers and Filters
Use slicers to filter your data by time period, region, product category, and other criteria to analyze different subsets of data.
How to Use the E-commerce Dashboard in Excel
1️⃣ Download and Open the Template
Download the E-commerce Dashboard in Excel and open it in Excel.
2️⃣ Input Your Data
Enter data into the Data Sheet (order ID, product category, units sold, etc.). This will automatically update all charts and KPIs on the dashboard.
3️⃣ Analyze Key Metrics
Use the Overview Sheet to view your overall business performance, including total revenue, profit margin, and total units sold.
4️⃣ Track Performance Trends
Use the KPI Trend Sheets to track your business’s performance over time, identifying trends in sales, revenue, and customer satisfaction.
5️⃣ Monitor Shipping and Fulfillment
Evaluate your shipping and fulfillment performance through the Shipping & Fulfillment Sheet, analyzing return rates, delivery times, and more.
Who Can Benefit from This E-commerce Dashboard in Excel
🛍️ E-commerce Business Owners
Track all your key performance metrics, from revenue to shipping performance, in one place. Whether you run a small store or a large operation, this dashboard is designed to meet your needs.
📈 Data Analysts
Simplify the process of tracking and analyzing e-commerce data. With visualizations, slicers, and charts, this dashboard makes it easy to generate insights from your business’s performance.
💼 Marketing Teams
Track performance metrics like customer satisfaction and payment method distribution to optimize your marketing strategies.
🧑💻 Sales Managers
Monitor sales performance by region, product category, and time period to optimize your sales strategy.
Click here to read the Detailed blog post
Watch the step-by-step video Demo:


Reviews
There are no reviews yet.