Inclusion isn’t just a policy—it’s a performance metric. The Diversity and Inclusion KPI Dashboard in Google Sheets gives you a comprehensive, data-driven, and visual way to track your D&I efforts across the organization.Diversity and Inclusion KPI Dashboard in Google Sheets
From gender and ethnic diversity to inclusion scores and engagement trends, this dashboard equips your HR and leadership teams with actionable insights to foster a more inclusive and equitable workplace. Whether you’re setting monthly goals or reviewing annual trends, this template lets you monitor MTD, YTD, and YOY performance with ease.Diversity and Inclusion KPI Dashboard in Google Sheets
🔑 Key Features of the Diversity and Inclusion KPI Dashboard
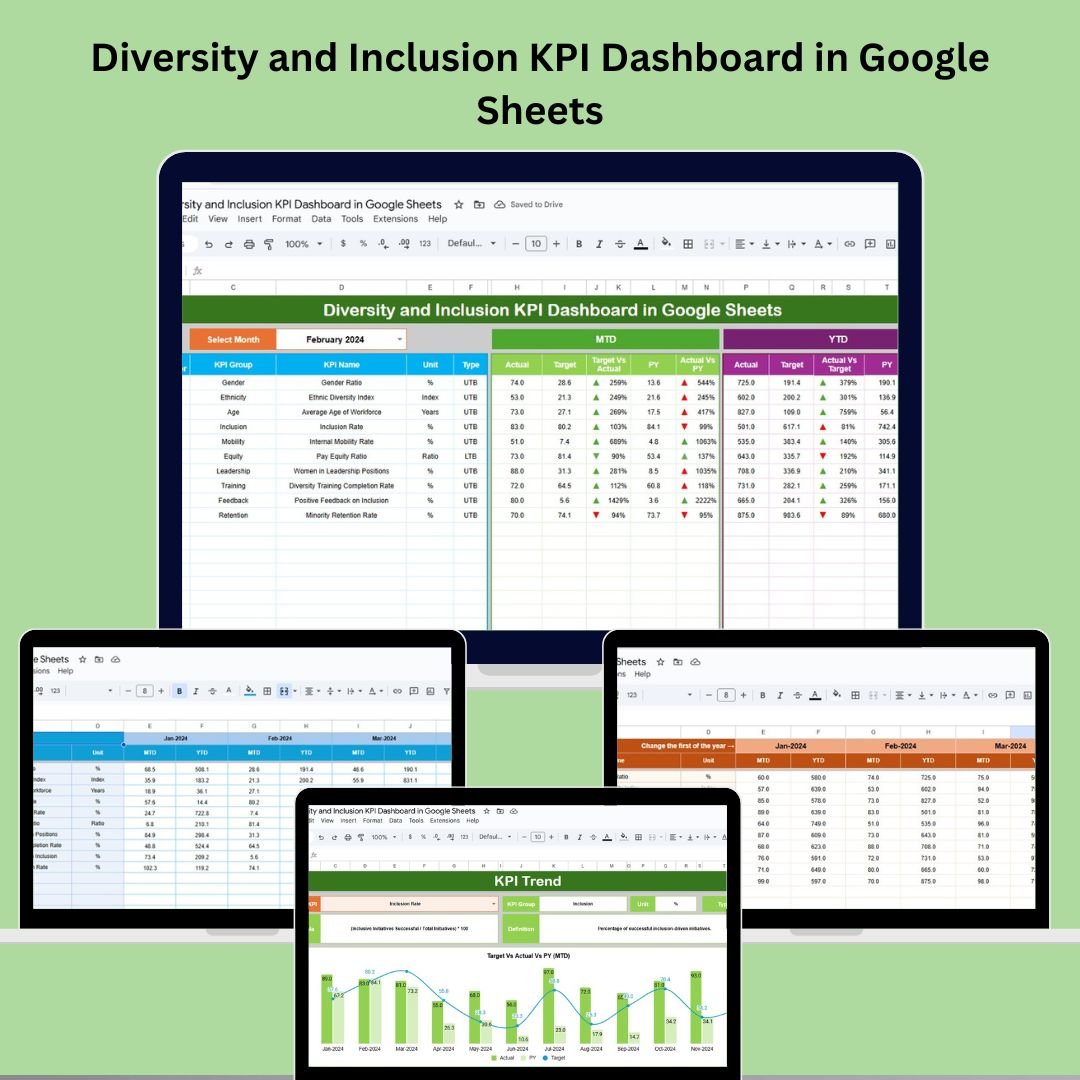
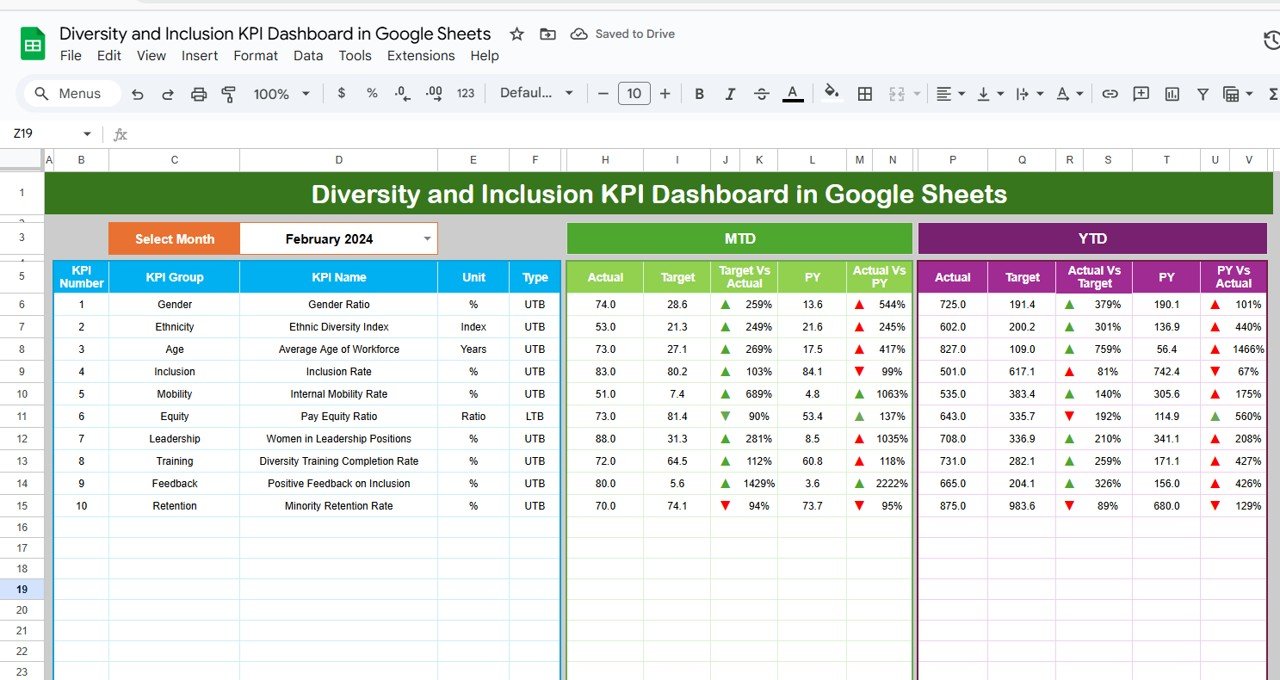
📊 1) Dashboard Sheet Tab – The Command Center
Track core KPIs like:
-
✅ MTD Actual, Target, and Previous Year comparisons
-
✅ YTD metrics with trend arrows (▲▼) showing progress
-
✅ Target vs. Actual and PY vs. Actual indicators
Gain quick insights at a glance to see where you stand.
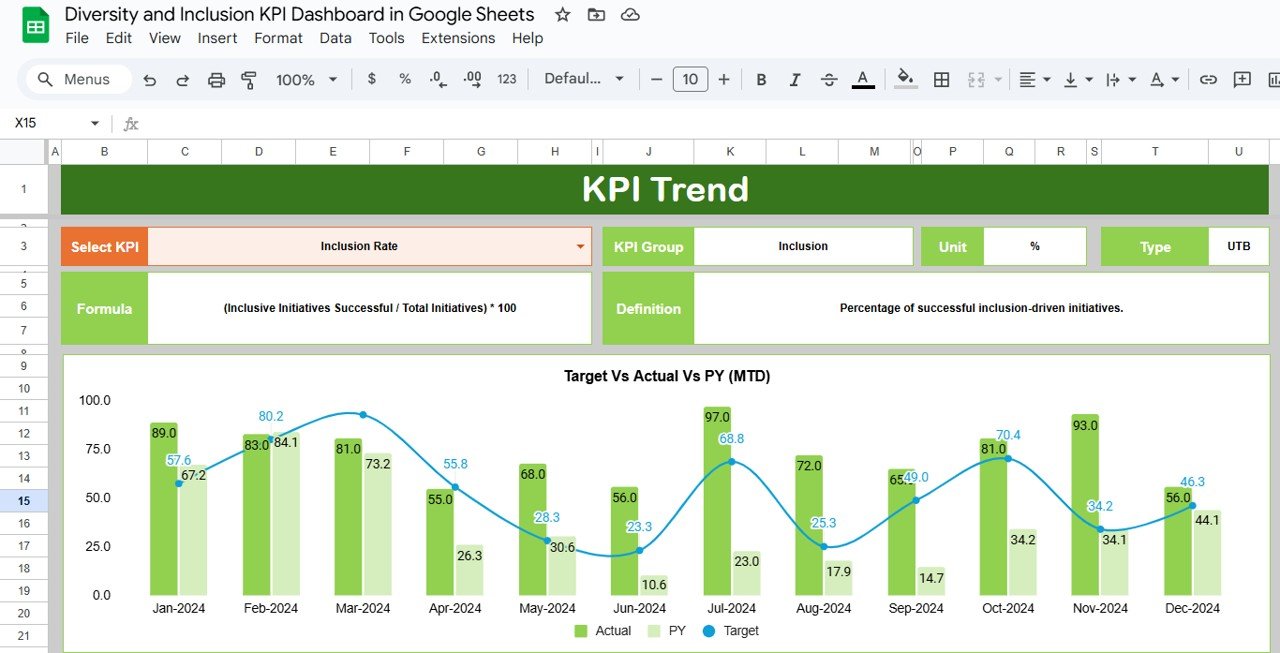
📈 2) KPI Trend Sheet Tab – Focused KPI Analysis
-
📌 Select a KPI from dropdown (C3)
-
📂 View KPI Group, Unit, Formula, Type (UTB/LTB), and Definition
Perfect for deep dives into specific D&I performance metrics.
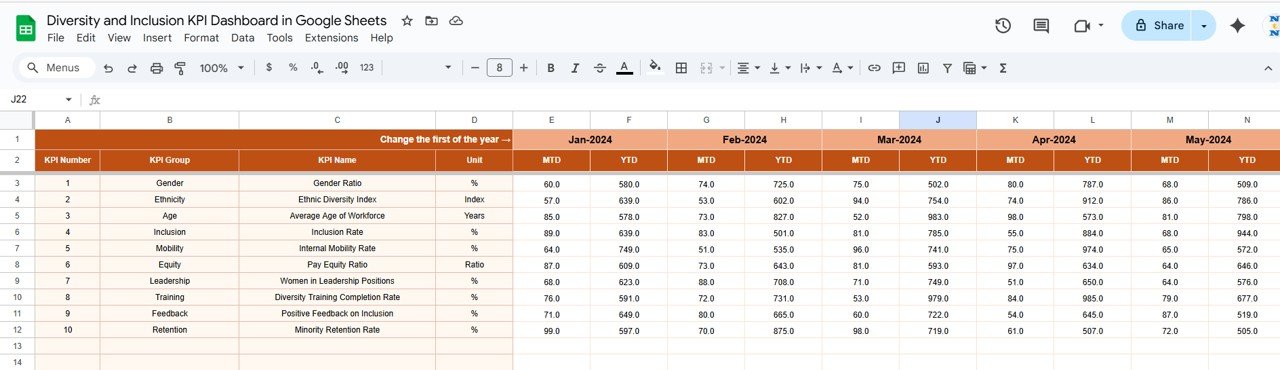
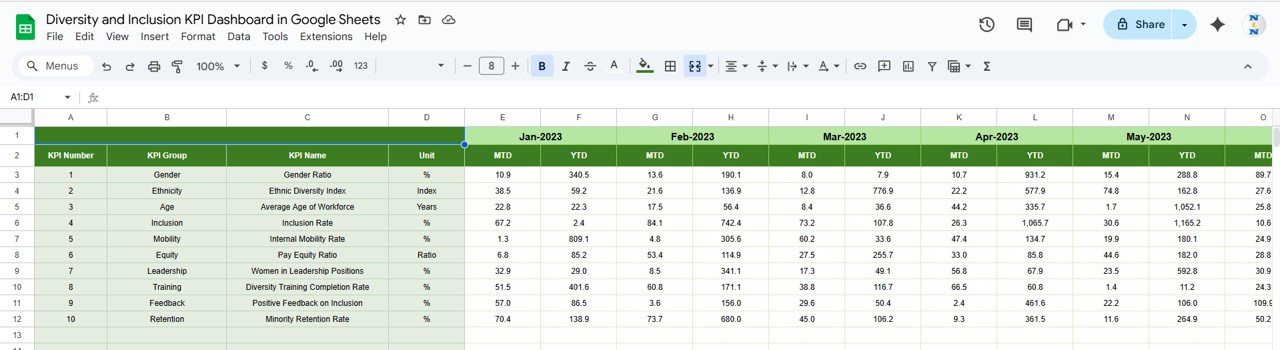
🧾 3) Actual Number Sheet Tab – Real-Time Data Entry
-
🗓️ Change month in cell E1
-
✍️ Enter monthly MTD & YTD values
Auto-updates your dashboard visuals for real-time tracking.
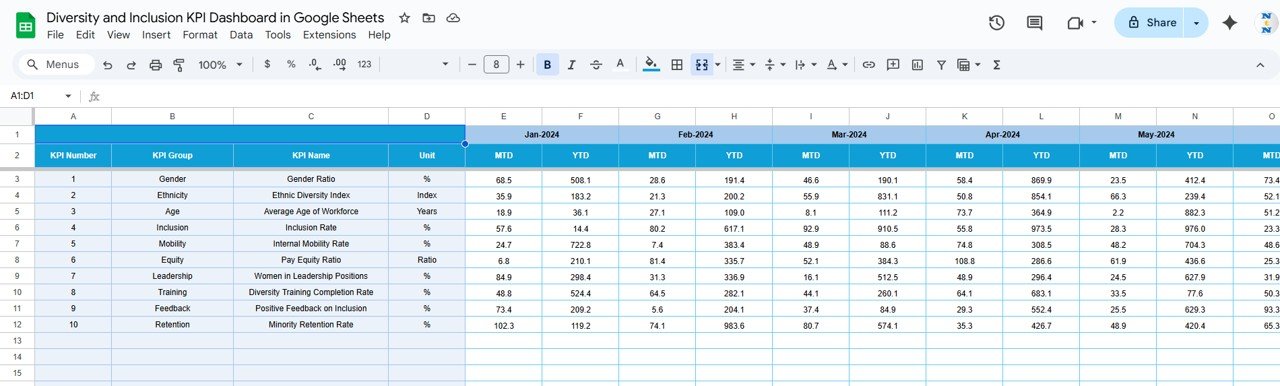
🎯 4) Target Sheet Tab – Set Your D&I Goals
-
Enter monthly and YTD targets for each KPI
-
Align teams with clear D&I benchmarks
📅 5) Previous Year Sheet Tab – Track YOY Progress
-
📊 Enter past year’s values to see growth or gaps year over year
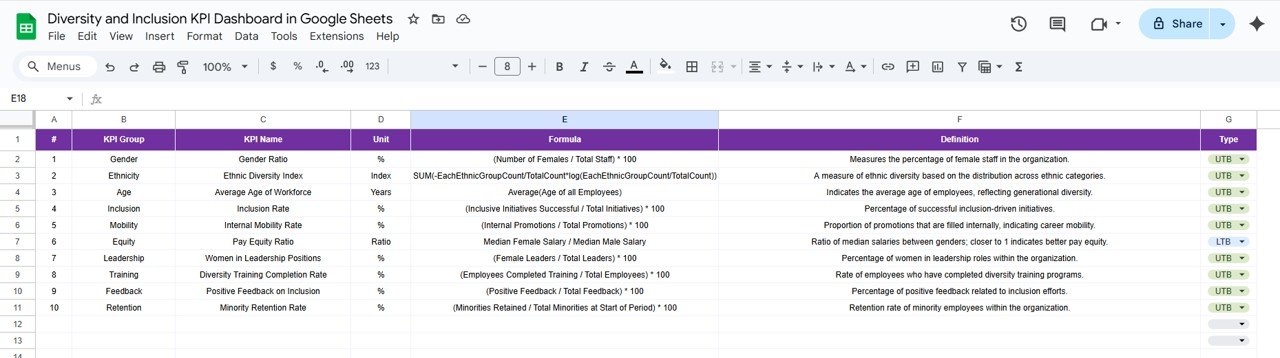
📝 6) KPI Definition Sheet Tab – Clarity & Consistency
Each KPI includes:
-
KPI Name
-
KPI Group
-
Unit
-
Formula
-
Brief Definition
Ensure every stakeholder understands what each metric means.
👥 Who Is It For?
-
🔹 HR Teams & D&I Officers – Monitor program success
-
🔹 Executives & Leaders – Make informed strategic decisions
-
🔹 DEI Consultants – Showcase performance to clients
-
🔹 Small Businesses to Enterprises – Scalable for all org sizes
🚀 Benefits of Using This Dashboard
-
✅ Real-Time Updates – Dashboard changes as you enter new data
-
✅ Visual Comparisons – Easy-to-understand arrows and cards
-
✅ Flexible & Customizable – Tailor KPIs and layout as needed
-
✅ Year-over-Year Tracking – Monitor sustained progress
-
✅ Collaborative in Google Sheets – Share and work together seamlessly
💼 Best Practices
-
🔁 Update data monthly or quarterly
-
🎯 Set realistic KPI targets
-
📉 Track improvement areas using trend views
-
📂 Organize KPIs by group (Gender, Ethnicity, etc.)
-
👥 Involve your leadership and HR teams in reviews


Reviews
There are no reviews yet.