

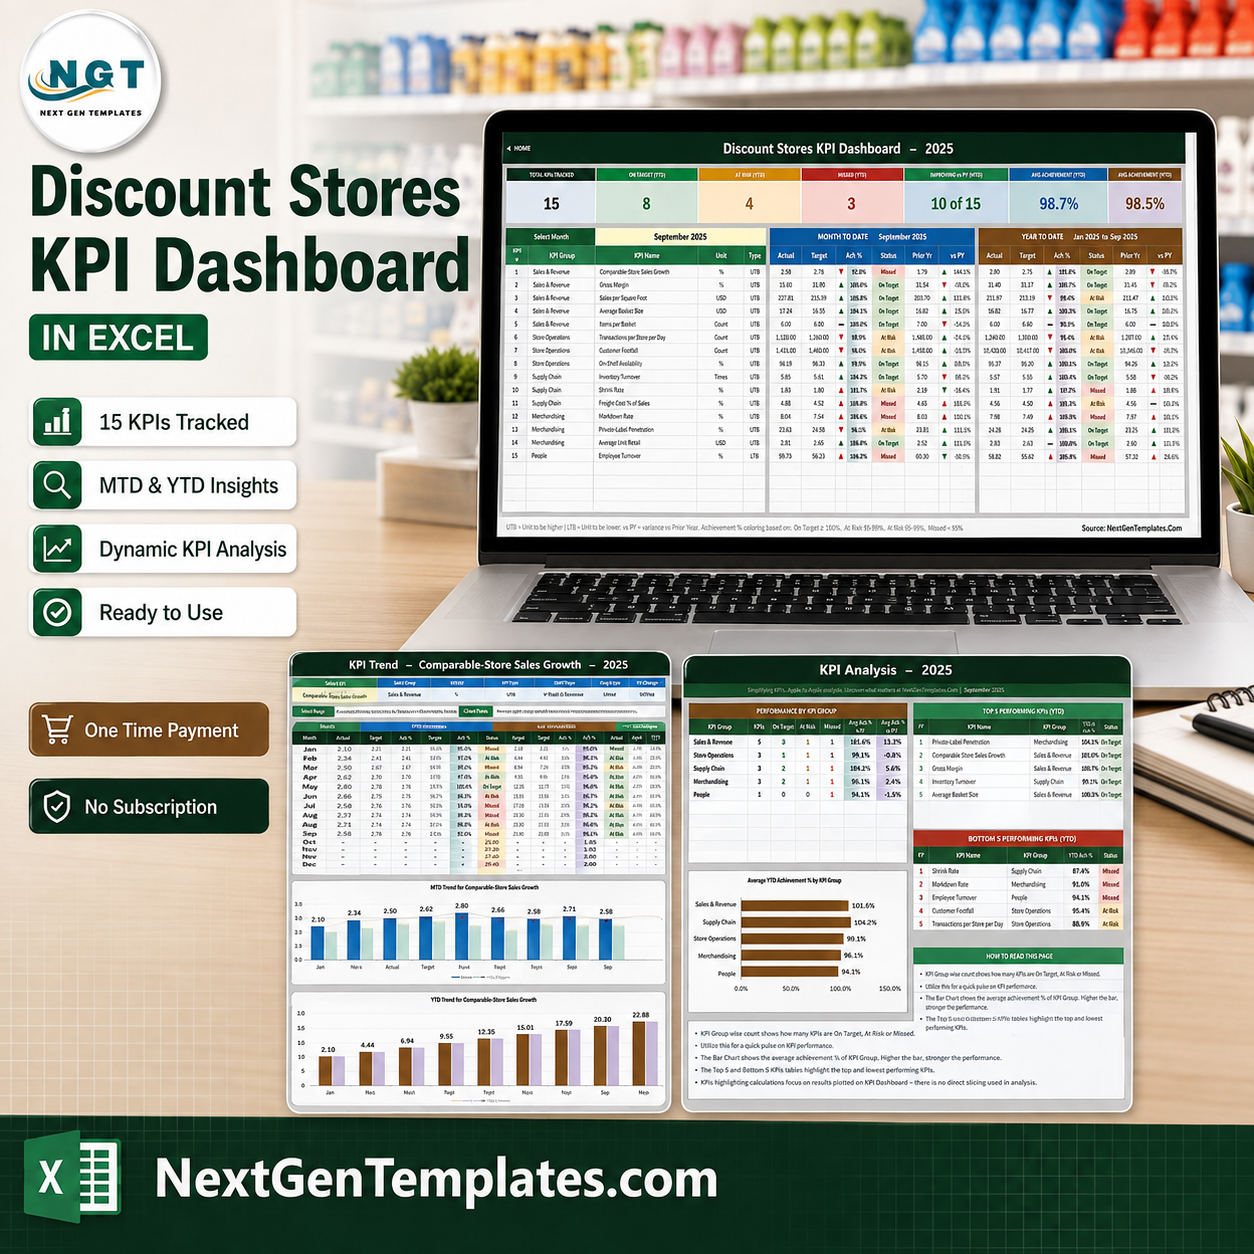

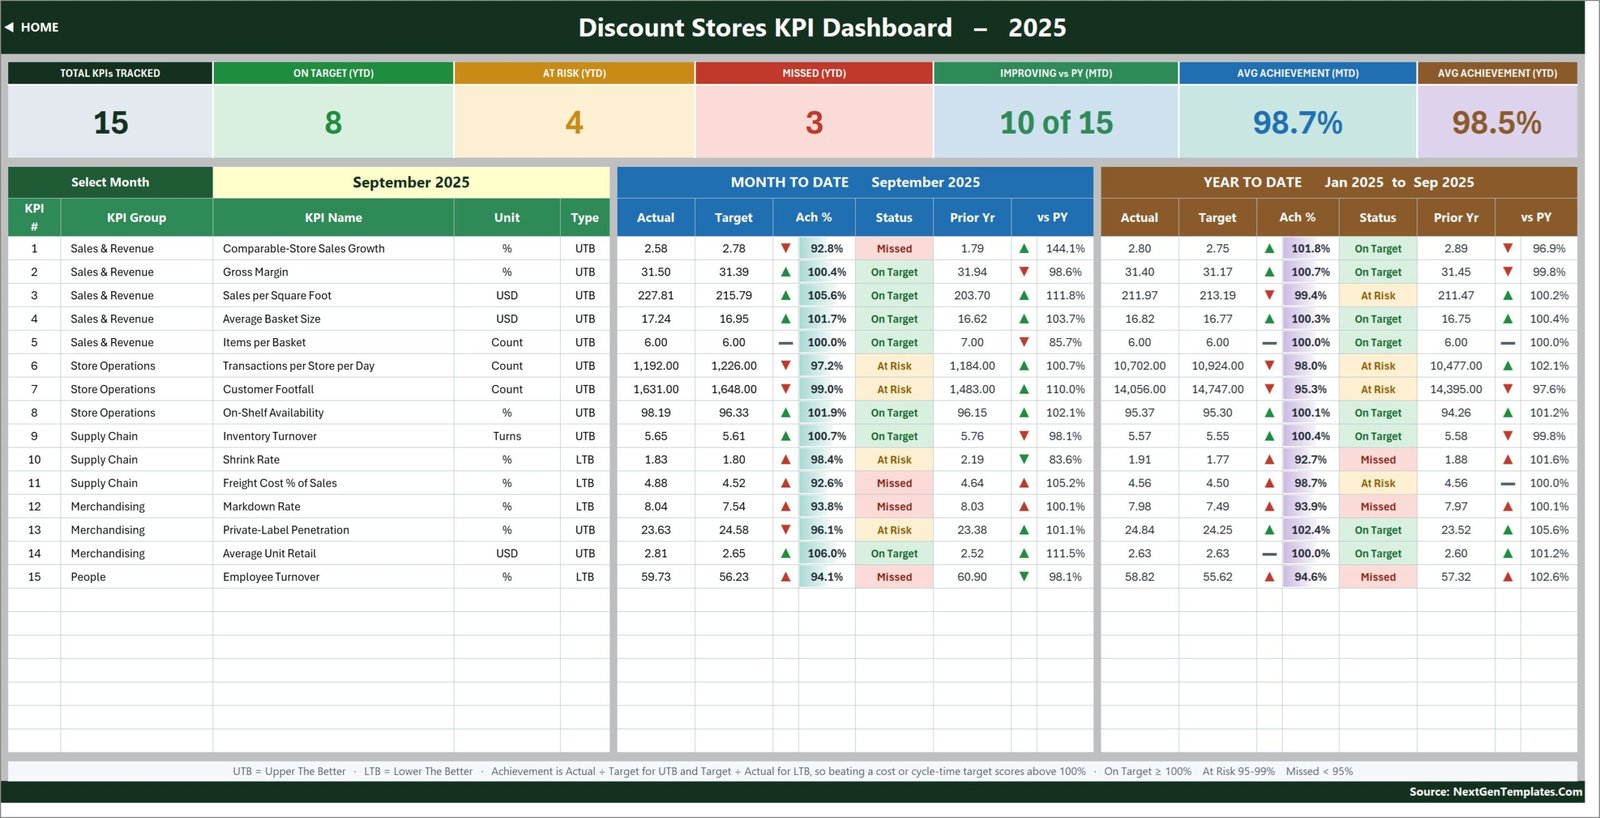
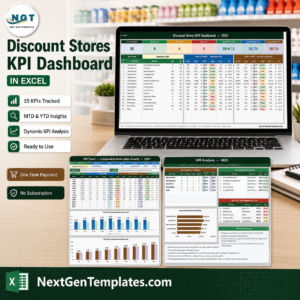
The Discount Stores KPI Dashboard in Excel is a month-picker KPI scorecard for value, variety and dollar-store retail chains. Pick a month from one dropdown and 15 KPIs across five groups report their MTD and YTD actual, target, achievement percentage, traffic-light status, prior-year comparator and year-on-year movement at once. The sample file ships a full 2025 reporting year with September 2025 selected: 8 KPIs On Target, 4 At Risk and 3 Missed on a year-to-date basis, 10 of 15 improving versus prior year, and average achievement of 98.7% MTD / 98.5% YTD. Every number on every page is a plain worksheet formula – VLOOKUP, MATCH, INDEX and COUNTIF. No macros, no Power Query, no data model, no add-in. It opens in Excel 2013 and later and in Excel for the web. One-time payment, lifetime access to the file, and nothing in the workbook is locked, hidden or password-protected. Discount Stores KPI Dashboard in Excel
Key Features of the Discount Stores KPI Dashboard in Excel
- One month dropdown drives the whole scorecard. Cell D6 on the KPI Dashboard sheet lists the twelve months of the reporting year. Change it and the scorecard, the seven summary cards and the entire KPI Analysis page recalculate. There is no refresh button and no query to run.
- 15 discount-retail KPIs in five groups. Sales & Revenue (5), Store Operations (3), Supply Chain (3), Merchandising (3) and People (1) – including Comparable-Store Sales Growth, Gross Margin, Sales per Square Foot, Average Basket Size, Items per Basket, Transactions per Store per Day, Customer Footfall, On-Shelf Availability, Inventory Turnover, Shrink Rate, Freight Cost % of Sales, Markdown Rate, Private-Label Penetration, Average Unit Retail and Employee Turnover.
- Direction-aware scoring for cost KPIs. Each KPI is flagged UTB (Upper The Better) or LTB (Lower The Better). Achievement is Actual ÷ Target for a UTB KPI and Target ÷ Actual for an LTB one, so beating a Shrink Rate, Markdown Rate, Freight Cost or Employee Turnover target scores above 100% instead of reading as a miss. Four of the 15 KPIs here are LTB.
- Editable traffic-light thresholds. On Target from 100%, At Risk from 95% to 99%, Missed below 95%. The thresholds live in the formulas in columns L and U of the KPI Dashboard sheet, so you can move them to match your own governance instead of accepting ours.
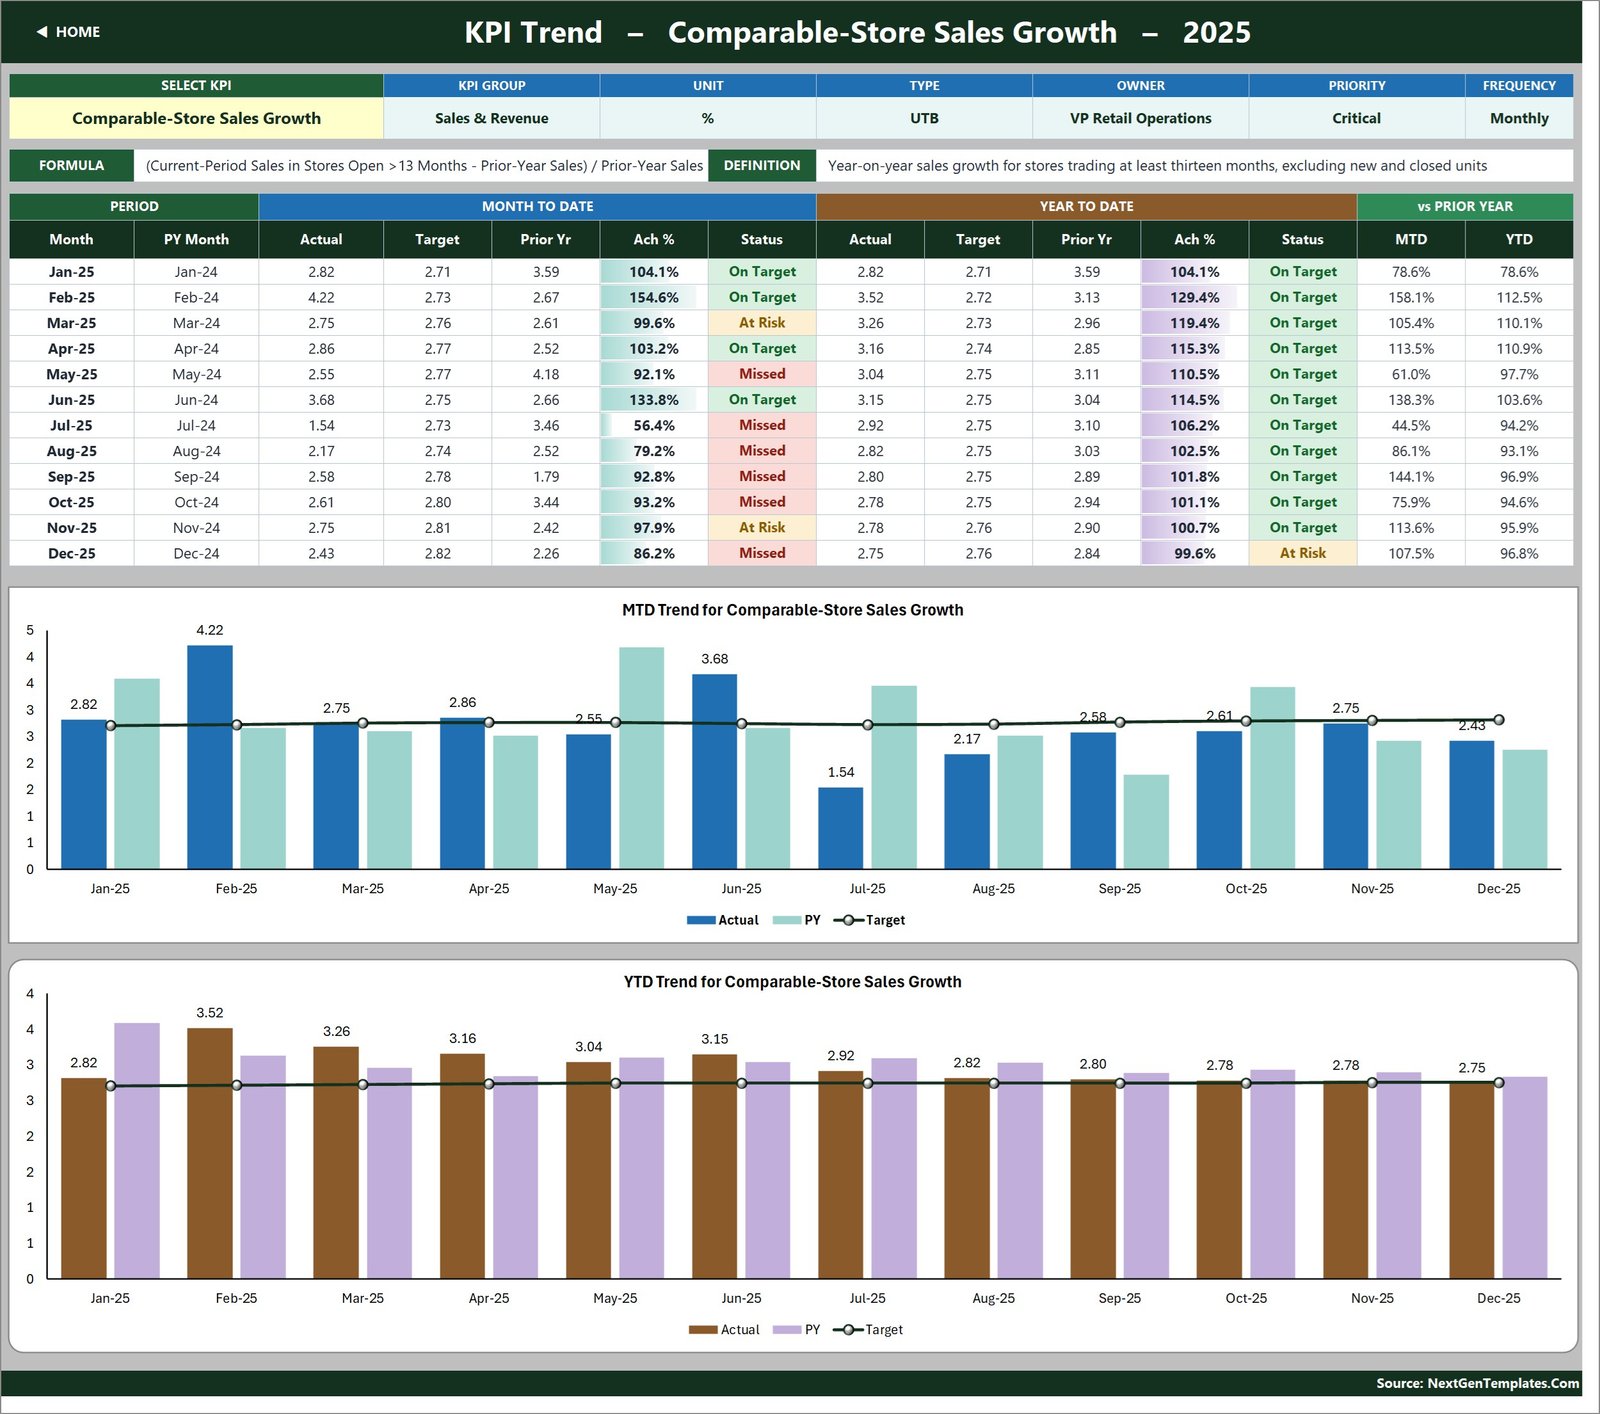
- A KPI Trend page for any single KPI. Pick a KPI from the dropdown in cell B4 and the attribute strip, the formula and definition, a twelve-month table and two combo charts all follow it – actual and prior-year columns against a target line, one chart for MTD and one for YTD.
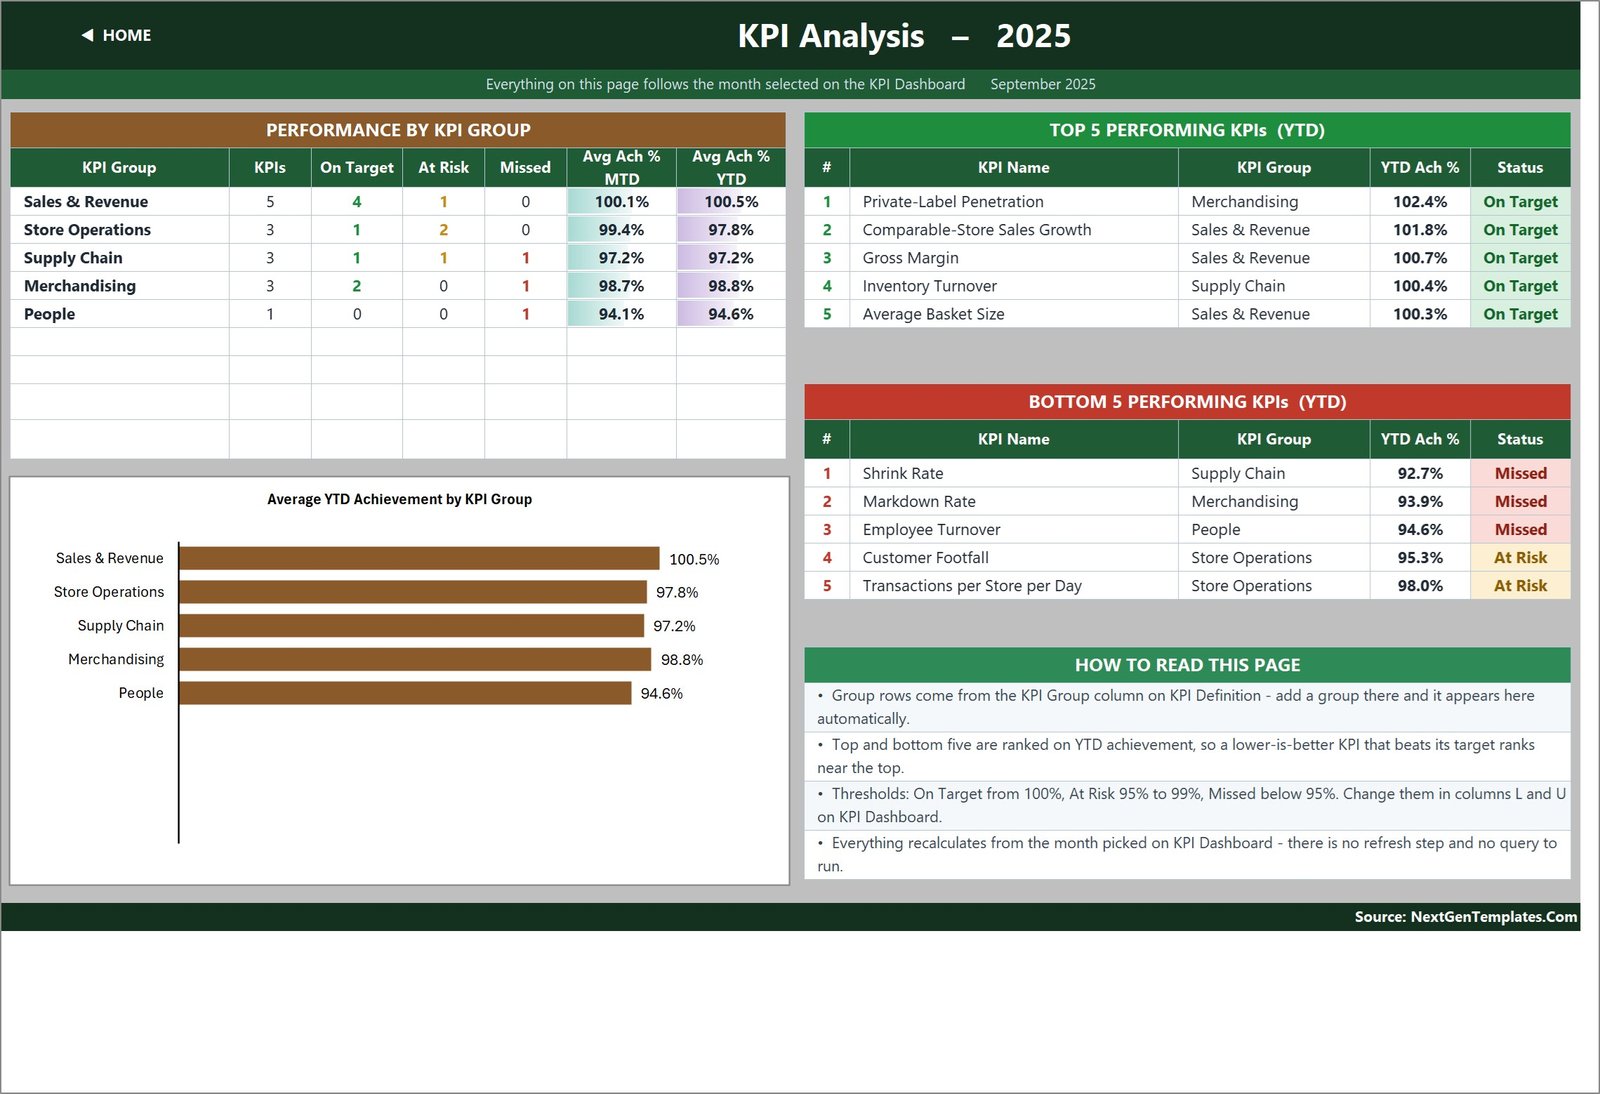
- A KPI Analysis page that rolls up by group. Achievement averaged by KPI group with a bar chart, plus Top 5 and Bottom 5 performing KPIs ranked on year-to-date achievement, so an LTB KPI that beats its target ranks near the top rather than the bottom.
- Add or rename a KPI without touching a formula. The three input sheets, the scorecard, the trend page and the analysis page all read the KPI list from the KPI Definition sheet. Type a new KPI there and it flows through everything. The sheets are wired for 22 KPI rows, so there are seven live empty rows waiting.
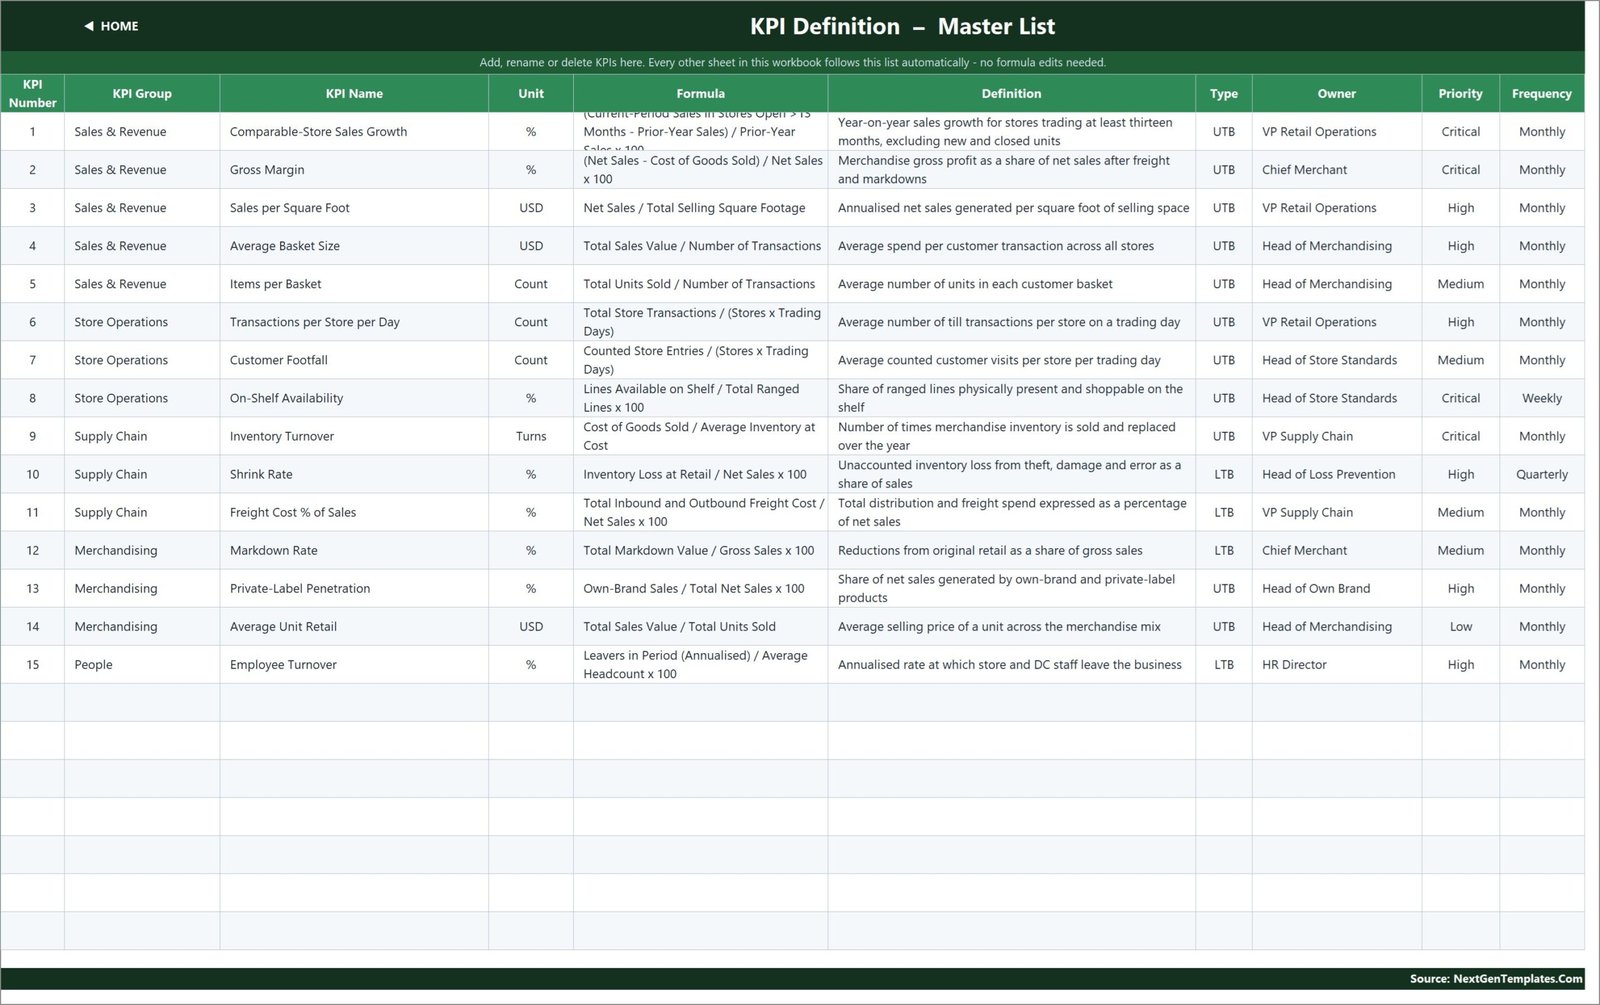
- Full KPI governance metadata. Every KPI carries a written formula, a plain-English definition, an owner (VP Retail Operations, Chief Merchant, Head of Merchandising, Head of Store Standards, VP Supply Chain, Head of Loss Prevention, Head of Own Brand, HR Director), a priority (Critical / High / Medium / Low) and a reporting frequency.
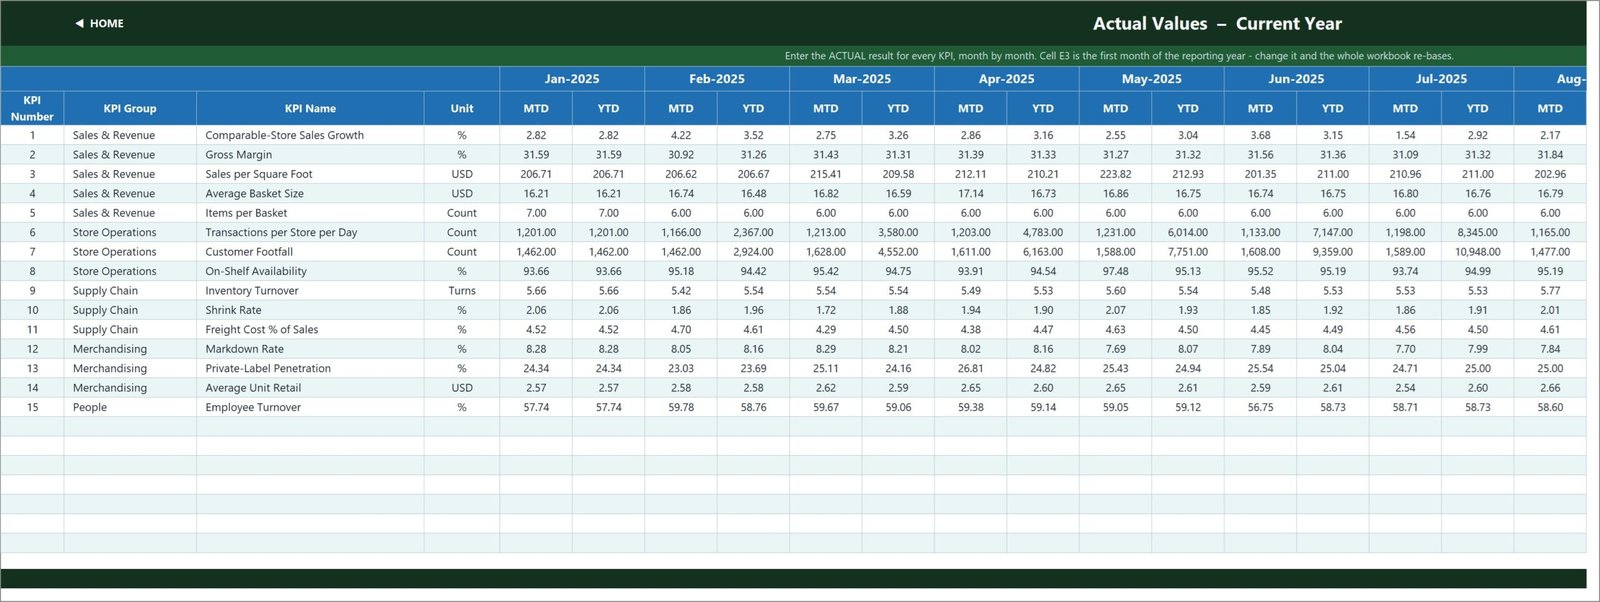
- Re-base the reporting year in one cell. Cell E3 on the KPI Input – Actual sheet is the first month of the year. Change it and the Target sheet, the Prior Year sheet, the month dropdown and every sheet title move with it.
- A complete sample year included. Twelve months of Actual, Target and Prior Year numbers are already typed in, so you can see every card, chart, arrow and colour behaving before you replace a single figure. Discount Stores KPI Dashboard in Excel
What Is Inside the Discount Stores KPI Dashboard in Excel
The download is a ZIP holding two files: Discount Stores KPI Dashboard.xlsx and an Excel-KPI-Dashboard-User-Manual.pdf. The workbook itself has these sheets:
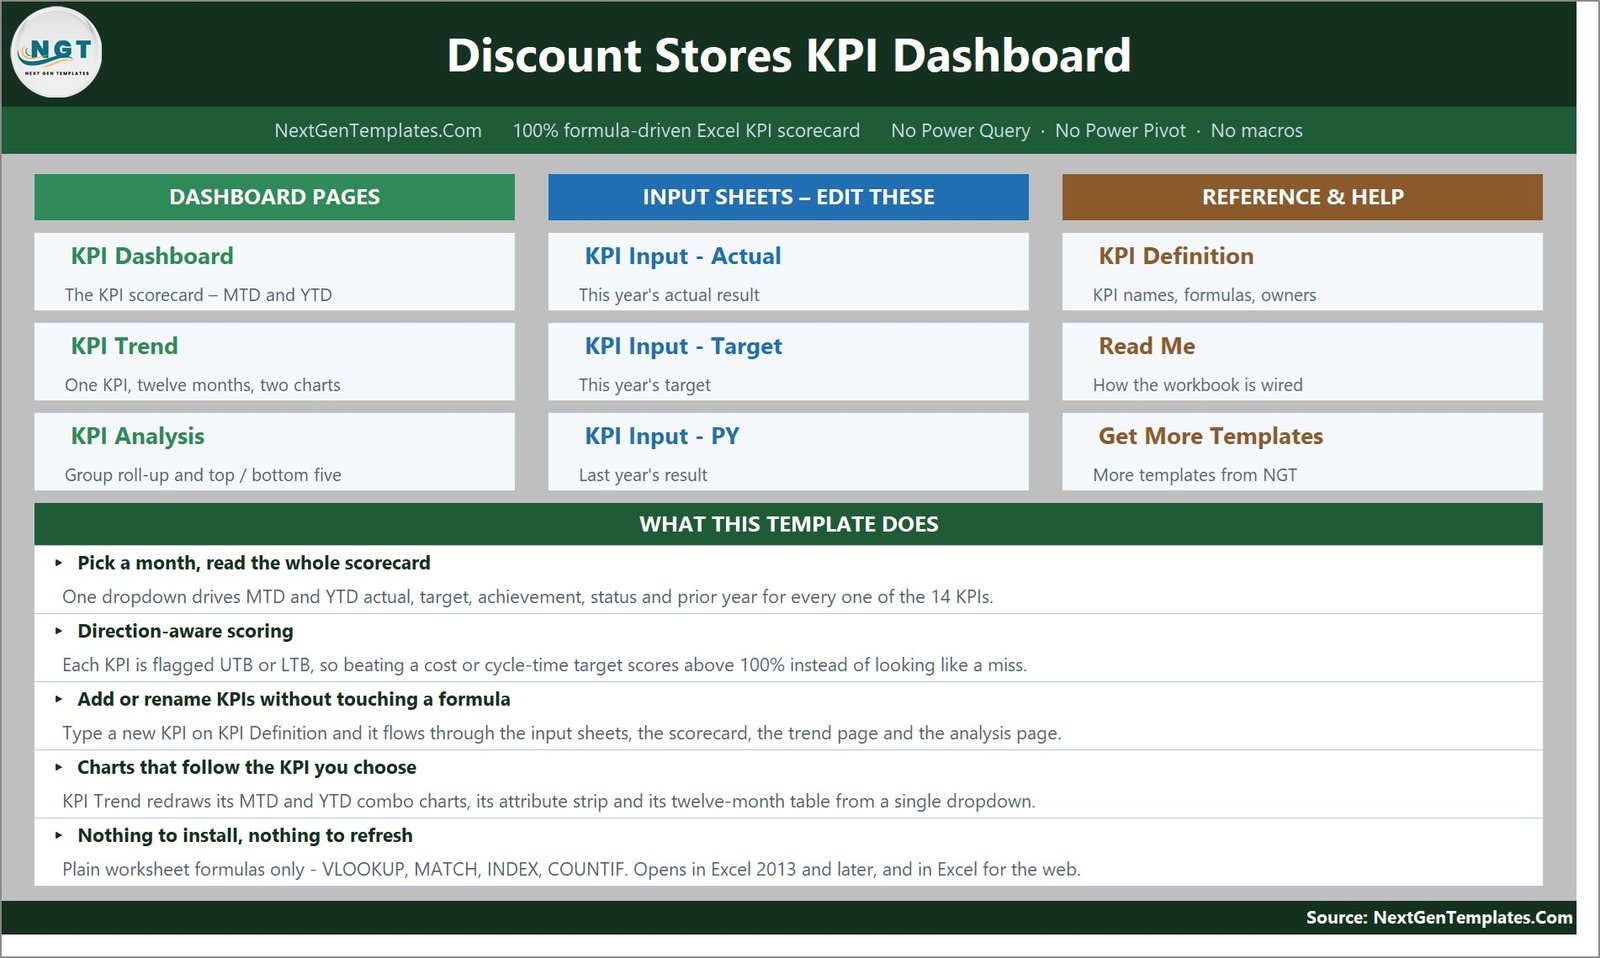
- Home – a navigation page with buttons to every sheet, grouped as Dashboard Pages, Input Sheets and Reference & Help.
- KPI Dashboard – the scorecard. A month dropdown, seven summary cards (Total KPIs Tracked, On Target YTD, At Risk YTD, Missed YTD, Improving vs PY MTD, Avg Achievement MTD, Avg Achievement YTD) and one row per KPI with MTD and YTD blocks each carrying Actual, Target, Achievement %, Status, Prior Yr and vs PY.
- KPI Trend – one KPI at a time, twelve months, two combo charts.
- KPI Analysis – Performance by KPI Group (KPI count, On Target / At Risk / Missed counts, average MTD and YTD achievement), an average-YTD-achievement bar chart by group, and the Top 5 and Bottom 5 tables.
- KPI Input – Actual – this year’s result, an MTD and a YTD column for every month.
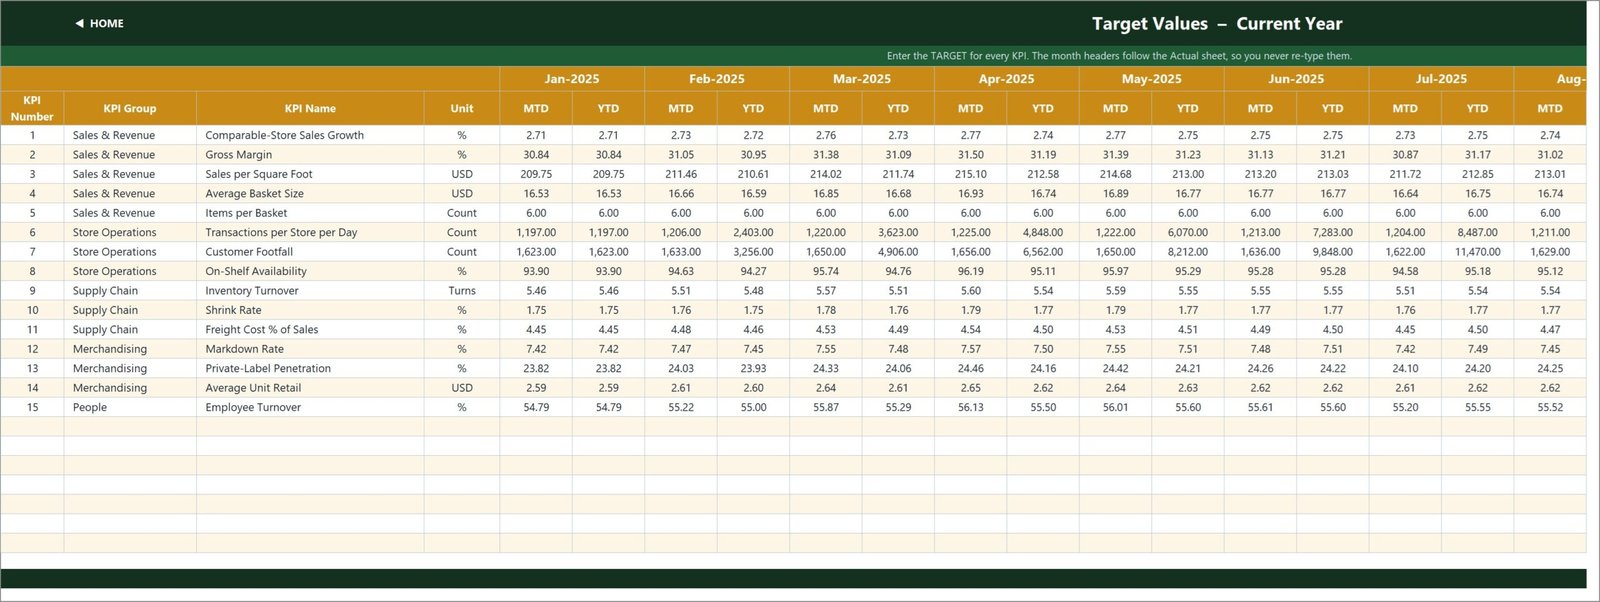
- KPI Input – Target – this year’s target, same layout, month headers inherited from the Actual sheet.
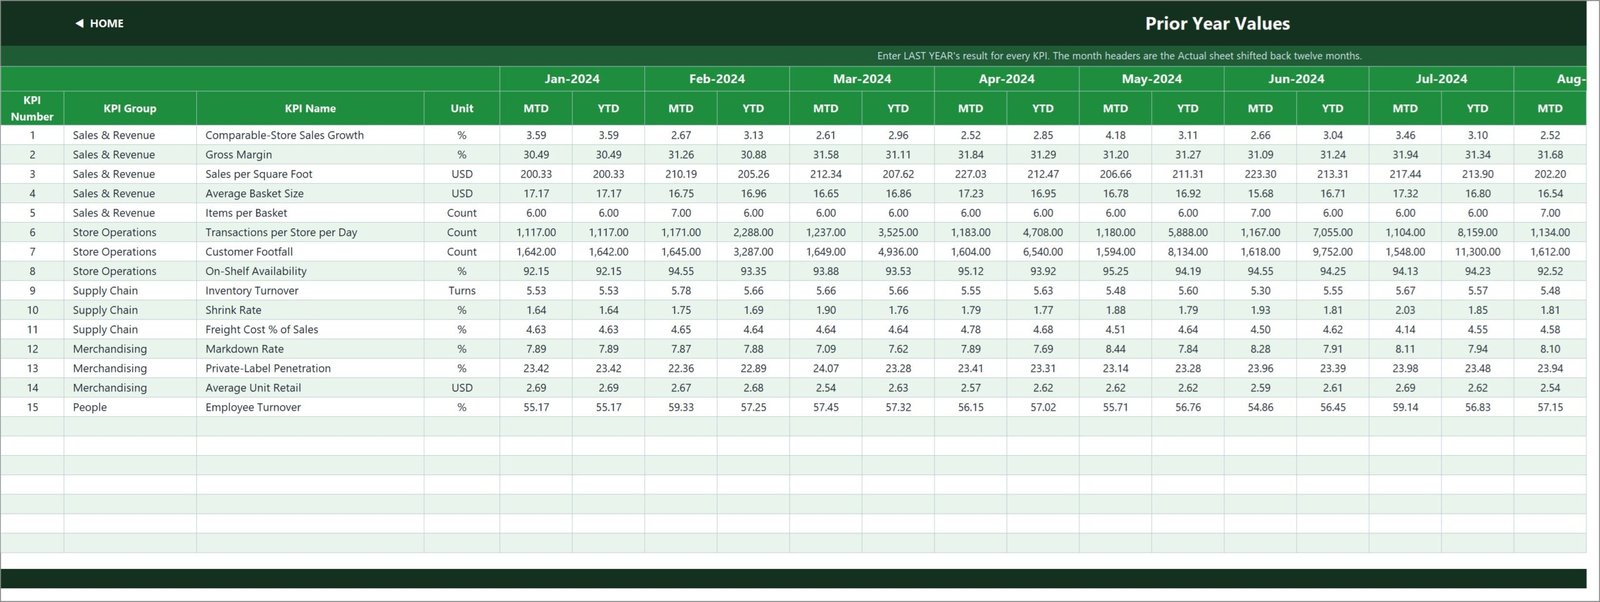
- KPI Input – PY – last year’s result, the Actual sheet shifted back twelve months.
- KPI Definition – the master list: number, group, name, unit, formula, definition, UTB/LTB type, owner, priority and frequency.
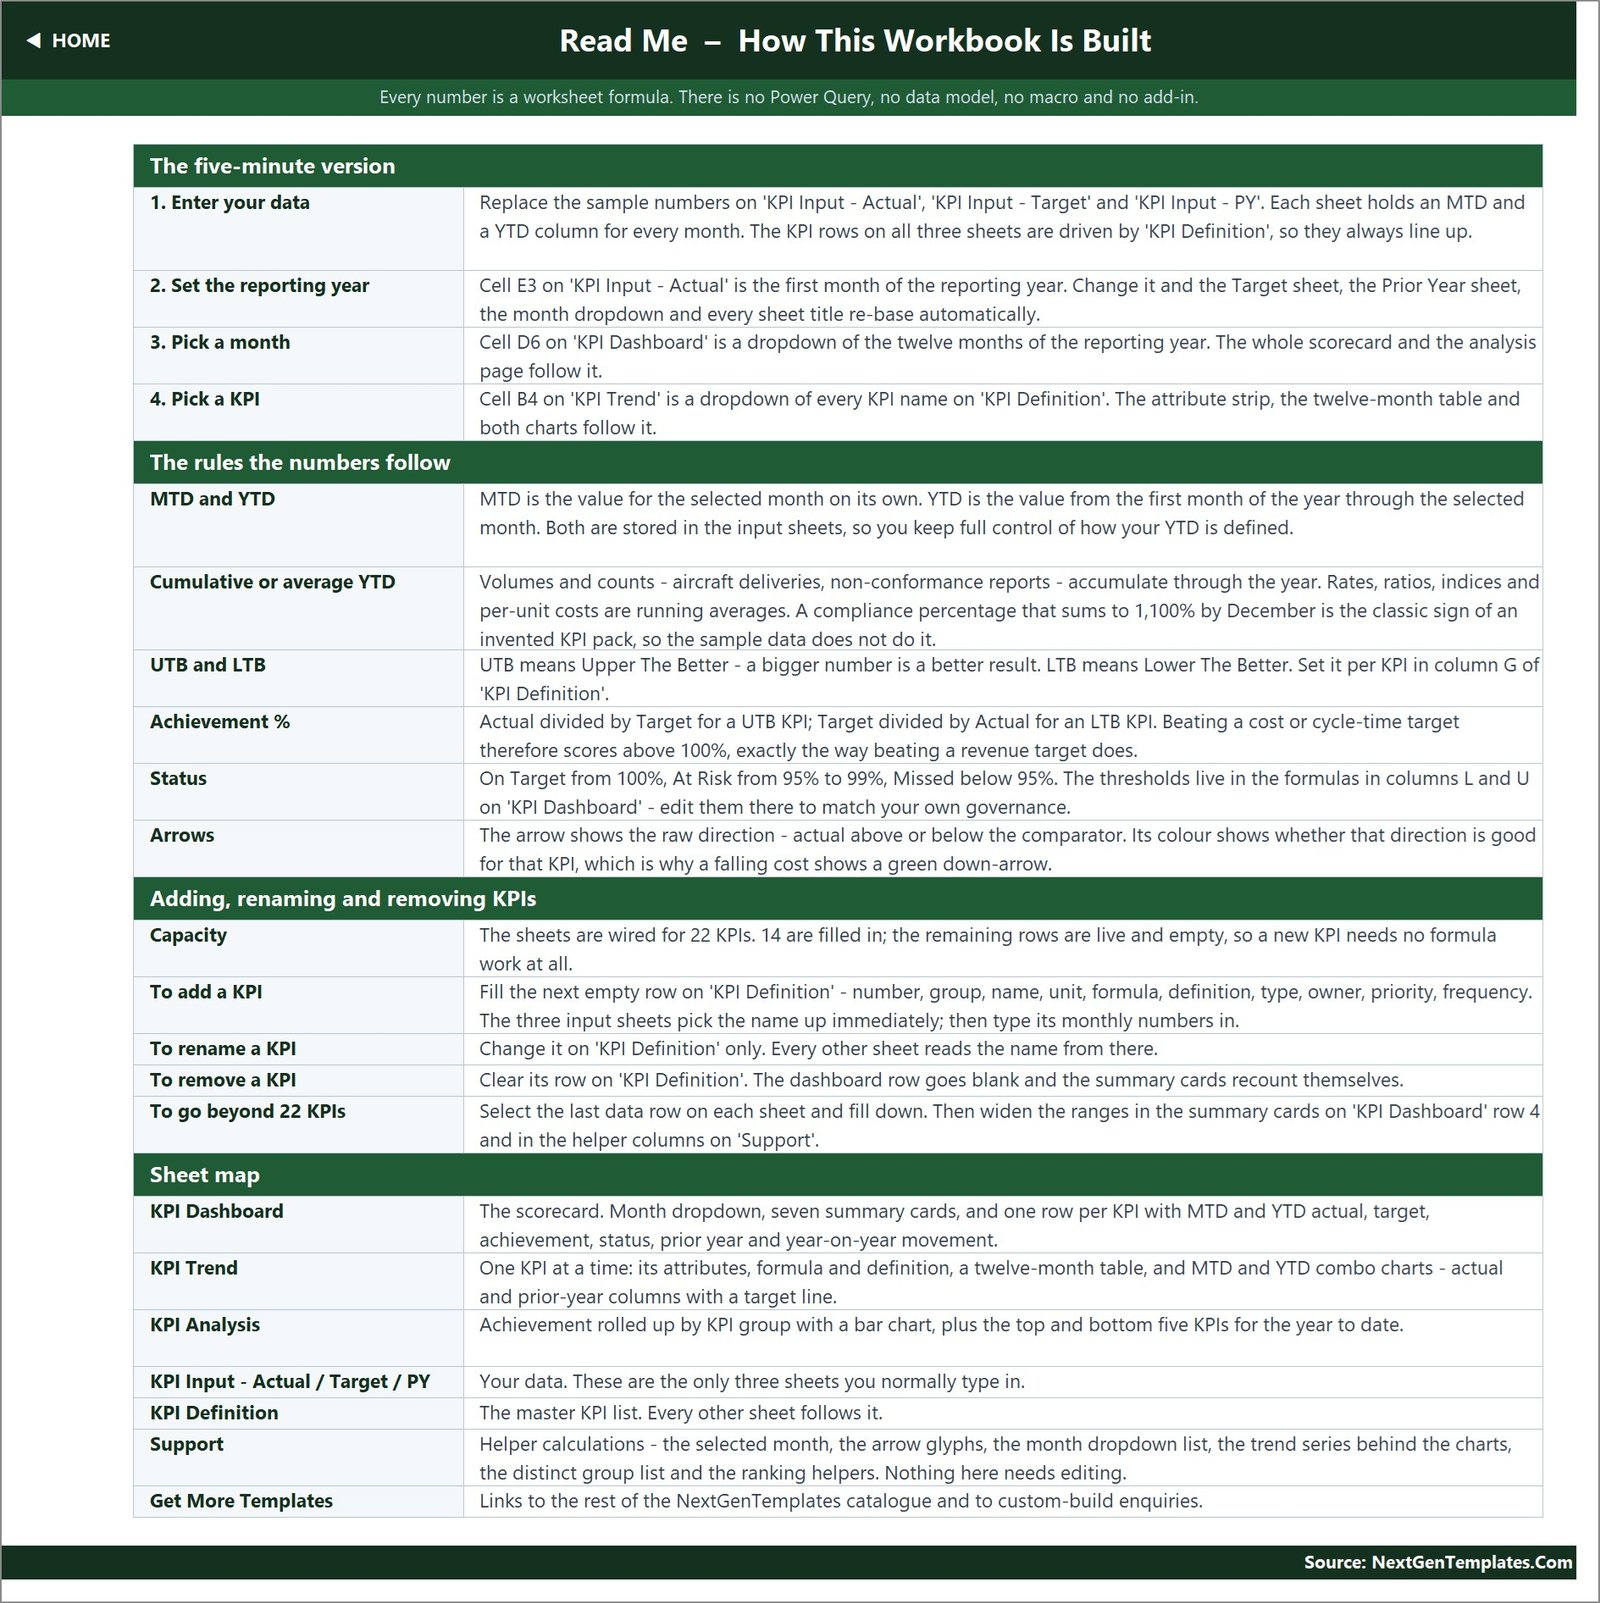
- Read Me – how the workbook is wired, the rules the numbers follow, and how to add, rename or remove a KPI.
- Support – helper calculations (selected month, arrow glyphs, the dropdown list, the chart series, group and ranking helpers). Nothing here needs editing.
- Get More Templates – links to the rest of the NextGenTemplates catalogue.
Discount Stores KPI Dashboard in Excel vs. Google Sheets vs. Paid Retail BI – Where This Fits
| Discount Stores KPI Dashboard in Excel | Google Sheets KPI scorecard | Paid retail BI (NetSuite Analytics / Zoho Analytics tier) | |
|---|---|---|---|
| Cost | One-time 19.99 (12.99 on offer) | Free tool, you build the scorecard yourself | Roughly 30-100+ per user per month |
| Platform | Excel 2013+, Microsoft 365, Excel for the web | Browser | Browser, vendor-hosted |
| Setup time | Minutes – the sample year is already filled in | Days of building | Weeks, usually with an implementation partner |
| Real-time team collaboration | Only via OneDrive / SharePoint co-authoring | Yes, native | Yes |
| Mobile access | Excel mobile app, read-friendly | Yes | Yes |
| Customizable fields | Yes – every formula and label is open and editable | Yes, if you build it | Limited to the vendor’s data model |
| Share with link | Via OneDrive / SharePoint | Yes | Yes |
| Year-1 cost at 5 users | 19.99 once | Your build time | 1,800-6,000+ |
| Connects to your POS automatically | No – you type or paste 15 monthly numbers | No, unless you build the connector | Yes, that is what you are paying for |
| Direction-aware scoring for shrink, markdown and freight | Yes, built in per KPI | You have to write it | Usually configurable |
| Owns your data | You do – the file sits on your machine | You do | Vendor-hosted |
Who This Template Is For – and Who It Is Not For
It is for you if you run or report on a value, variety, dollar-store or discount chain and you already have monthly totals – comp sales, gross margin, footfall, shrink, markdown, private-label share, turnover – sitting in a POS export, a merchandising report or a finance pack, and what you actually lack is a single page that scores them against target with a consistent traffic light and shows whether the year to date is holding up. It is for the operations or merchandising manager who has to walk a board through fifteen numbers in ten minutes, and for the finance analyst who is tired of rebuilding the same conditional formatting every month.
It is not for you if you want the file to read your POS or ERP directly. It does not connect to anything. There is no store-level, SKU-level or transaction-level detail anywhere in the workbook – it holds one number per KPI per month for the whole estate, not a store list you can drill into. It is also not a forecasting or planning model: it compares what you type against the target you type, and it does not project a trend forward. If you need store-by-store ranking or slicer-driven analysis over a transaction table, our analytical Discount Stores Dashboard in Excel is the file you want instead – see the note below on how the two differ. Discount Stores KPI Dashboard in Excel
How to Use the Discount Stores KPI Dashboard in Excel
- Open the workbook and land on Home. Use it to move between the pages while you find your bearings.
- Set your reporting year. Type the first month of your year into cell E3 on KPI Input – Actual. The Target sheet, the Prior Year sheet, the month dropdown and every sheet title re-base automatically.
- Edit the KPI list if you need to. On KPI Definition, rename any of the 15 KPIs, clear a row you do not track, or fill one of the seven empty rows with a KPI of your own. Set its unit, its UTB/LTB type, its owner, priority and frequency there – the rest of the workbook follows.
- Type your numbers into the three input sheets. KPI Input – Actual, KPI Input – Target and KPI Input – PY. Each holds an MTD and a YTD cell per KPI per month. You enter both, deliberately, so you keep control of whether a KPI’s YTD is a cumulative total or a running average.
- Pick a month on the KPI Dashboard. Cell D6. The whole scorecard, the seven cards and the KPI Analysis page follow that one choice.
- Tune the thresholds if your governance differs. On Target from 100%, At Risk 95-99%, Missed below 95% – edit them in the formulas in columns L and U on the KPI Dashboard sheet.
- Investigate one KPI on the KPI Trend page. Pick it in cell B4 and read the twelve-month table plus the MTD and YTD charts against target and prior year.
- Use KPI Analysis for the monthly review. Which group is dragging, which five KPIs are ahead, which five are behind. Discount Stores KPI Dashboard in Excel
Real-World Use Cases
Ritu, Head of Retail Operations at a 90-store value chain. Her monthly operating review used to be a forty-slide deck. She now opens the KPI Dashboard, sets the month, and reads the seven cards aloud: 15 tracked, 8 On Target, 4 At Risk, 3 Missed, 10 of 15 improving on last year. Then she goes to KPI Analysis, sees that People is the weakest group at 94.6% YTD while Sales & Revenue is holding at 100.5%, and spends the meeting on the one group that needs it.
Daniel, Merchandise Planner. He watches four numbers: Markdown Rate, Private-Label Penetration, Average Unit Retail and Gross Margin. On the sample year, Private-Label Penetration is the best performing KPI in the file at 102.4% YTD while Markdown Rate sits at 93.9% and is flagged Missed. Because Markdown Rate is set as LTB, he can see instantly that markdowns are running above plan rather than having to remember which direction is good.
Priya, Loss Prevention Manager. Shrink Rate is her KPI and it is the lowest-ranked in the sample year at 92.7% YTD. She opens KPI Trend, picks Shrink Rate, and gets the twelve-month table with the target line and the prior-year comparator on one page – the evidence she needs to argue for a store-audit budget, and the frequency field on KPI Definition reminds everyone that this one is a quarterly measure, not a monthly one. Discount Stores KPI Dashboard in Excel
Frequently Asked Questions
Does this connect to my POS, ERP or Google Analytics?
No. Nothing in the workbook connects to an external system. You type or paste 15 monthly numbers into three input sheets and the rest of the file calculates from them. That is a deliberate trade: it is why the file opens instantly on any machine with no add-in, no gateway and no credentials, and why there is nothing to break when IT changes something.
How many KPIs does it actually ship with?
Fifteen. Worth flagging honestly: the Home page and the Read Me page both still carry the sentence “14 KPIs” from an earlier revision of this template family. The KPI Definition sheet, the TOTAL KPIs TRACKED card on the scorecard and all three input sheets all show 15, and every calculation counts 15. The two stale sentences are cosmetic text, not a formula fault, and you can edit them in place.
Is the YTD calculated for me from the monthly figures?
No, and this is the single most important thing to understand before you buy. Each input sheet has an MTD column and a YTD column for every month, and you fill both. The workbook does not sum or average your MTD values into the YTD. That is by design – a rate like Gross Margin or Shrink Rate should be a running average across the year, while a volume like Transactions per Store per Day accumulates, and only you know which convention your business uses. The consequence is real, though: you enter two numbers per KPI per month per sheet. Discount Stores KPI Dashboard in Excel
Are the numbers in the file real discount-retail benchmarks?
No. The 2025 sample year is invented demo data whose only job is to make every card, chart and traffic light visible before you replace it. Do not quote a figure from this file in a board pack. Replace all three input sheets with your own numbers.
Does the KPI Analysis page compare groups against prior year?
No. The group roll-up shows KPI count, On Target / At Risk / Missed counts and average achievement for MTD and YTD only. Prior-year comparison lives on the scorecard (the Prior Yr and vs PY columns, MTD and YTD) and on the KPI Trend page (a prior-year series on both charts). If you want a vs-PY column on the group table you would have to add it yourself.
Can I add a sixteenth KPI, or change the traffic-light bands?
Yes to both. The sheets are wired for 22 KPI rows, so seven are live and empty – fill the next row on KPI Definition and the input sheets, the scorecard, the trend picker and the analysis page pick it up with no formula work. To go past 22, select the last data row on each sheet, fill down, and widen the ranges in the summary cards on KPI Dashboard row 4 and in the Support helper columns. The 100% / 95% / below-95% bands are editable in columns L and U on the KPI Dashboard sheet.
Do I need macros, Power Query or a specific Excel version?
None of them. It is an .xlsx of ordinary worksheet formulas – VLOOKUP, MATCH, INDEX and COUNTIF – so there is no security prompt, no data model and no refresh step. It opens in Excel 2013 and later, in Microsoft 365 and in Excel for the web. It is not a macro-enabled file, so there is no automation or button-driven data entry in it.
About the Author
Built by PK – Microsoft Certified Professional with 15+ years of Excel, Google Sheets, and Power BI experience. Founder of NextGenTemplates, reaching 300K+ subscribers across YouTube channels. Every template is hand-built and tested before release. Discount Stores KPI Dashboard in Excel
Explore Related Templates
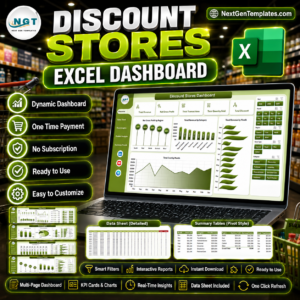
This is the KPI scorecard, not the analytical dashboard. NextGenTemplates ships two different Discount Stores files and they are not versions of each other. This one is a month-picker scorecard: fifteen governed KPIs, targets, traffic lights, a trend page and a group roll-up. The Discount Stores Dashboard in Excel and the Discount Stores Dashboard in Power BI are the analytical line – pivot-and-slicer analysis over a transaction-style dataset, built to answer “which stores, which categories, which months” rather than “did we hit target”. Plenty of teams own one of each.
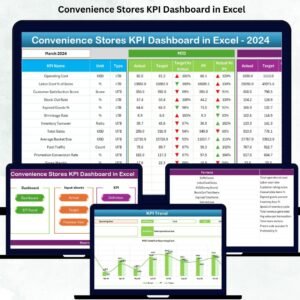
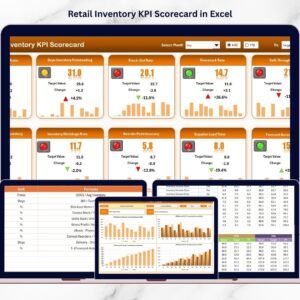
Other scorecards on the same engine: Hypermarkets KPI Dashboard in Excel, Convenience Stores KPI Dashboard in Excel, Grocery Delivery Services KPI Dashboard in Excel, Fast Fashion Brands KPI Dashboard in Excel and Retail Inventory KPI Scorecard in Excel. Discount Stores KPI Dashboard in Excel
Browse the whole family in KPI Dashboards or the wider MS Excel catalogue.
Download the Discount Stores KPI Dashboard in Excel today. One-time payment, no subscription, lifetime access to the file, and a user manual in the ZIP. Replace the sample year with your own numbers and you have a board-ready retail scorecard in an afternoon.
Last updated: 26 August 2026.





























Reviews
There are no reviews yet.