Destination Management Companies (DMCs) operate in a highly dynamic and service-intensive environment. They manage tours, events, transportation, hotels, vendors, budgets, and client expectations—often across multiple destinations. Because operations move fast and involve many stakeholders, tracking performance without a structured system quickly leads to delays, missed insights, and reduced profitability.
That is exactly where the Destination Management Companies KPI Dashboard in Power BI becomes a game-changing performance management solution.
This ready-to-use Power BI KPI Dashboard provides a centralized, visual, and interactive way to track key performance indicators related to destination management operations. Instead of reviewing scattered Excel files or static reports, DMC managers can analyze MTD (Month-to-Date), YTD (Year-to-Date), Target vs Actual, and Previous Year performance from one professional Power BI dashboard.
Because the dashboard uses Excel as the data source and Power BI as the analytics layer, it remains both powerful and user-friendly. Teams simply update Excel sheets, refresh Power BI, and instantly see updated insights—without writing complex formulas or rebuilding reports.
📊 Key Features of Destination Management Companies KPI Dashboard in Power BI
This dashboard is designed specifically for destination management operations and executive reporting.
✔ Centralized KPI monitoring for DMC operations
✔ Interactive Month and KPI Group slicers
✔ Clear MTD and YTD performance tracking
✔ Target vs Actual comparison with visual indicators
✔ Previous Year benchmarking for trend analysis
✔ KPI status icons (▲ / ▼) for instant insights
✔ KPI trend analysis using combo charts
✔ Drill-through KPI definitions for clarity
✔ Excel-based data input (no technical complexity)
📄 Dashboard Pages & Structure
The Destination Management Companies KPI Dashboard in Power BI includes 3 structured analytical pages, each designed for clarity and decision-making.
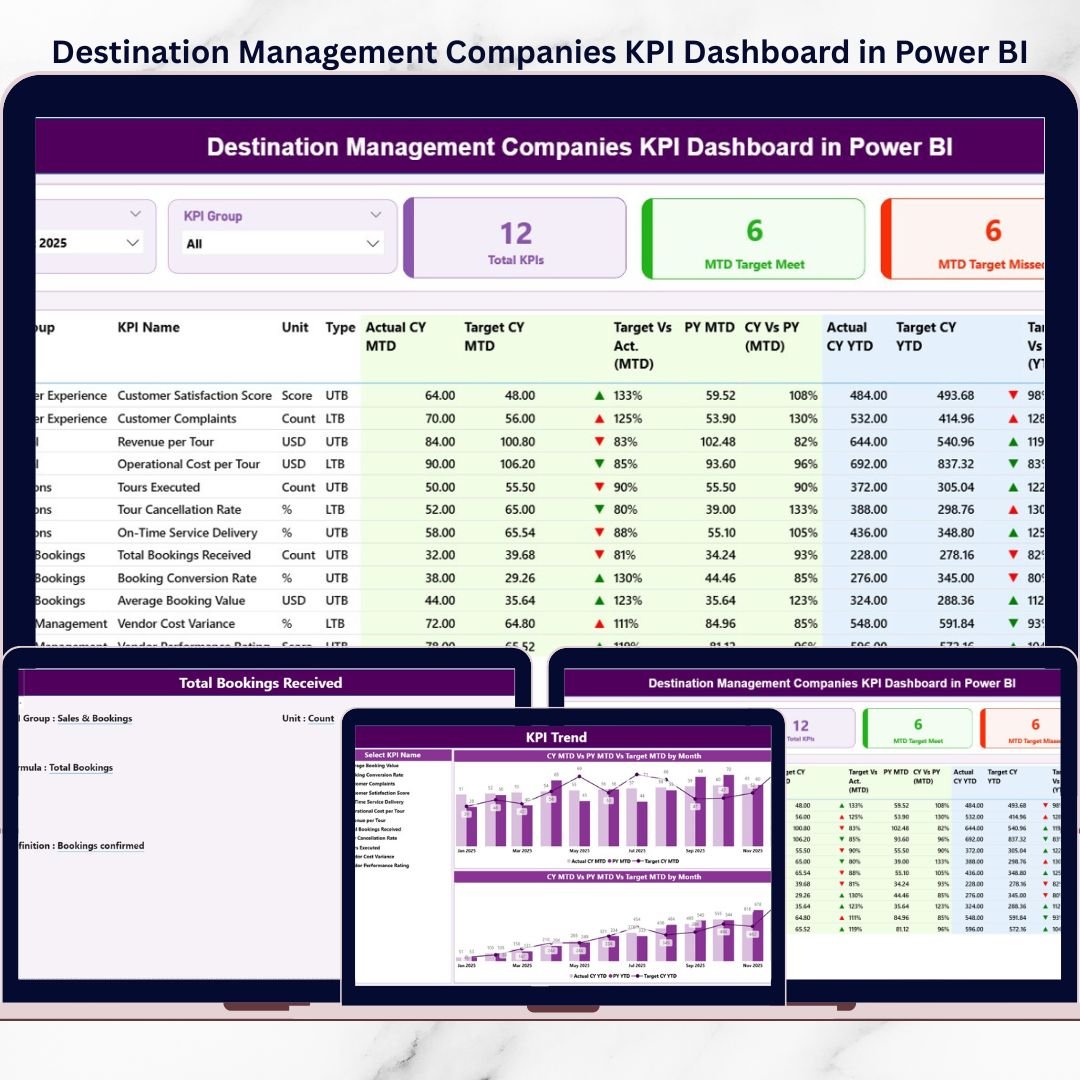
📌 1. Summary Page – Complete KPI Performance Snapshot
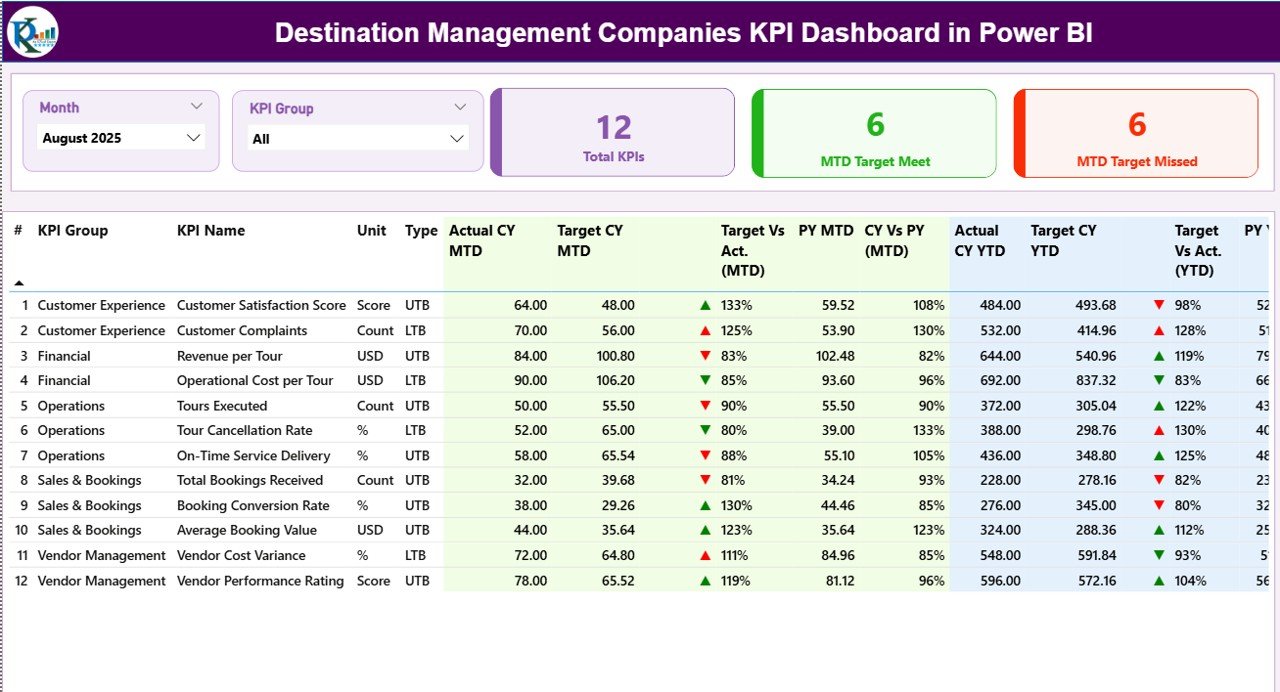
The Summary Page is the main landing page of the dashboard.
What You Can Do on This Page
-
Filter data using Month slicer
-
Filter KPIs using KPI Group slicer
-
Instantly view KPI performance status
KPI Cards Displayed
-
Total KPIs Count
-
MTD Target Meet Count
-
MTD Target Missed Count
Detailed KPI Table Shows
-
KPI Number
-
KPI Group
-
KPI Name
-
Unit
-
KPI Type (LTB / UTB)
-
Actual CY MTD
-
Target CY MTD
-
MTD status icon (▲ / ▼)
-
Target vs Actual (MTD)
-
PY MTD
-
CY vs PY (MTD)
-
Actual CY YTD
-
Target CY YTD
-
YTD status icon
-
Target vs Actual (YTD)
-
PY YTD
-
CY vs PY (YTD)
Because everything appears on one screen, managers can immediately identify underperforming KPIs.
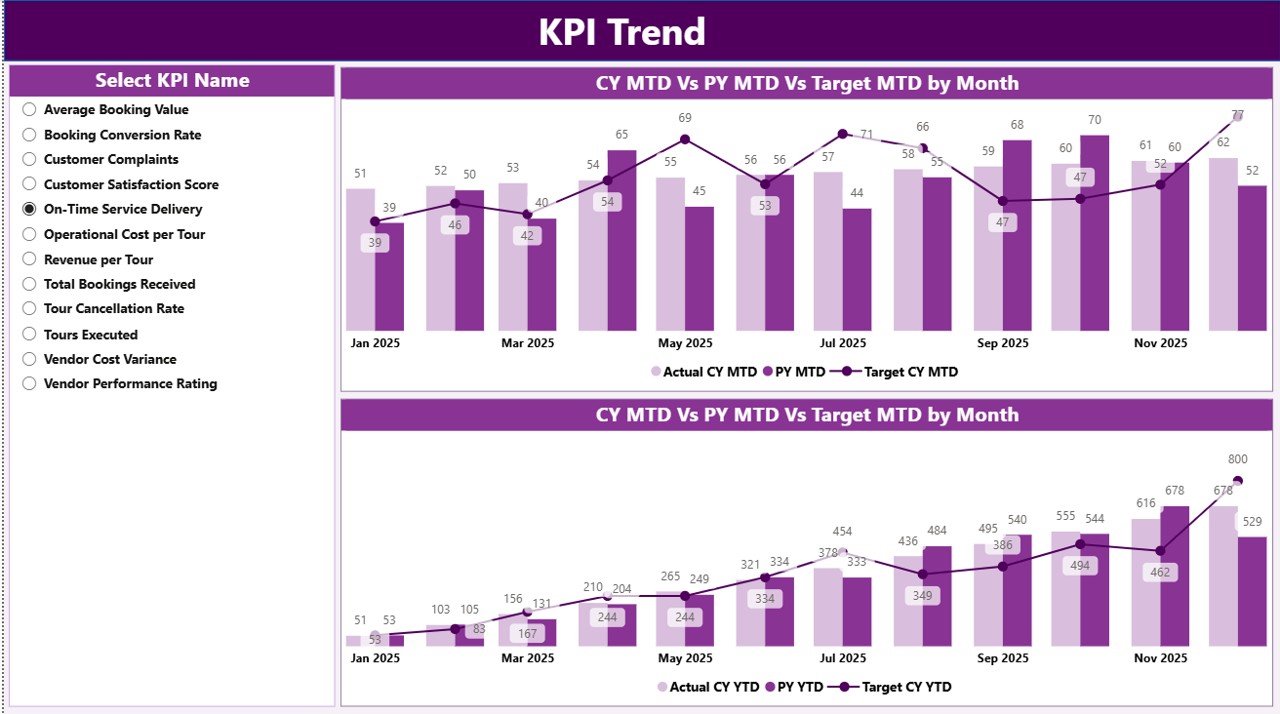
📈 2. KPI Trend Page – Performance Over Time
The KPI Trend Page helps analyze performance patterns.
Key Capabilities
-
KPI Name slicer for focused analysis
-
MTD Trend Chart (Actual vs Target vs PY)
-
YTD Trend Chart (Actual vs Target vs PY)
These visual trends help DMCs understand seasonality, growth patterns, and long-term improvement areas.
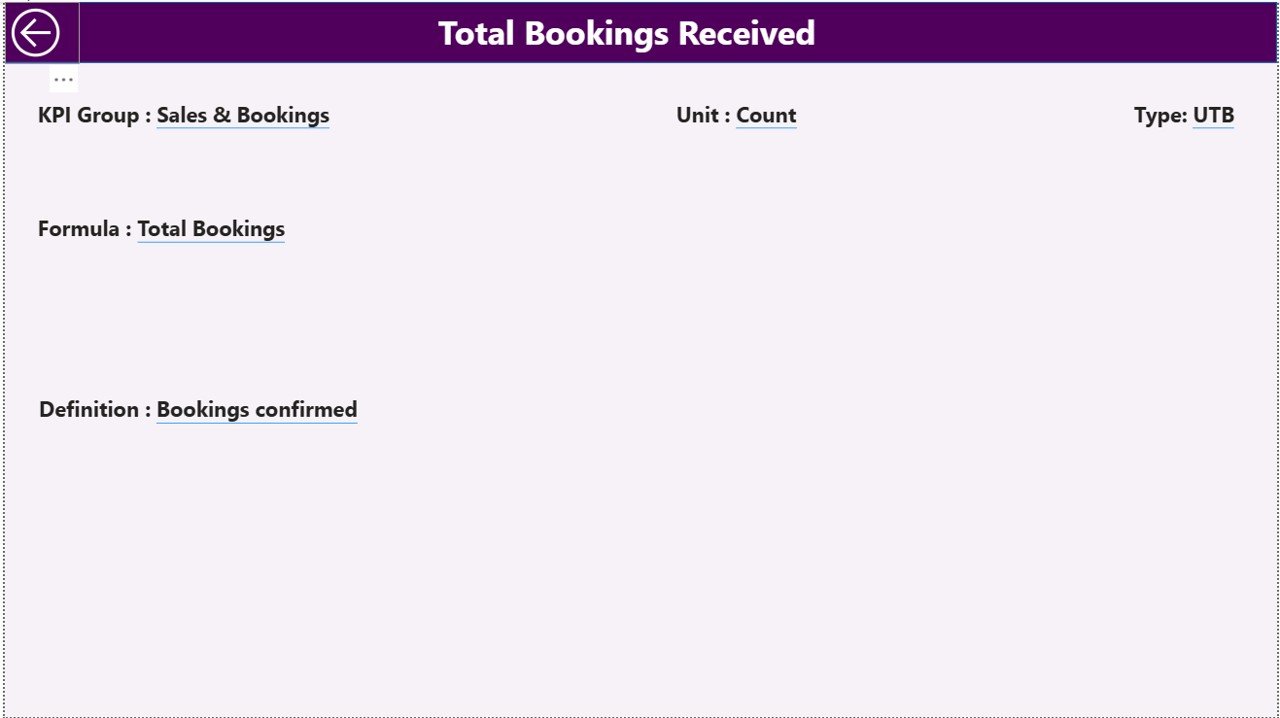
📘 3. KPI Definition Page – KPI Clarity & Governance
The KPI Definition Page is a drill-through reference page.
Displays
-
KPI Formula
-
KPI Definition
-
Unit of Measurement
-
KPI Type (LTB / UTB)
This ensures all stakeholders interpret KPIs correctly and consistently.
📂 Excel Data Structure (Backend)
This dashboard uses three Excel input sheets, making data maintenance simple.
📑 Input_Actual Sheet
-
KPI Name
-
Month (first date of the month)
-
MTD Actual
-
YTD Actual
🎯 Input_Target Sheet
-
KPI Name
-
Month (first date of the month)
-
MTD Target
-
YTD Target
📘 KPI Definition Sheet
-
KPI Number
-
KPI Group
-
KPI Name
-
Unit
-
Formula
-
Definition
-
KPI Type (LTB / UTB)
Power BI reads these sheets and updates all visuals automatically.
🎯 Who Can Benefit from This Dashboard?
This dashboard is ideal for:
✔ Destination Management Companies (DMCs)
✔ Travel & tourism operators
✔ Event and tour management firms
✔ Operations managers
✔ Finance and performance teams
✔ Business owners and leadership
Both small and large DMCs can scale this dashboard easily.
🚀 Business Benefits
Using this dashboard helps DMCs:
-
Improve operational visibility
-
Track performance against targets clearly
-
Identify issues early
-
Reduce manual reporting effort
-
Support strategic planning and reviews
-
Improve profitability and service quality
📺 Visit our YouTube channel to learn step-by-step video tutorials
👉 https://youtube.com/@PKAnExcelExpert
🔗 Click here to read the Detailed blog post


