

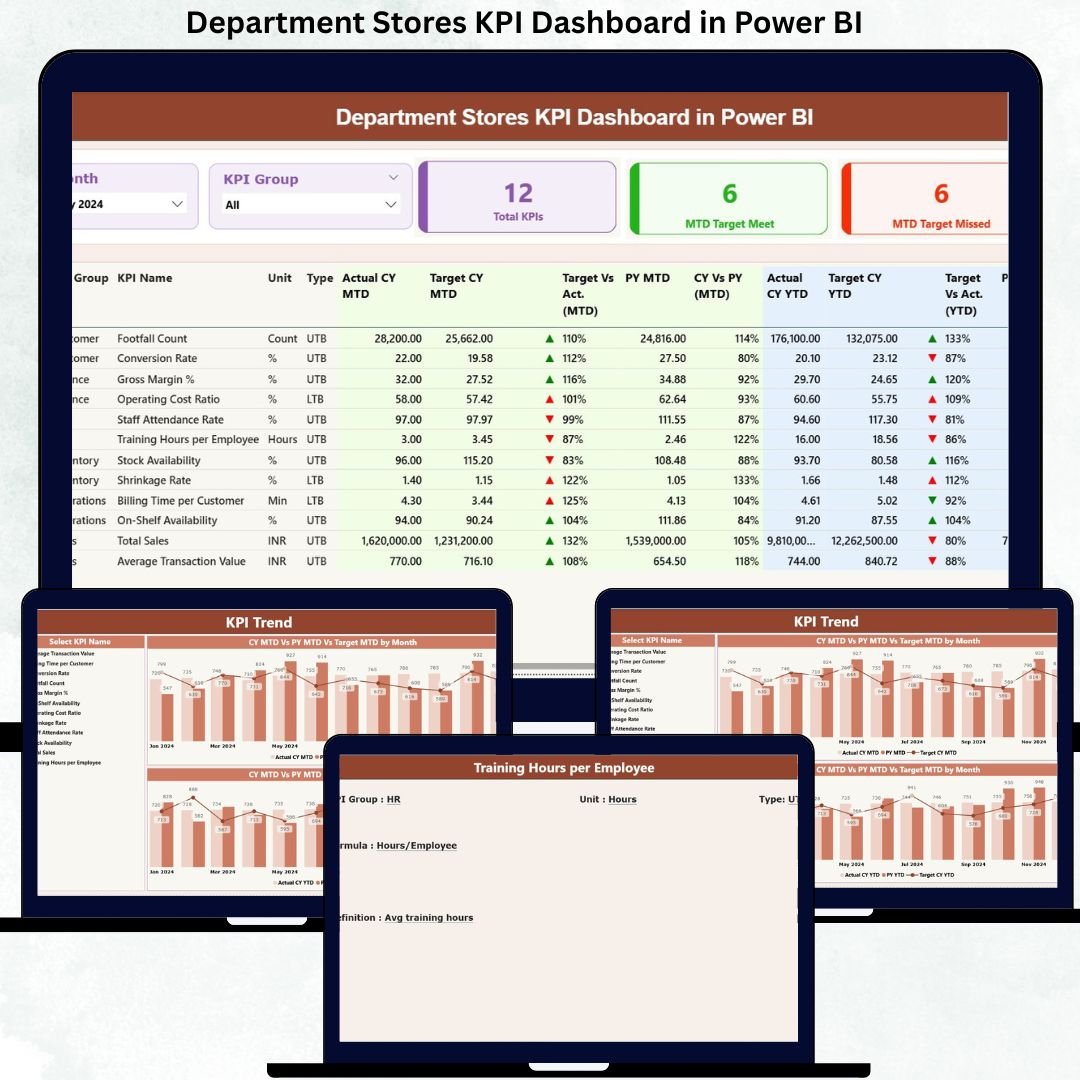
Running a modern department store is no longer just about stocking products and monitoring daily sales. Today’s retail managers must continuously track sales growth, customer behavior, operational efficiency, inventory movement, and staff productivity. However, when performance data is scattered across spreadsheets and manual reports, clarity disappears and decisions slow down.
That is exactly where the Department Stores KPI Dashboard in Power BI becomes a game-changing retail analytics solution.
This ready-to-use Power BI dashboard provides a centralized, interactive, and visual platform that allows retail teams to track all critical department store KPIs in one place. By combining Excel-based data input with Power BI’s advanced visualization, the dashboard helps store managers and leadership teams make faster, smarter, and data-driven decisions.
What Is a Department Stores KPI Dashboard in Power BI?
A Department Stores KPI Dashboard in Power BI is an interactive analytics dashboard designed to monitor, analyze, and compare key performance indicators across department store operations.
Instead of reading static reports, this dashboard displays:
✔ Month-to-Date (MTD) performance
✔ Year-to-Date (YTD) performance
✔ Target vs Actual comparison
✔ Current Year vs Previous Year (CY vs PY) analysis
✔ KPI-wise trend insights
Because Power BI handles visualization and Excel handle data entry, the dashboard remains powerful yet simple to maintain—even for non-technical users.
Why Do Department Stores Need This Dashboard?
Department stores operate across multiple categories and departments. Without a centralized KPI view, performance gaps often go unnoticed.
The Department Stores KPI Dashboard in Power BI helps because it:
✔ Centralizes all KPI tracking
✔ Highlights missed targets instantly
✔ Tracks MTD and YTD performance clearly
✔ Compares historical performance effortlessly
✔ Improves data-driven retail decisions
As a result, retail leaders spend less time preparing reports and more time improving store performance.
📊 Key Features of Department Stores KPI Dashboard in Power BI
🚀 Centralized Retail KPI Monitoring
Track all department store KPIs from a single dashboard.
📅 MTD & YTD Performance Tracking
Analyze both short-term execution and long-term growth.
🎯 Target vs Actual Visibility
Instantly identify underperforming KPIs using visual indicators.
🔁 CY vs PY Comparison
Understand year-over-year growth and seasonal patterns.
📈 Trend Analysis
Visualize KPI performance over time using interactive charts.
⚙️ Excel + Power BI Architecture
Easy Excel data entry with powerful Power BI analytics.
📦 What’s Inside the Department Stores KPI Dashboard?
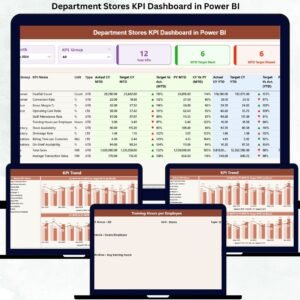
The dashboard includes three professionally designed Power BI pages.
🏠 1. Summary Page – Complete Retail Performance Overview
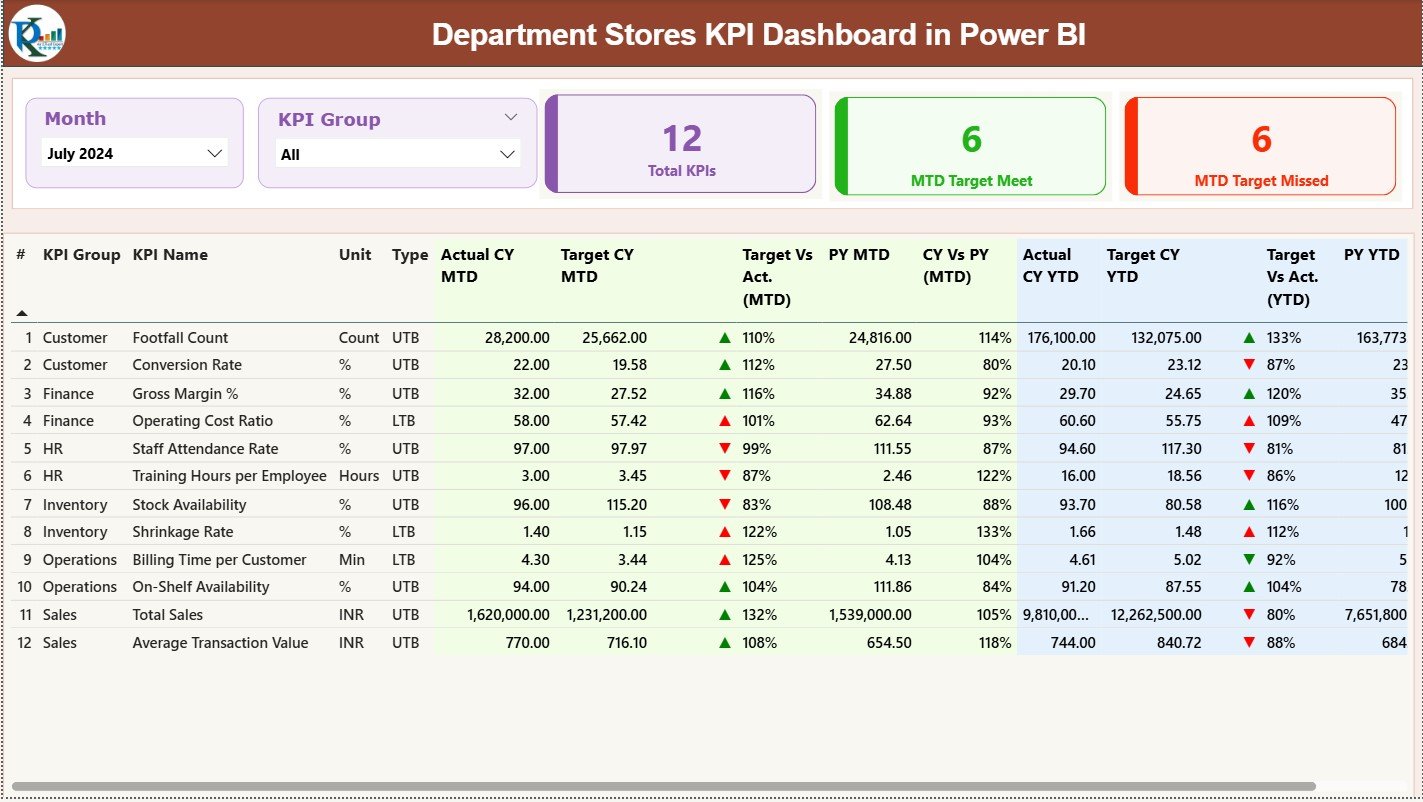
Month slicer
KPI Group slicer
KPI Cards:
Total KPIs Count
MTD Target Met Count
MTD Target Missed Count
Detailed KPI Table showing:
KPI Number, Group, Name, Unit
KPI Type (UTB / LTB)
MTD Actual, Target, PY, Variance
YTD Actual, Target, PY, Variance
▲ / ▼ performance indicators
This page acts as the main control panel for retail performance.
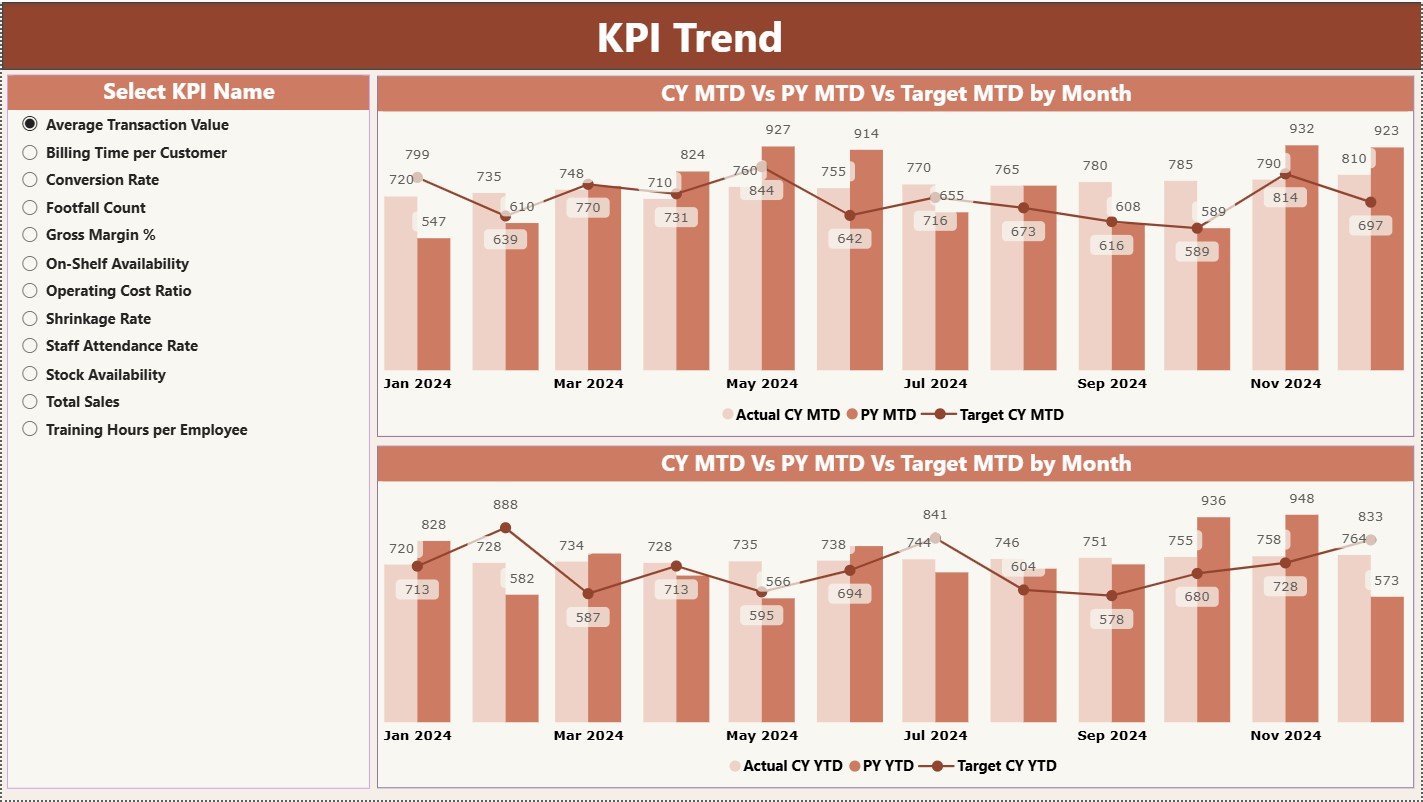
📈 2. KPI Trend Page – Performance Over Time
KPI Name slicer
MTD trend combo chart (Actual CY, PY, Target)
YTD trend combo chart (Actual CY, PY, Target)
This page helps managers identify patterns, risks, and opportunities early.
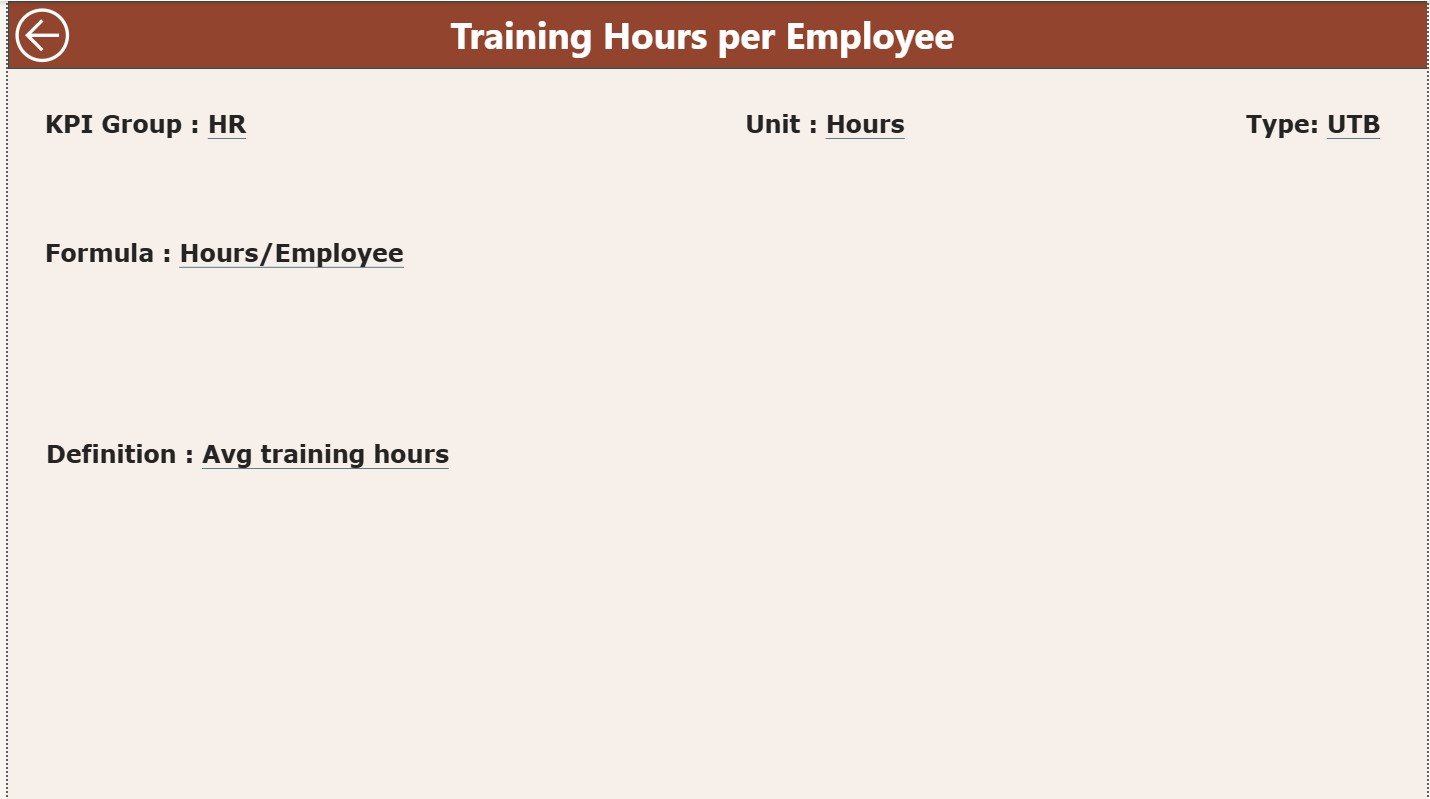
📘 3. KPI Definition Page – KPI Transparency
KPI Formula
KPI Definition
KPI Unit
KPI Type (UTB / LTB)
This drill-through page ensures consistent KPI understanding across teams.
🧠 How to Use the Department Stores KPI Dashboard
1️⃣ Enter actual KPI data in Excel
2️⃣ Enter target KPI data in Excel
3️⃣ Refresh Power BI
4️⃣ Select Month or KPI Group using slicers
5️⃣ Analyze MTD, YTD, and trend performance
6️⃣ Drill through KPI definitions if required
No advanced Power BI expertise needed.
👥 Who Can Benefit from This Dashboard?
✔ Department Store Managers
✔ Retail Operations Teams
✔ Sales & Merchandising Teams
✔ Finance & Planning Teams
✔ Retail Analysts
✔ Store Owners & Leadership
Suitable for single-store and multi-store operations.
🌟 Advantages of Department Stores KPI Dashboard in Power BI
✔ Centralized KPI visibility
✔ Faster decision-making
✔ Clear target tracking
✔ Historical performance insights
✔ User-friendly interface
✔ Scalable KPI structure
✔ Reduced manual reporting effort
Conclusion
The Department Stores KPI Dashboard in Power BI transforms scattered retail data into clear, actionable insights. By combining Excel’s simplicity with Power BI’s visualization strength, it gives retail leaders visibility, control, and confidence.
If your department store aims to improve efficiency, accountability, and profitability, this dashboard becomes an essential retail management tool.


























Reviews
There are no reviews yet.