


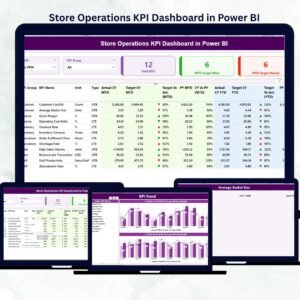
The Store Operations KPI Dashboard in Power BI is a next-generation analytics solution that helps retail professionals monitor performance, drive profitability, and enhance customer experience — all in one place. Whether you manage one store or a nationwide chain, this dashboard transforms raw data into actionable insights.Store Operations KPI Dashboard in Power BI
✨ Key highlights include:
-
📊 Interactive visuals: Gain real-time insights into sales, operations, and workforce metrics.
-
🕒 MTD & YTD tracking: Compare current performance with targets and past results.
-
🔍 Drill-through analysis: Instantly access KPI formulas, definitions, and performance trends.
-
🧠 Excel-powered data: Connects easily with an Excel source file for quick data refresh.
-
⚙️ Customizable layout: Tailor KPIs, visuals, and slicers to your store’s reporting needs.
-
🔁 Dynamic filtering: Slice and dice by Month or KPI Group using intuitive filters.
-
📈 Visual storytelling: Understand performance at a glance with charts, cards, and icons.
-
🔒 Data transparency: Ensure accuracy and consistency through direct Excel integration.

📦 What’s Inside the Store Operations KPI Dashboard in Power BI
This ready-to-use dashboard template includes three professional Power BI pages designed for simplicity, clarity, and impact.
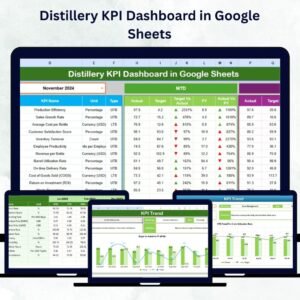
1️⃣ Summary Page:
The main page offering a high-level snapshot of performance.
-
Month and KPI Group slicers for easy filtering.Store Operations KPI Dashboard in Power BI
-
KPI cards showing Total KPIs, MTD Target Met, and MTD Target Missed.
-
A detailed performance table for deeper operational insights.
2️⃣ KPI Trend Page:
Understand trends and patterns across months and years.
-
Two combo charts compare Actual, Target, and Previous Year results.
-
One KPI Name slicer to analyze performance by category or department.
-
Ideal for identifying strengths, weaknesses, and improvement opportunities.
3️⃣ KPI Definition Page:
Drill down to understand each metric in detail.
-
View KPI Formula, Definition, and Type (UTB/LTB).
-
Includes a back button for smooth navigation to the Summary Page.
📘 Excel Data Source Integration:
The dashboard connects seamlessly to Excel with three key sheets:
-
Input_Actual– Captures KPI name, month, and performance data. -
Input_Target– Stores monthly targets for each KPI. -
KPI_Definition– Contains KPI Group, Unit, Formula, and Type.
Simply update your Excel file and refresh Power BI to see real-time analytics instantly.
🧩 How to Use the Store Operations KPI Dashboard in Power BI
💡 Follow these simple steps to get started:
1️⃣ Update Excel Sheets: Enter monthly Actuals and Targets for all KPIs.
2️⃣ Open Power BI File: Connect the Excel file to your dashboard.
3️⃣ Refresh Data: Click Refresh to update visuals automatically.
4️⃣ Use Slicers: Filter by Month or KPI Group to focus on specific insights.
5️⃣ Drill Through: Select any KPI to explore its formula and definition.
6️⃣ Share Insights: Export reports or share the Power BI dashboard with your team.
🌟 Pro Tips:
-
Refresh data monthly for accurate results.
-
Maintain clean and consistent Excel entries.
-
Use a balanced mix of “Upper the Better” and “Lower the Better” KPIs.
-
Review visuals regularly to ensure they align with business goals.
👥 Who Can Benefit from This Store Operations KPI Dashboard
This dashboard is ideal for professionals who manage, analyze, or optimize retail performance:
-
🏪 Store Managers: Track operational performance daily.
-
🏢 Regional Managers: Compare multiple store KPIs side-by-side.
-
📊 Operations Executives: Analyze patterns and drive process improvement.
-
💰 Finance Teams: Align operational efficiency with cost optimization.
-
👩💼 HR & Training Teams: Monitor employee productivity and staffing levels.
Whether you run a single store or hundreds, this tool ensures you have complete visibility into what’s working and what needs attention — instantly and visually.


Reviews
There are no reviews yet.