



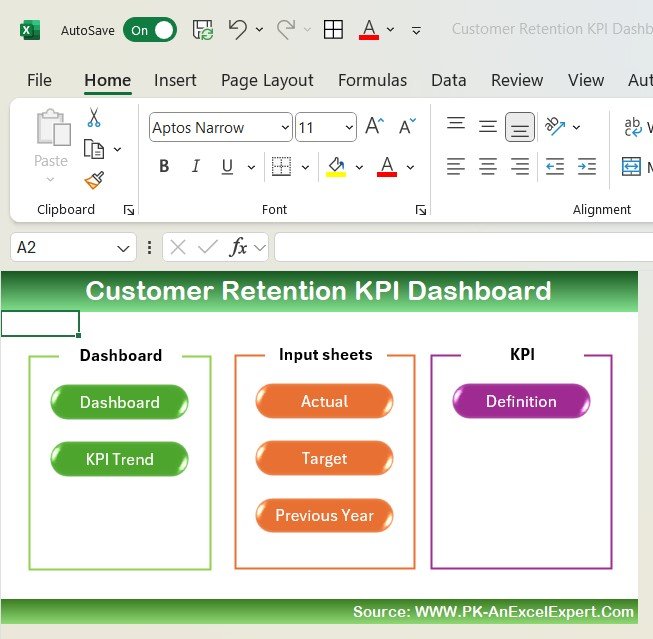
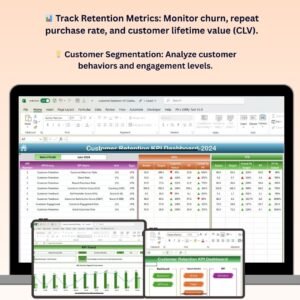
The Customer Retention KPI Dashboard in Excel is a powerful tool for businesses looking to monitor and improve customer retention. This comprehensive Excel-based dashboard helps you track key customer retention metrics, such as customer lifetime value (CLV), churn rate, repeat purchase rate, and customer satisfaction, to ensure that your business is providing exceptional service and retaining loyal customers.
By analyzing your customer data, this dashboard offers valuable insights into customer behaviors and trends. With its visualizations and customizable KPIs, you can easily identify areas where customer retention strategies can be improved. Whether you’re in retail, e-commerce, or any customer-focused industry, this tool will help you improve customer loyalty and grow your business sustainably.
Key Features of the Customer Retention KPI Dashboard in Excel
📊 Track Customer Retention Metrics
Monitor essential KPIs such as churn rate, repeat purchase rate, and customer lifetime value (CLV). Track how well your business is retaining customers and identify opportunities to increase loyalty.
💡 Customer Segmentation & Insights
Segment your customers based on behaviors, purchase history, and engagement levels. Gain actionable insights into the types of customers that are most loyal and identify those at risk of churning.
📈 Churn & Loyalty Analysis
Track your churn rate and customer loyalty over time. Use the dashboard to analyze why customers are leaving and which retention strategies are most effective at keeping them engaged.
📅 Customer Satisfaction Tracking
Monitor customer satisfaction and feedback. Track ratings, surveys, and Net Promoter Score (NPS) to assess how satisfied your customers are and identify areas where improvements are needed.
🔄 Customizable KPIs & Reports
Customize the dashboard to meet your business’s specific retention goals. Add or remove KPIs, set personalized targets, and track performance across various customer segments.
📉 Visual Data Insights
Visualize key metrics with easy-to-read graphs and charts. Quickly identify trends in retention, customer satisfaction, and engagement to make data-driven decisions that enhance loyalty.
Why You’ll Love the Customer Retention KPI Dashboard in Excel
✅ Increase Customer Loyalty
By tracking key retention metrics, you can develop strategies to improve customer satisfaction and reduce churn. The dashboard provides clear insights into which actions will boost loyalty.
✅ Analyze Customer Behavior
Segment your customer base and track their behaviors to understand what drives repeat purchases and what leads to churn. Use this data to personalize your marketing strategies and improve customer relationships.
✅ Monitor Customer Satisfaction
Stay on top of your customer’s experience by tracking satisfaction ratings, NPS, and feedback. Identify pain points and areas where you can enhance your product or service offering.
✅ Optimize Retention Strategies
With real-time data and visual insights, you can make data-driven decisions on your retention strategies. Use the dashboard to test and refine customer retention initiatives.
✅ Customizable for Your Needs
Whether you’re focused on e-commerce, retail, or a service-based business, this dashboard can be easily customized to track the specific KPIs that are most important for your customer retention strategy.
What’s Inside the Customer Retention KPI Dashboard in Excel?
- Customer Lifetime Value (CLV) Tracking: Track the value of your customers over time to measure their total worth to your business.
- Churn Rate & Repeat Purchase Metrics: Monitor churn and track repeat purchases to understand customer loyalty.
- Customer Segmentation & Engagement: Segment customers based on behaviors and track their engagement levels.
- Customer Satisfaction Tracker: Monitor customer satisfaction, feedback, and NPS to identify areas for improvement.
- Customizable Reports & Insights: Tailor your KPIs and reports to match your specific customer retention goals.
- Visual Data Representation: Use charts and graphs to easily analyze customer retention trends and performance.
How to Use the Customer Retention KPI Dashboard in Excel
1️⃣ Download the Template: Instantly access the Customer Retention KPI Dashboard in Excel.
2️⃣ Input Your Customer Data: Enter data such as customer purchase history, churn rate, and satisfaction scores into the template.
3️⃣ Track Key Metrics: Monitor customer retention metrics such as CLV, churn, repeat purchase rate, and NPS.
4️⃣ Analyze Performance & Satisfaction: Use the dashboard to track customer satisfaction and identify areas where retention can be improved.
5️⃣ Generate Reports & Insights: Share insights with your team and make data-driven decisions to optimize retention strategies.
Who Can Benefit from the Customer Retention KPI Dashboard in Excel?
🔹 E-commerce & Retail Businesses
🔹 Marketing Managers & Customer Success Teams
🔹 Business Analysts & Data Analysts
🔹 Customer Support & Engagement Teams
🔹 Small & Medium Enterprises (SMEs)
🔹 Enterprises Looking to Improve Customer Loyalty
Improve customer retention, increase loyalty, and enhance your business’s bottom line with the Customer Retention KPI Dashboard in Excel. Track performance, monitor satisfaction, and use data insights to make better decisions and build stronger customer relationships.
Click here to read the Detailed blog post
Visit our YouTube channel to learn step-by-step video tutorials
Youtube.com/@PKAnExcelExpert
Compatibility and Requirements
- Works in Microsoft Excel desktop (Excel 2016 or later, or Microsoft 365).
- Charts and graphs are standard Excel features. Microsoft explains them in Create a chart from start to finish.
Frequently Asked Questions
Which retention KPIs does it track?
Customer lifetime value (CLV), churn rate, repeat purchase rate, customer satisfaction and Net Promoter Score (NPS).
Can I segment customers?
Yes. You can segment customers by behavior, purchase history and engagement level.
What data do I enter?
Customer purchase history, churn figures and satisfaction scores.
Can I set my own targets?
Yes. You can add or remove KPIs, set targets and track performance across customer segments.
Related Customer Retention Templates
- Customer Retention KPI Dashboard in Power BI: the same topic for Power BI users
- Customer Retention KPI Dashboard in Google Sheets: the same topic in Google Sheets
- Customer Retention KPI Scorecard in Excel: a scorecard view of retention KPIs
- Customer Churn KPI Dashboard in Excel: focuses on churn
- Customer Loyalty KPI Dashboard in Excel: tracks loyalty KPIs
Browse all Excel KPI dashboards or the Excel sales and marketing templates.






























Reviews
There are no reviews yet.