

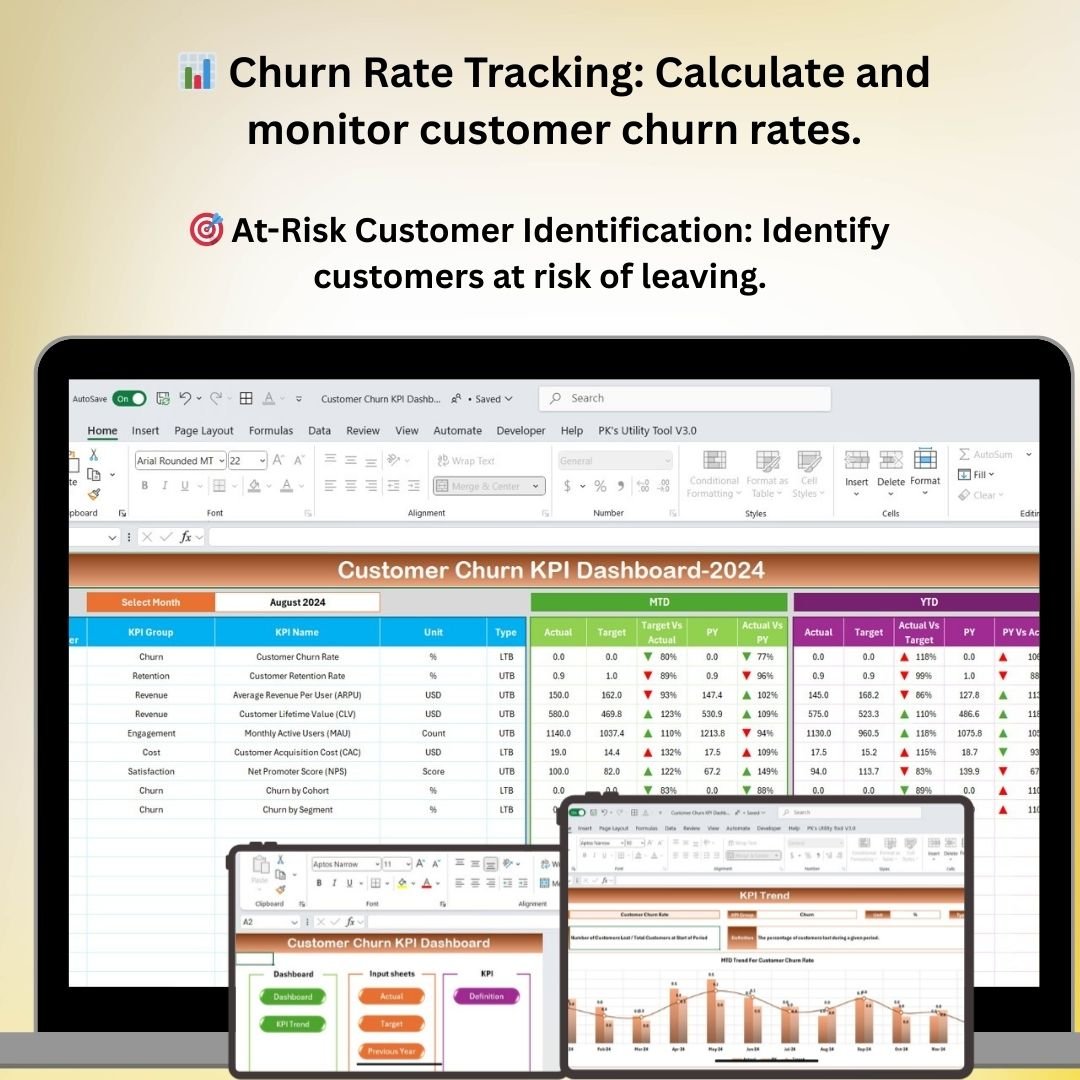
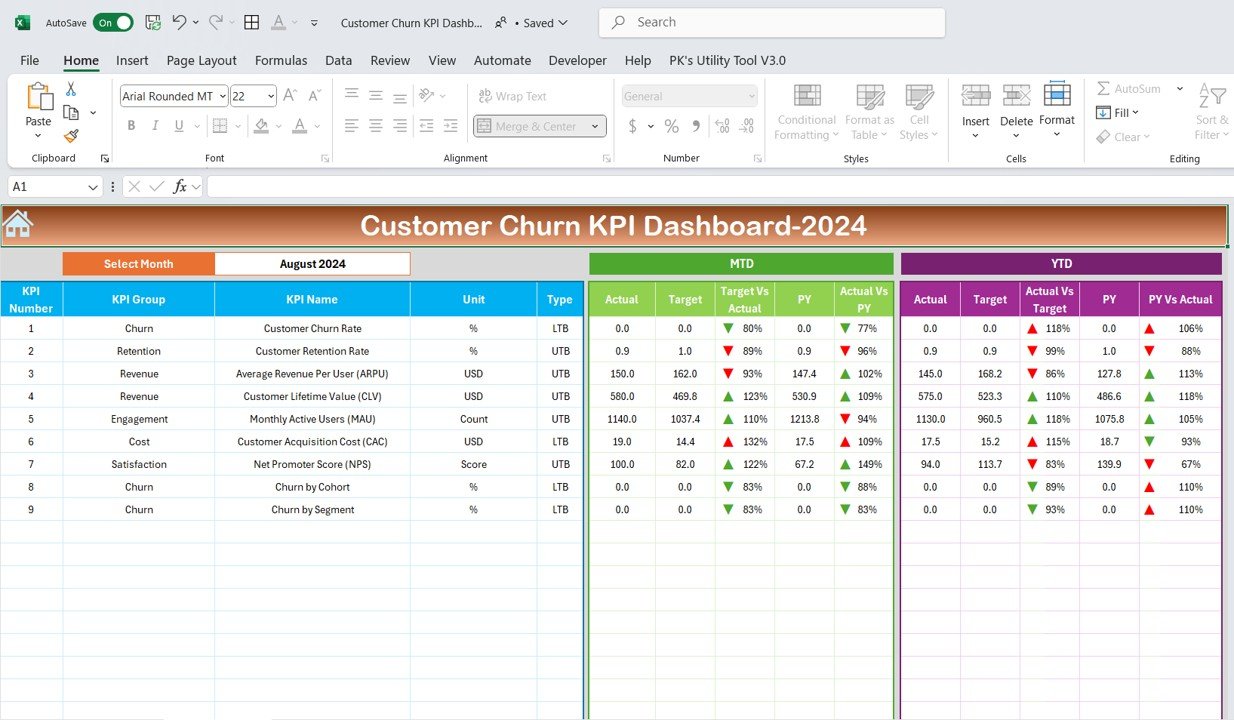



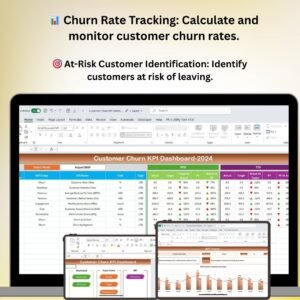
The Customer Churn KPI Dashboard in Excel is an essential tool for businesses looking to monitor and reduce customer churn. This Excel-based dashboard helps you track key performance indicators (KPIs) related to customer retention, allowing you to analyze the reasons behind customer attrition and take proactive steps to improve retention strategies.
Whether you’re managing a subscription service, e-commerce business, or any customer-focused organization, this dashboard enables you to identify at-risk customers, assess churn trends, and develop effective strategies to keep your customer base intact. By using this tool, you can make data-driven decisions to improve customer satisfaction, increase loyalty, and reduce churn.
Key Features of the Customer Churn KPI Dashboard in Excel
📊 Churn Rate Calculation & Monitoring
Track the percentage of customers lost over a specific time period, comparing it to past data. Easily calculate churn rates and identify the overall impact of customer attrition.
📉 At-Risk Customer Identification
Pinpoint customers who are at risk of churning by analyzing engagement metrics, purchase history, and interaction patterns. Identify early warning signs and take action to retain these customers.
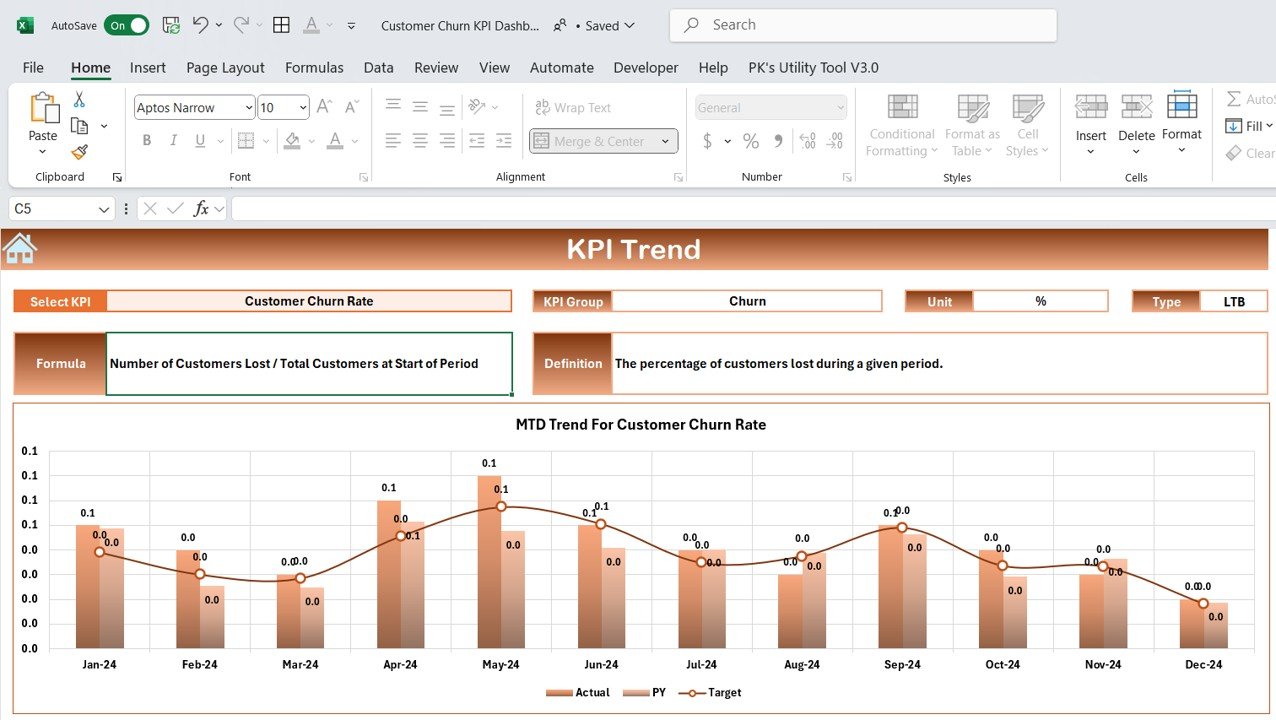
📅 Time-Based Analysis of Churn Trends
Monitor customer churn over different periods (monthly, quarterly, or yearly). Identify patterns and trends that can help you forecast future churn and make proactive adjustments to your customer retention strategies.
⚙️ Customer Segmentation
Segment your customer base by various factors such as demographics, subscription type, or purchasing behavior. Track churn rates for each segment to understand where to focus your retention efforts.
📈 Retention Metrics & KPIs
Track retention-related KPIs, such as customer lifetime value (CLV), repeat purchase rates, and satisfaction scores. Analyze the relationship between these metrics and churn rates to identify areas for improvement.
🔄 Automated Data Tracking & Updates
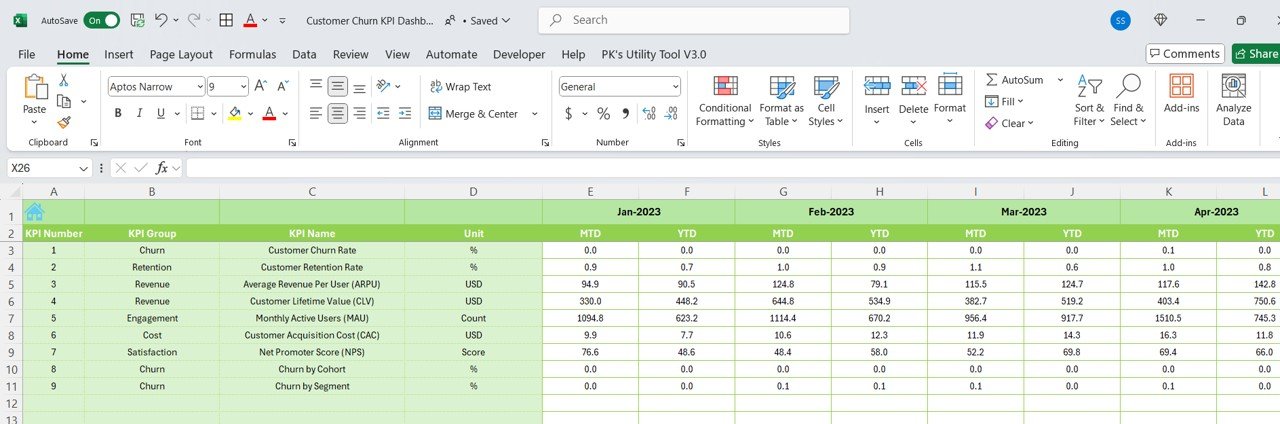
As you enter data, the dashboard automatically updates, providing real-time insights into your churn rates, at-risk customers, and other key retention metrics.
Why You’ll Love the Customer Churn KPI Dashboard in Excel

✅ Track Customer Churn Effectively
Easily track and monitor churn rates and trends across different time periods. Understand the impact of customer attrition and take proactive steps to reduce churn.
✅ Identify & Retain At-Risk Customers
Use data-driven insights to identify customers who are at risk of leaving. Focus your retention efforts on these high-value customers to improve loyalty and satisfaction.
✅ Improve Customer Retention Strategies
Monitor customer retention KPIs like CLV and satisfaction scores. Analyze the relationship between retention efforts and churn to adjust your strategies for better results.
✅ Customizable & Scalable
Adapt the dashboard to suit your business needs. Whether you’re a small business or a large enterprise, this tool is fully customizable to track the KPIs that matter most to your organization.
✅ Real-Time Data & Reporting
Stay up-to-date with real-time data updates. Use visualizations like charts and graphs to communicate churn trends and performance to stakeholders effectively.
What’s Inside the Customer Churn KPI Dashboard in Excel?
- Churn Rate Monitoring: Track customer churn rates and assess their impact on your business.
- At-Risk Customer Identification: Pinpoint customers at risk of churning using engagement and behavior data.
- Time-Based Churn Analysis: Track churn trends over various periods and forecast future behavior.
- Customer Segmentation: Segment your customers and analyze churn rates for each segment.
- Retention Metrics: Monitor KPIs such as CLV, repeat purchase rates, and satisfaction scores.
- Real-Time Data Updates: Automatically update the dashboard with new data for accurate insights.
How to Use the Customer Churn KPI Dashboard in Excel
1️⃣ Download the Template: Instantly access the Customer Churn KPI Dashboard in Excel.
2️⃣ Input Customer Data: Enter customer data, including purchases, engagement metrics, and satisfaction scores.
3️⃣ Track Churn & Retention Metrics: Monitor churn rates, at-risk customers, and retention KPIs in real-time.
4️⃣ Analyze Data & Trends: Use time-based analysis to track churn patterns and identify areas for improvement.
5️⃣ Adjust Retention Strategies: Use insights to optimize customer retention efforts and reduce churn.
Who Can Benefit from the Customer Churn KPI Dashboard in Excel?
🔹 Marketing & Customer Retention Teams
🔹 Subscription-Based Businesses
🔹 E-commerce Platforms & Online Retailers
🔹 Customer Service & Engagement Teams
🔹 Business Analysts & Data Analysts
🔹 Nonprofit Organizations with Member Retention
🔹 Small & Medium Enterprises (SMEs)
Reduce churn and improve customer retention with the Customer Churn KPI Dashboard in Excel. Track at-risk customers, analyze trends, and optimize your strategies to keep your customer base loyal and engaged.
Click here to read the Detailed blog post
Visit our YouTube channel to learn step-by-step video tutorials
Youtube.com/@PKAnExcelExpert



























Reviews
There are no reviews yet.