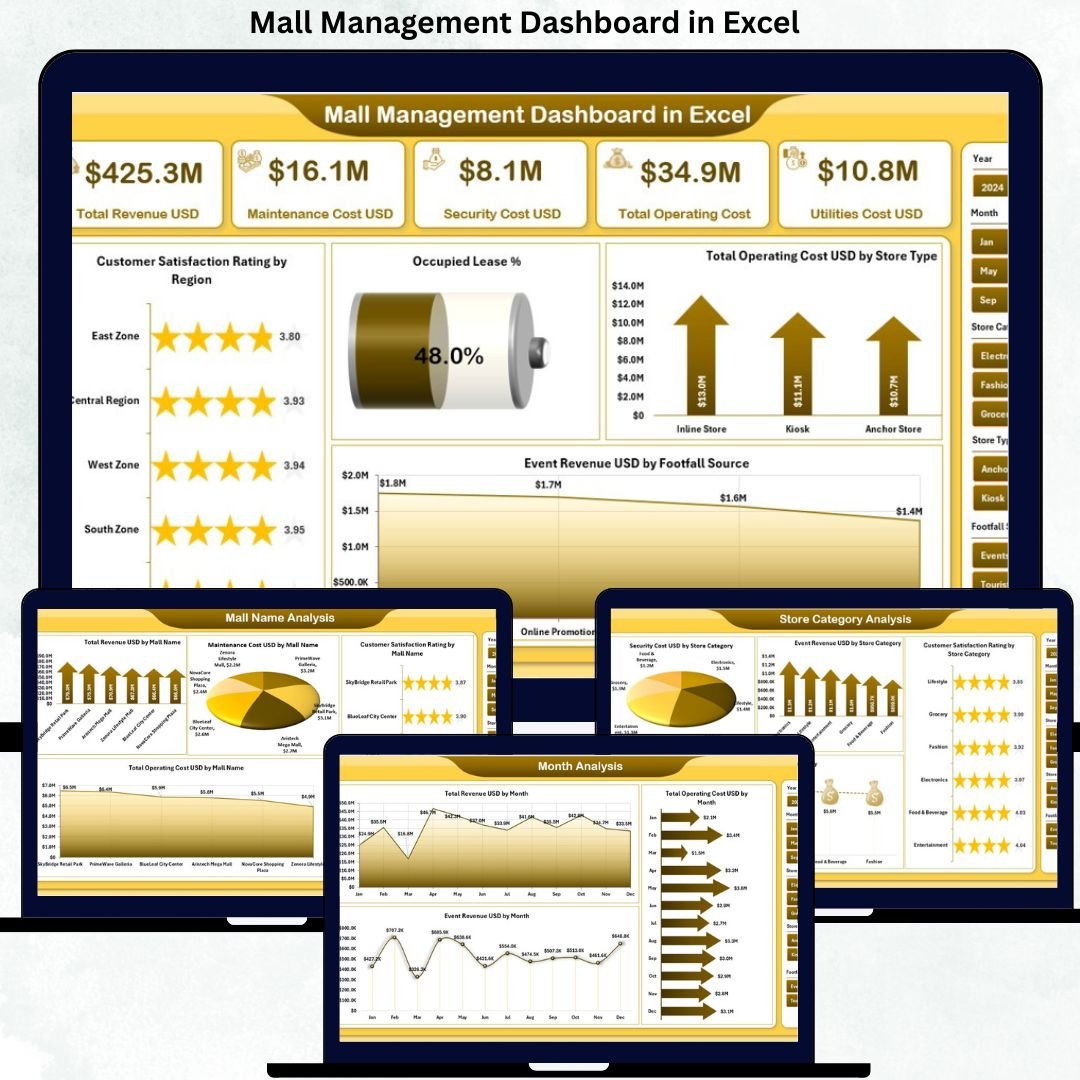
Managing a shopping mall today is far more complex than simply tracking rent collections. Mall managers must continuously monitor revenue streams, operating costs, lease occupancy, events, maintenance expenses, parking income, and customer satisfaction. However, when this information remains scattered across multiple Excel sheets or systems, visibility reduces and decisions become reactive. That is exactly why the Mall Management Dashboard in Excel is a powerful and essential solution for modern mall operations.
This ready-to-use Excel dashboard converts raw mall data into a clear, interactive, and visually rich reporting system. Instead of reviewing dozens of spreadsheets, mall managers and leadership teams can view all critical KPIs in one centralized dashboard. As a result, performance gaps, cost overruns, and growth opportunities become visible instantly.
Because this dashboard is built entirely in Microsoft Excel, it remains easy to use, highly flexible, and cost-effective. No advanced software, coding skills, or technical setup is required. You simply update your data, refresh the dashboard, and start analyzing insights.
🔑 Key Features of Mall Management Dashboard in Excel
🏬 Centralized Mall Performance View – Track revenue, operating costs, lease occupancy, events, and customer satisfaction in one Excel dashboard.
📊 Interactive KPI Cards & Charts – Instantly understand performance using visual cards and charts.
🎛️ Dynamic Slicers – Filter data by mall name, store category, event type, region, or month with one click.
📈 Multi-Level Analysis – Analyze performance at mall, store category, event, and monthly levels.
⚡ Automated Reporting – Reduce manual reporting effort and minimize calculation errors.
📂 What’s Inside the Mall Management Dashboard in Excel
This professionally designed dashboard includes five structured analysis pages, supported by backend data sheets:
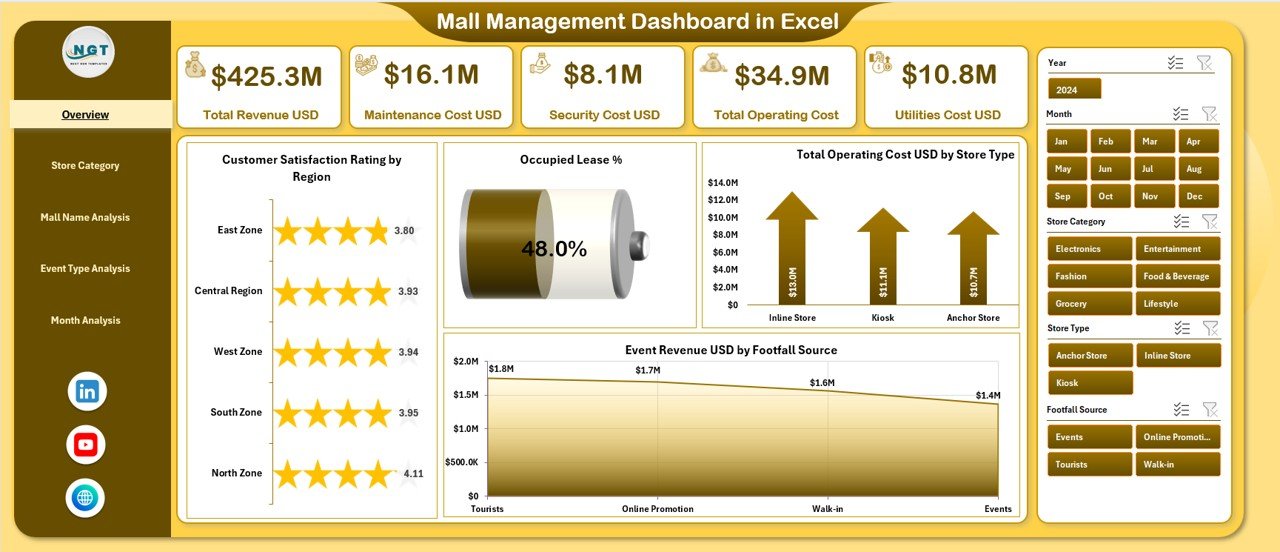
📊 Overview Page – Executive summary with KPI cards and visuals such as Customer Satisfaction Rating by Region, Occupied Lease %, Total Operating Cost by Store Type, and Event Revenue by Footfall Source.
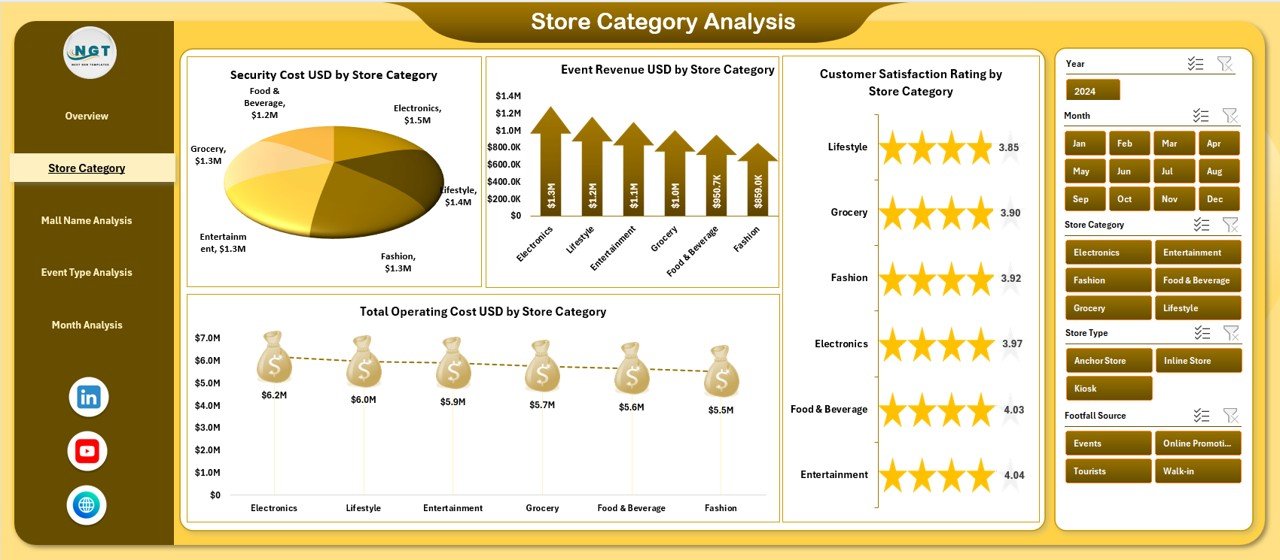
🏷️ Store Category Analysis Page – Evaluate performance by store type using metrics like revenue, operating cost, security cost, and satisfaction rating.
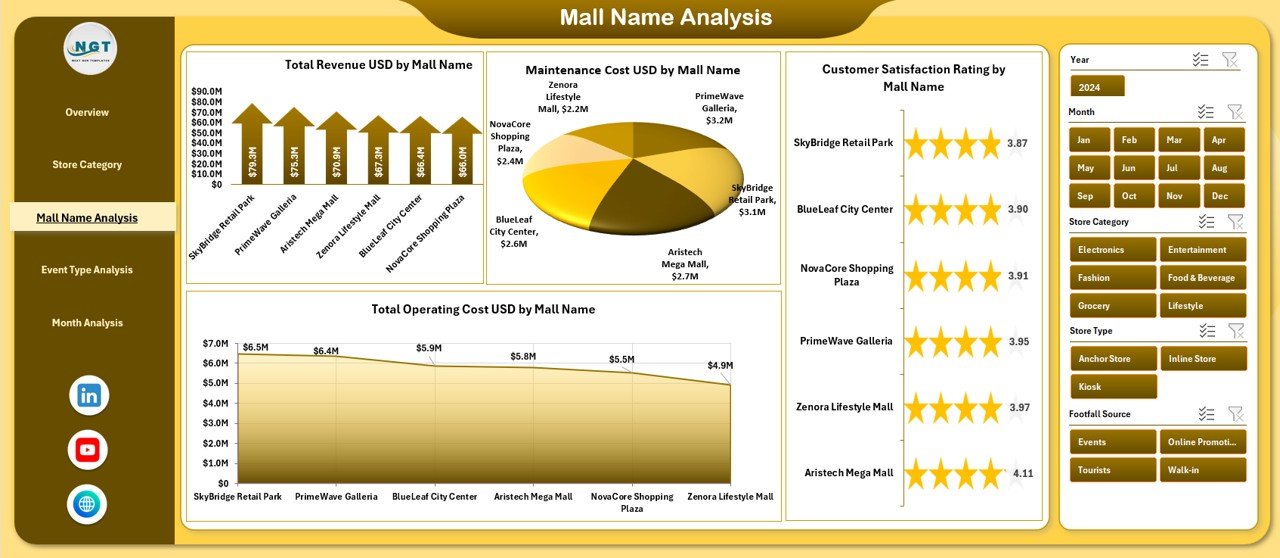
🏢 Mall Name Analysis Page – Compare multiple malls using Total Revenue, Maintenance Cost, Operating Cost, and Satisfaction Rating.
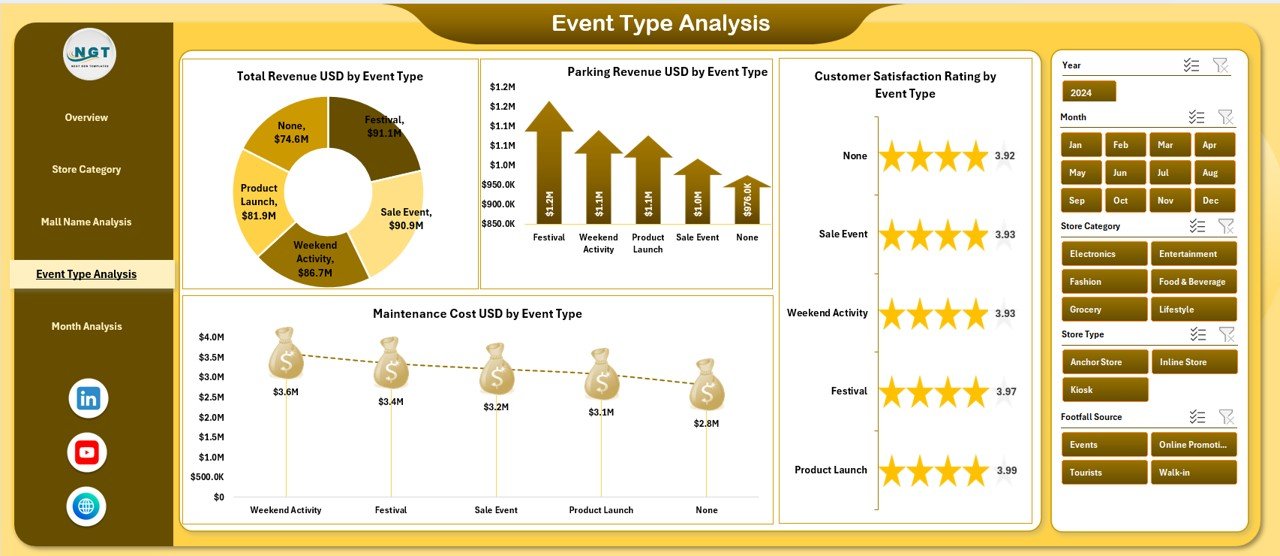
🎉 Event Type Analysis Page – Analyze which events drive higher revenue, parking income, and customer satisfaction.
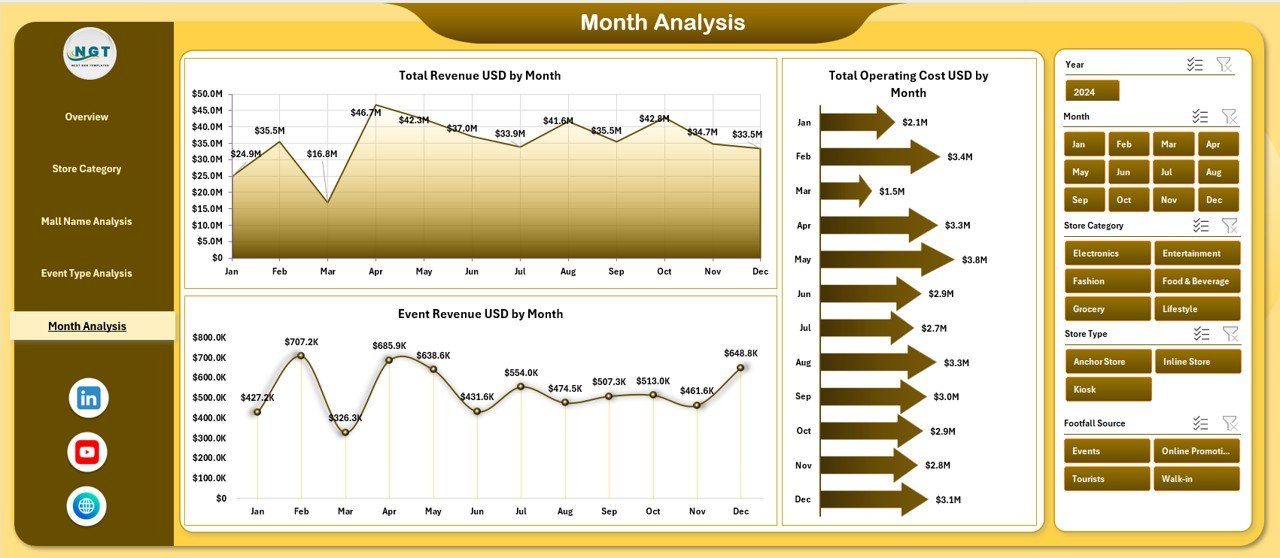
📅 Month Analysis Page – Identify trends with Total Revenue, Operating Cost, and Event Revenue by month.
📄 Data Sheet – Central repository for all raw mall operational data.
⚙️ Support Sheet – Helper tables, mappings, and calculations to keep the dashboard accurate and scalable.
Each page is logically designed to support daily, monthly, and strategic decision-making.
▶️ How to Use the Mall Management Dashboard in Excel
Using this dashboard is simple and practical:
1️⃣ Enter or paste your mall data into the Data Sheet.
2️⃣ Review automated calculations supported by the Support Sheet.
3️⃣ Navigate between pages using the built-in page navigator.
4️⃣ Apply slicers to filter data by mall, category, event type, or month.
5️⃣ Analyze KPIs and charts to take informed actions.
No advanced Excel knowledge is required—basic Excel skills are enough.
👥 Who Can Benefit from This Mall Management Dashboard in Excel
This dashboard is ideal for:
🏬 Mall Managers
⚙️ Operations Teams
💰 Finance & Accounting Teams
📋 Leasing Teams
🎉 Event Coordinators
📊 Senior Management
Each stakeholder gains clarity, control, and confidence in decision-making.
### 👉 Click here to read the Detailed Blog Post
Visit our YouTube channel to learn step-by-step video tutorials.


Reviews
There are no reviews yet.