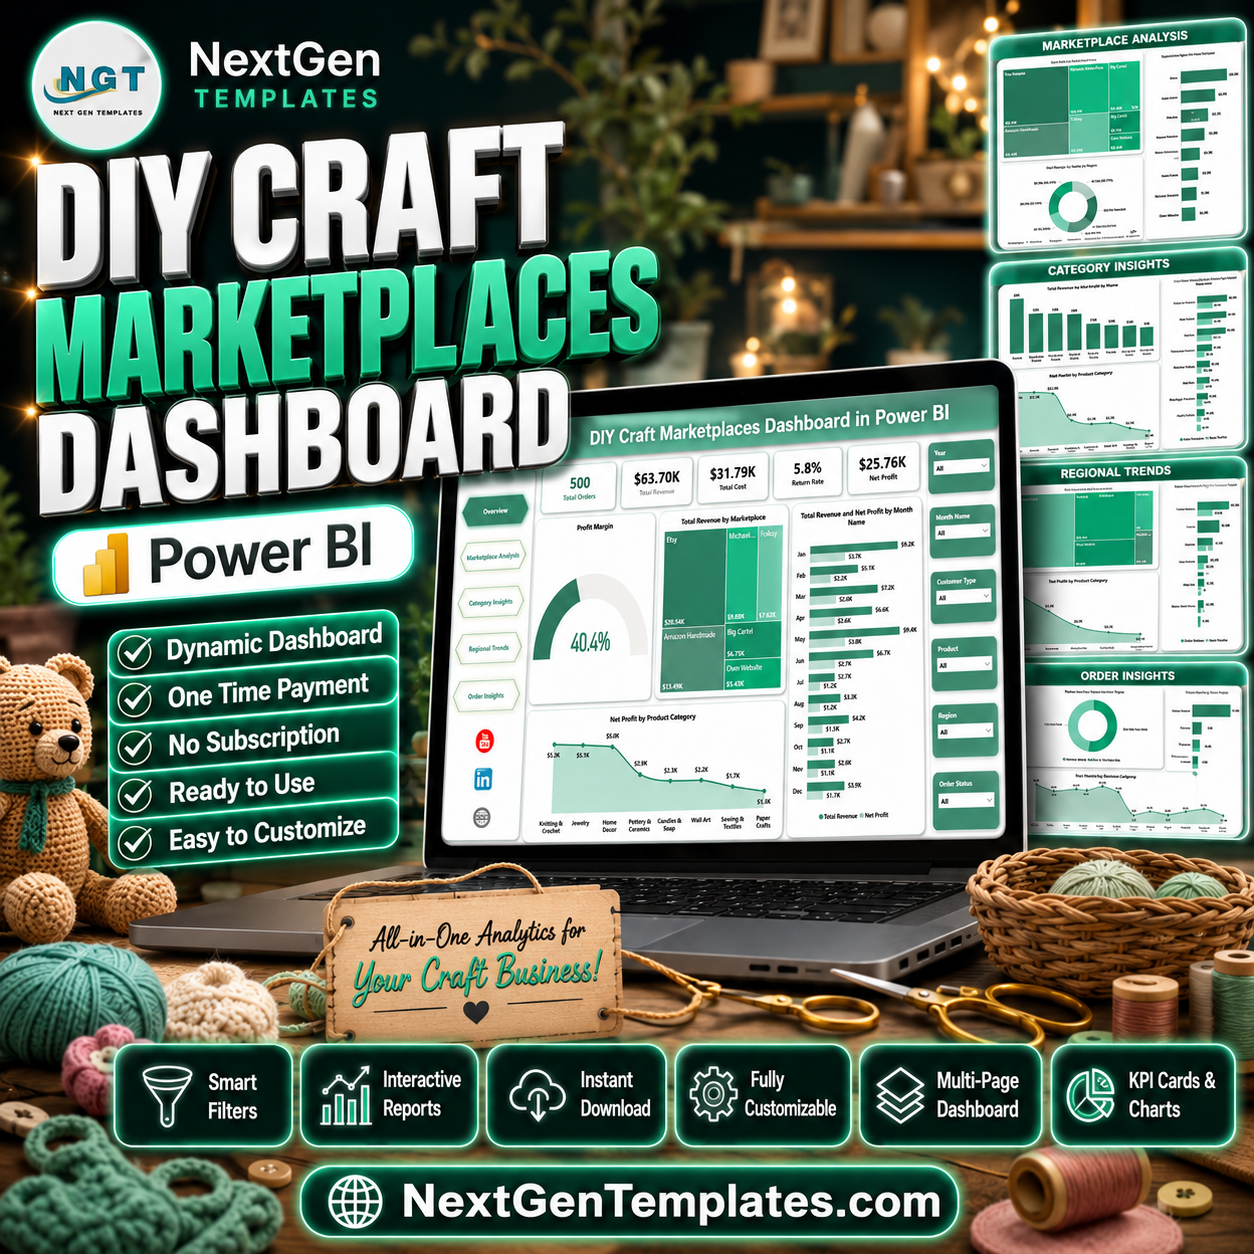
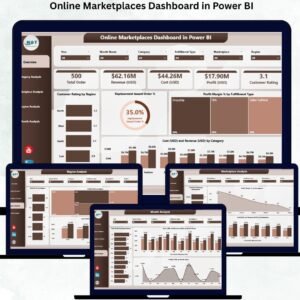
DIY Craft Marketplaces Dashboard in Power BI gives handmade sellers, craft marketplace teams, ecommerce analysts, and small retail founders a ready PBIX report for reviewing orders, revenue, cost, returns, profit, marketplace fees, regions, categories, and customer behavior. Online marketplace margins can shift quickly when fees, returns, and product mix move in different directions, so this report brings the important numbers into 5 Power BI pages with KPI cards, slicers, and focused visuals. Instant download. One-time payment. Editable Power BI file. No monthly dashboard subscription.
Key Features of DIY Craft Marketplaces Dashboard in Power BI
- 5 report pages covering Overview, Marketplace Analysis, Category Insights, Regional Trends, and Order Insights.
- Executive KPI cards for Total Orders, Total Revenue, Total Cost, Return Rate, and Net Profit.
- Marketplace comparison for revenue, profit, units sold, and profit margin across selling channels.
- Category-level analysis to compare product category revenue, cost, and unit movement.
- Regional reporting for orders, marketplace fees, revenue, and net profit by region.
- Order insights by customer type, month, and order status for operational review.
- Interactive slicers so users can filter dashboard pages quickly by available marketplace fields.
- Editable PBIX file for Power BI Desktop customization and publishing to Power BI Service.
What’s Inside the DIY Craft Marketplaces Dashboard in Power BI
1. Overview Page
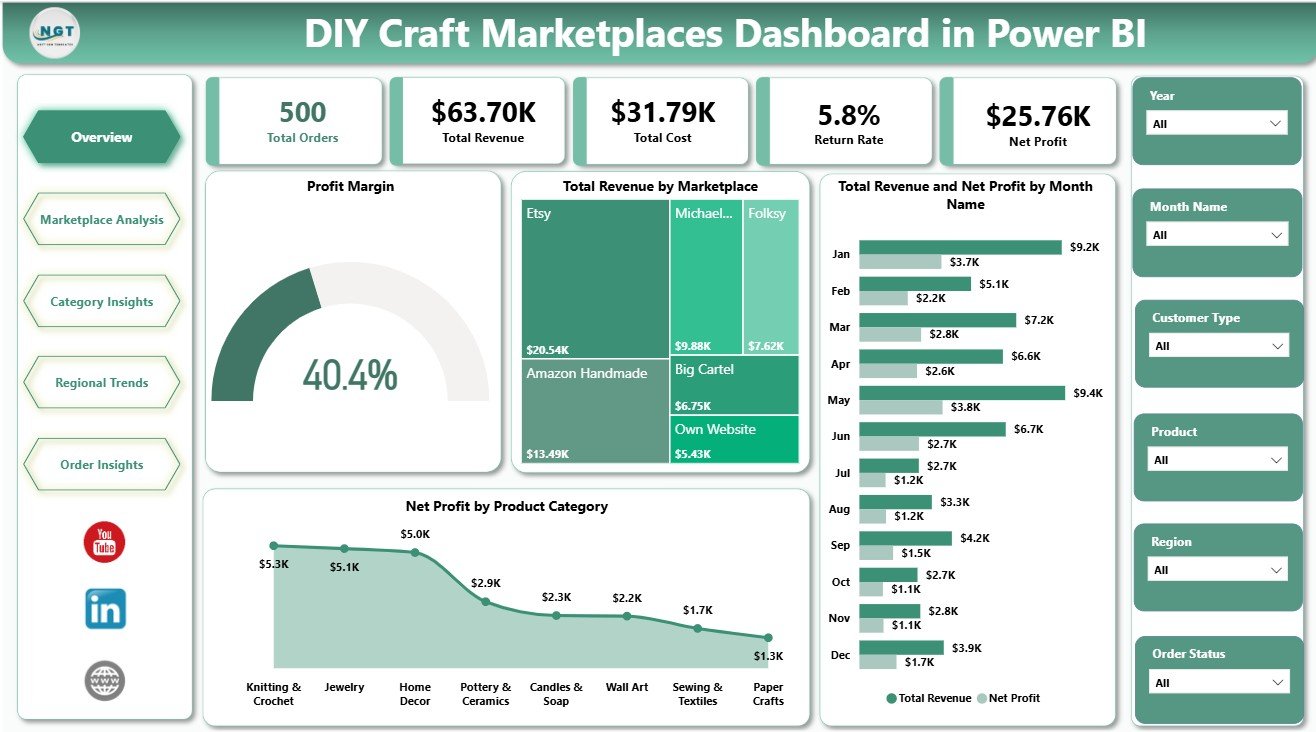
The Overview Page provides a high-level view of the craft marketplace business. Cards show Total Orders, Total Revenue, Total Cost, Return Rate, and Net Profit so leaders can review sales scale, expense pressure, returns, and profitability before drilling into the other pages.
Profit Margin by Dashboard Filters: This visual responds to slicer selections and shows how profitability changes across the selected marketplace, region, category, or order segment. It is useful for quickly spotting filtered views where margin needs attention.
Total Revenue by Marketplace: This chart compares revenue contribution by sales channel. It helps sellers see whether Etsy-style shops, independent storefronts, or other marketplaces are carrying the business.
Total Revenue and Net Profit by Month Name: This trend compares sales value against profit by month. Use it to see whether revenue growth is turning into actual earnings after cost, fees, and returns.
Net Profit by Product Category: This chart ranks categories by profitability. It supports product mix, pricing, and promotion decisions for handmade goods.
DIY Craft Marketplaces Dashboard in Power BI
2. Marketplace Analysis
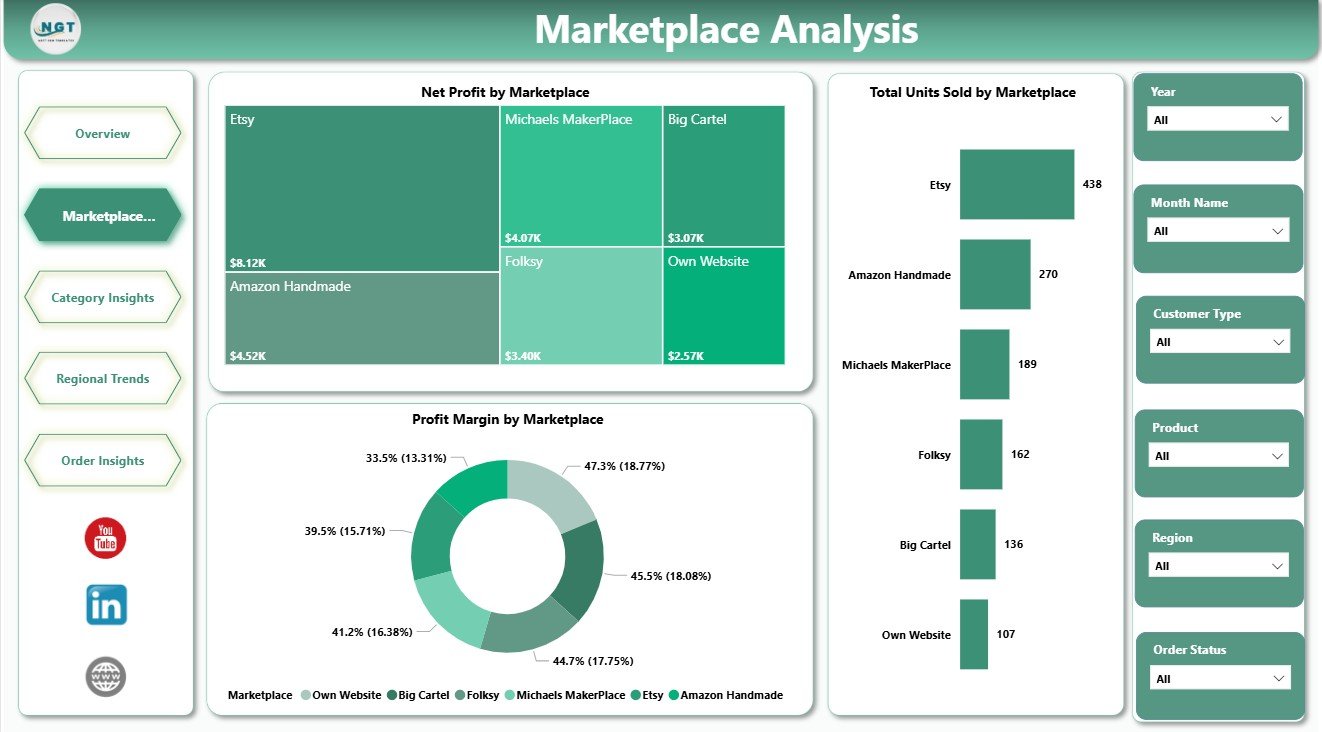
The Marketplace Analysis page compares channel performance using Net Profit by Marketplace, Total Units Sold by Marketplace, and Profit Margin by Marketplace. It helps sellers identify which channels bring volume, which channels protect profit, and which marketplaces may need pricing or fee review.
Marketplace Analysis
3. Category Insights
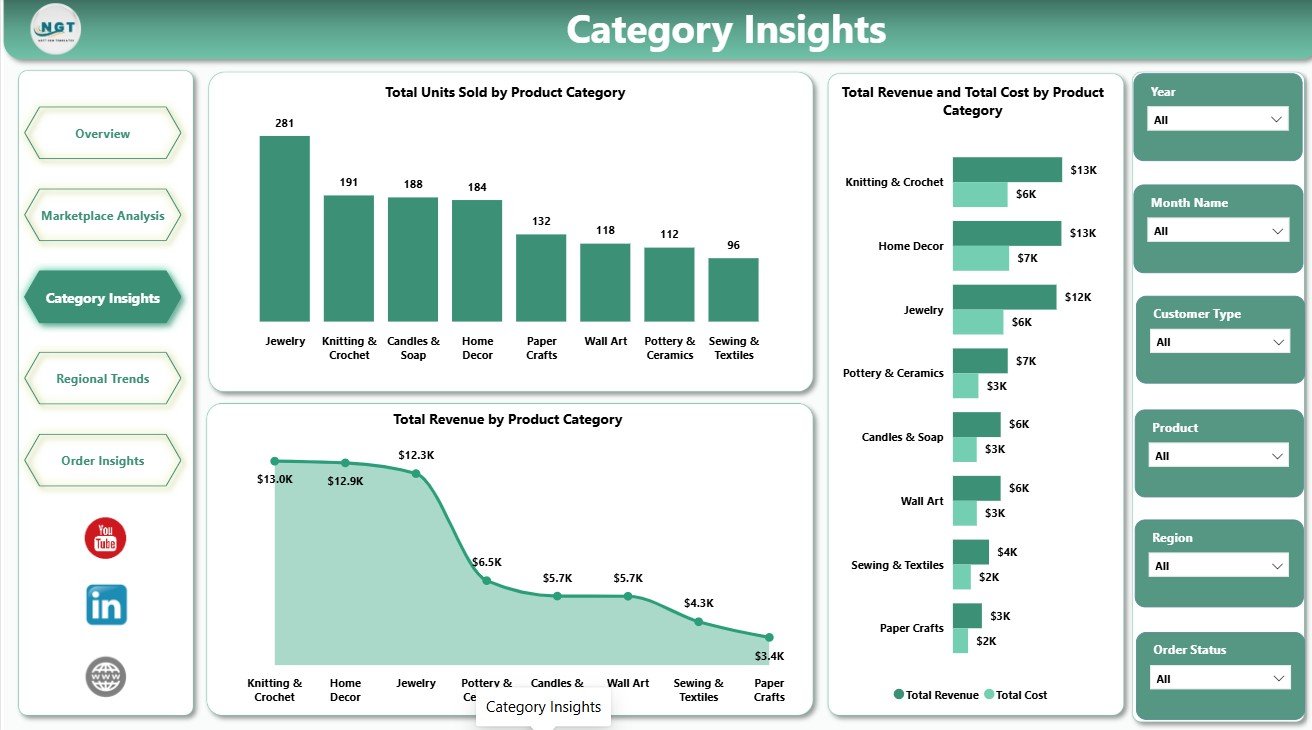
The Category Insights page focuses on product groups. Total Units Sold by Product Category highlights movement, Total Revenue by Product Category shows sales value, and Total Revenue and Total Cost by Product Category helps compare category income against expense.
Category Insights
4. Regional Trends
The Regional Trends page reviews marketplace performance by location. Total Orders by Region shows demand, Total Marketplace Fees by Region shows selling-cost pressure, and Total Revenue and Net Profit by Region compares regional sales with actual profit.
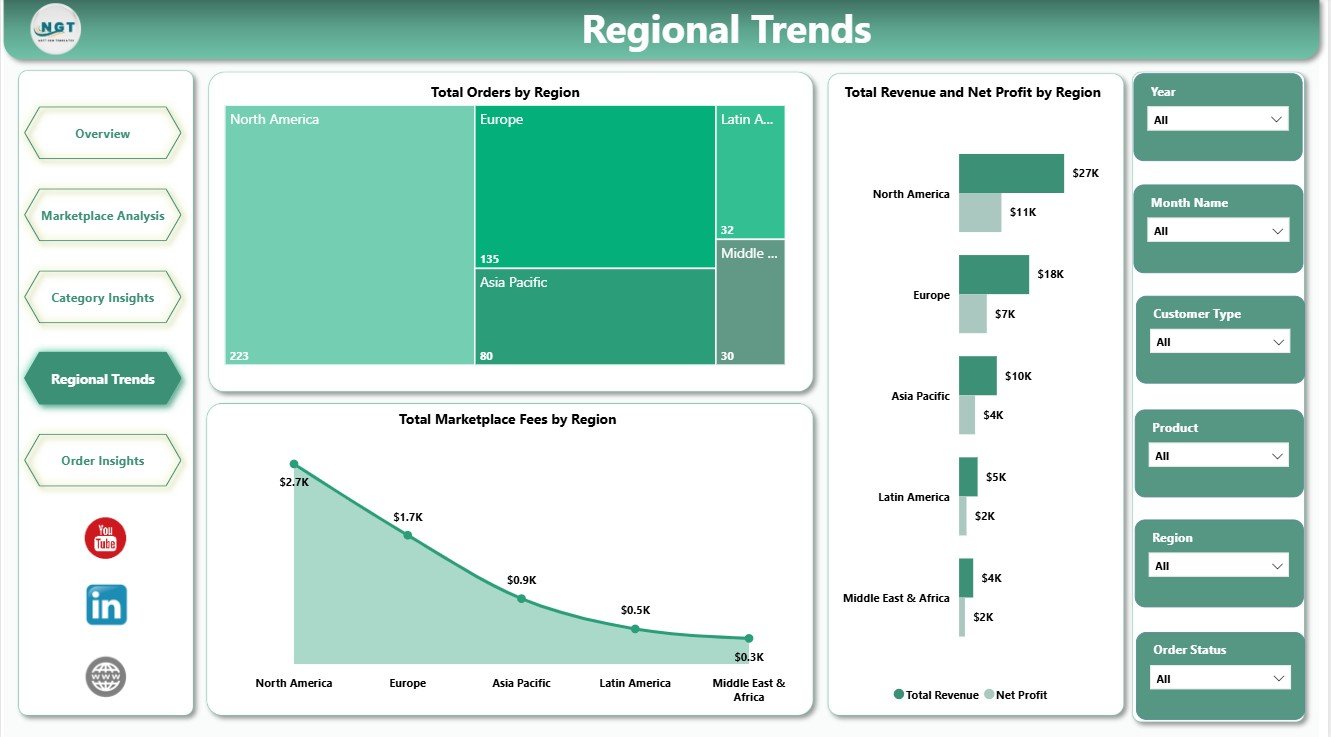
Regional Trends
5. Order Insights
The Order Insights page connects customer behavior and order flow. Total Revenue by Customer Type helps compare new and returning buyers, Total Orders by Month Name shows order trend, and Total Orders by Order Status helps monitor delivery, cancellation, return, or pending-order patterns.
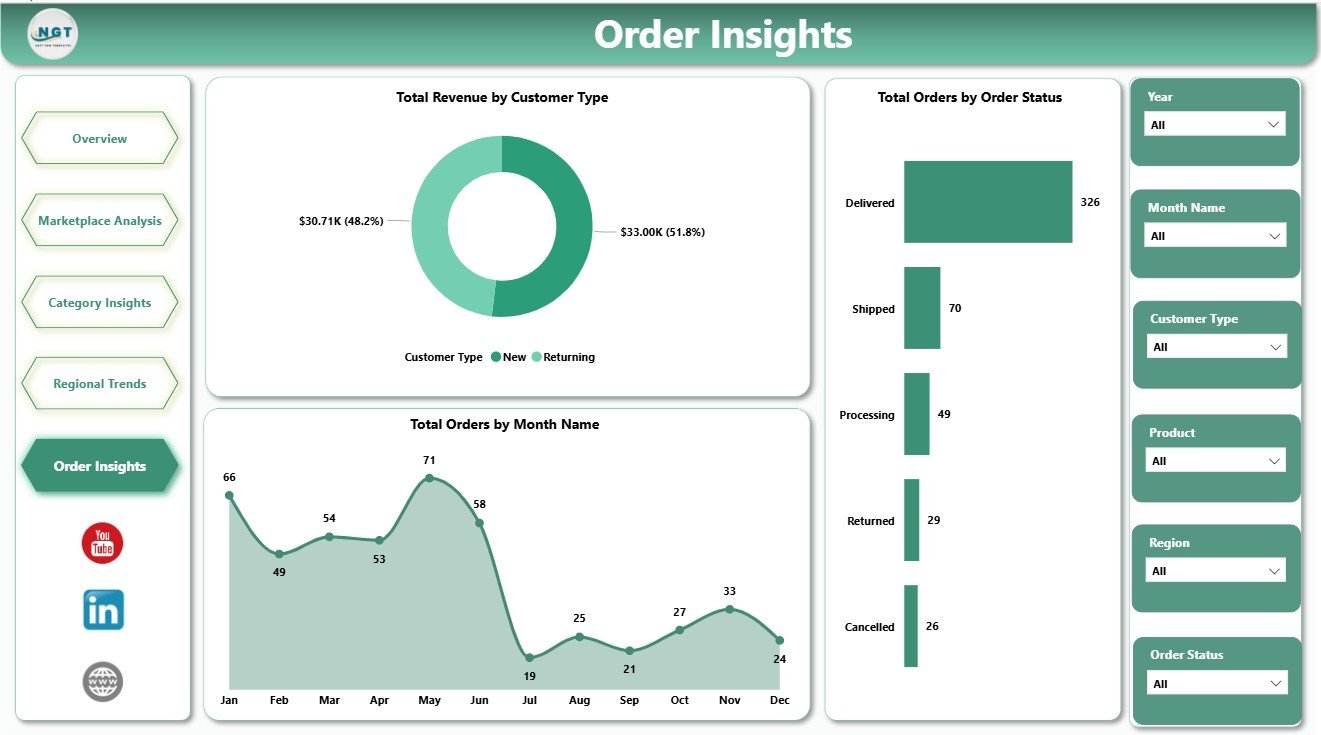
Order Insights
DIY Craft Marketplaces Dashboard in Power BI vs. Tableau vs. Paid Ecommerce SaaS – Where This Fits
| Feature | This Power BI Dashboard | Tableau Alternative | Paid Ecommerce SaaS |
|---|---|---|---|
| Cost | $17.99 one-time | Requires separate licensing | Monthly or annual subscription |
| Platform | Power BI Desktop and Service | Tableau Desktop or Cloud | Vendor cloud platform |
| Setup time | Open PBIX, connect data, refresh | Report must be rebuilt | Requires onboarding and setup |
| Customizable fields | Editable model and visuals | Editable if rebuilt in Tableau | Limited by vendor settings |
| Marketplace profit tracking | Included with ready pages | Manual dashboard build required | Depends on plan and integrations |
| Year-1 cost at 5 users | $17.99 plus any Microsoft licensing you use | Often much higher licensing cost | Often hundreds or thousands |
Who This Template Is For – and Who It’s Not For
Best for: handmade sellers, craft marketplace owners, ecommerce analysts, retail consultants, marketplace operators, and Power BI learners who want a ready visual model for marketplace reporting.
Not for: teams that need live Etsy API sync, automated accounting entries, inventory replenishment, warehouse automation, or a fully governed enterprise Power BI deployment.
How to Use the DIY Craft Marketplaces Dashboard in Power BI
- Download and unzip the file.
- Open the PBIX file in Power BI Desktop.
- Review the sample data structure and report pages.
- Replace or connect your own craft marketplace data source.
- Refresh the report and review KPI cards, charts, and slicers.
- Customize fields, measures, colors, or visuals if needed.
- Publish to Power BI Service if your team wants browser or mobile access.
Real-World Use Cases
Maya, handmade jewelry seller: Maya compares Net Profit by Marketplace and Profit Margin by Marketplace before deciding where to increase paid promotions.
Ravi, ecommerce analyst: Ravi reviews category revenue, category cost, and units sold to recommend product mix changes for the next sales season.
Elena, marketplace consultant: Elena uses regional and order-status visuals during client reviews to explain where returns, fees, or fulfillment delays are hurting profit.
Frequently Asked Questions
What does this Power BI dashboard track?
It tracks orders, revenue, cost, return rate, net profit, marketplaces, product categories, regions, marketplace fees, customer type, monthly orders, and order status.
Do I need Power BI Desktop?
Yes. Open and edit the PBIX file in Power BI Desktop, which is available from Microsoft.
Can I customize the report?
Yes. You can edit visuals, measures, slicers, colors, fields, and page layouts inside Power BI Desktop.
Is this connected live to Etsy or another marketplace?
No. It is a Power BI template. You connect or replace the sample data with your own prepared marketplace data.
Can I publish it for my team?
Yes, you can publish to Power BI Service if your Microsoft licensing supports sharing and workspace access.
Is this a subscription?
No. This is a one-time downloadable template purchase.
About the Author
Built by PK – Microsoft Certified Professional with 15+ years of Excel, Google Sheets, and Power BI experience. Founder of NextGenTemplates, reaching 300K+ subscribers across YouTube channels. Every template is hand-built and tested before release.
Explore Related Templates
Pair this template with DIY Craft Marketplaces Dashboard in Excel, Discount Stores Dashboard in Power BI, and Digital Identity Platforms Dashboard in Power BI. Browse more Power BI Dashboard templates and Power BI templates.
Download the DIY Craft Marketplaces Dashboard in Power BI today and start reviewing marketplace orders, revenue, fees, returns, category performance, regional trends, and net profit from one editable PBIX file.
Last updated: June 2026


Reviews
There are no reviews yet.