


🏋️♂️ Athletic Training Facility KPI Dashboard in Power BI – Maximize Athlete Performance with Smart Data
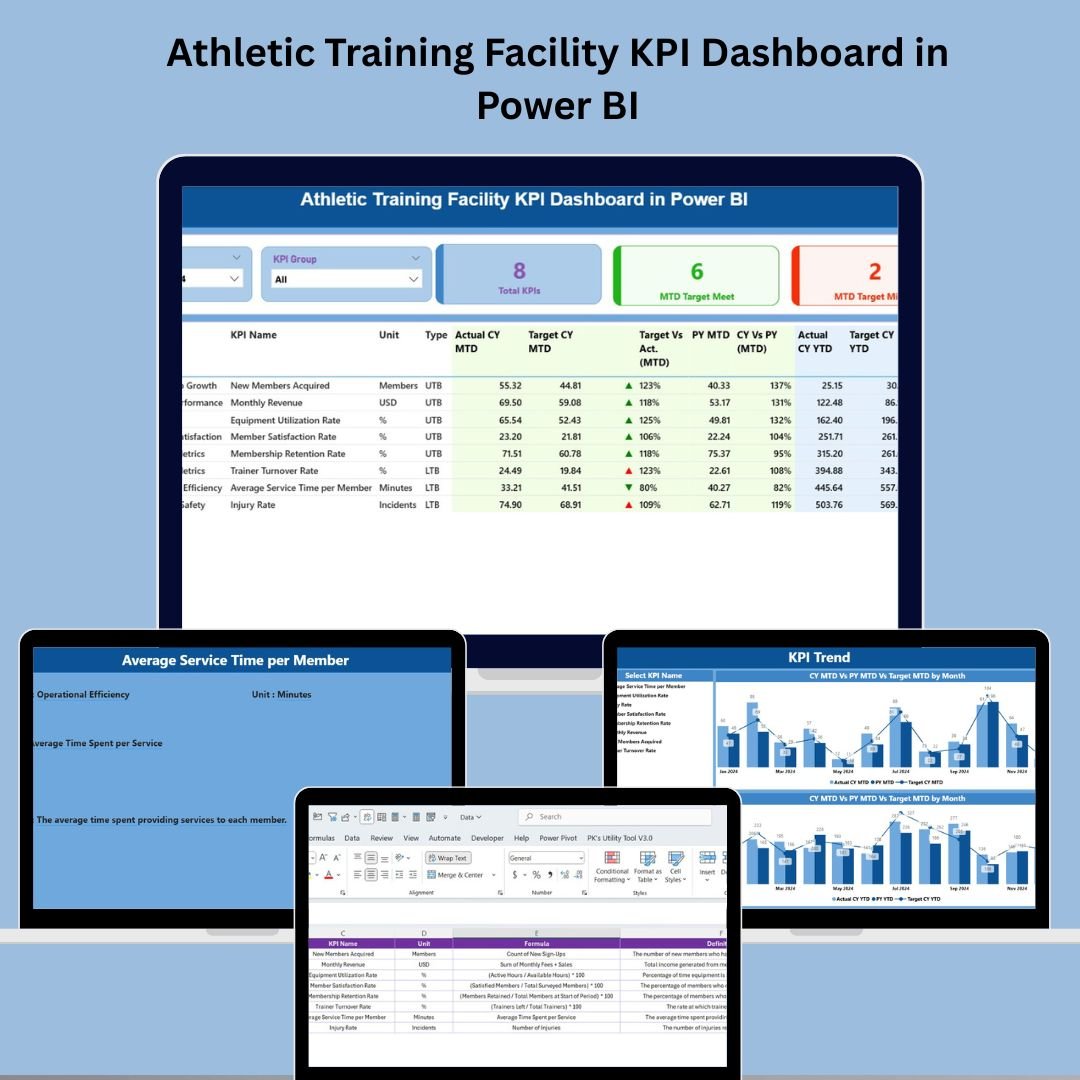
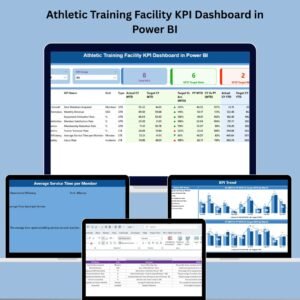
📈 In the world of sports, performance matters—and so does the data behind it. The Athletic Training Facility KPI Dashboard in Power BI is a powerful, interactive solution built to help coaches, sports scientists, rehab specialists, and athletic managers monitor, track, and improve performance across all facets of an athletic training facility.
This ready-to-use dashboard integrates seamlessly with Excel, making data updates easy while delivering professional-level visuals and analytics in Power BI.
📊 Key Features
🔹 1. Summary Page – Instant KPI Overview
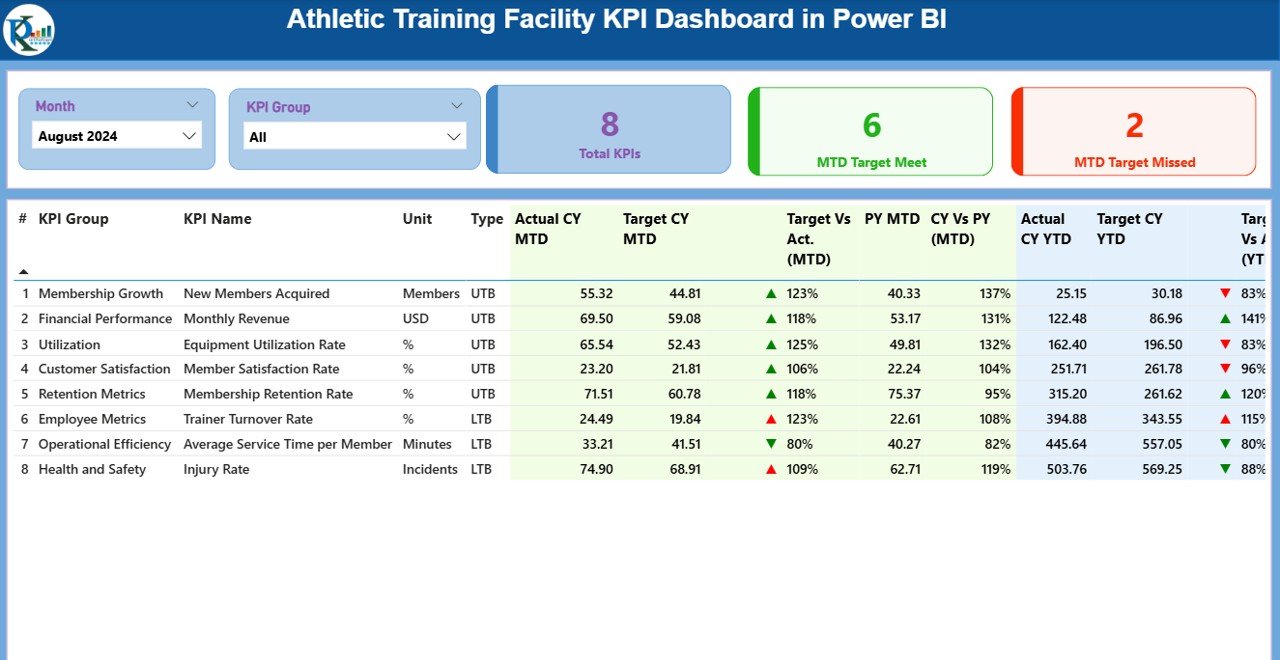
🎯 Two slicers: Filter by Month and KPI Group (e.g., Rehab, Strength, Nutrition)
📋 Cards: Total KPIs Tracked, MTD Target Met, MTD Target Missed
🧠 Visual cue-driven design to assess performance immediately
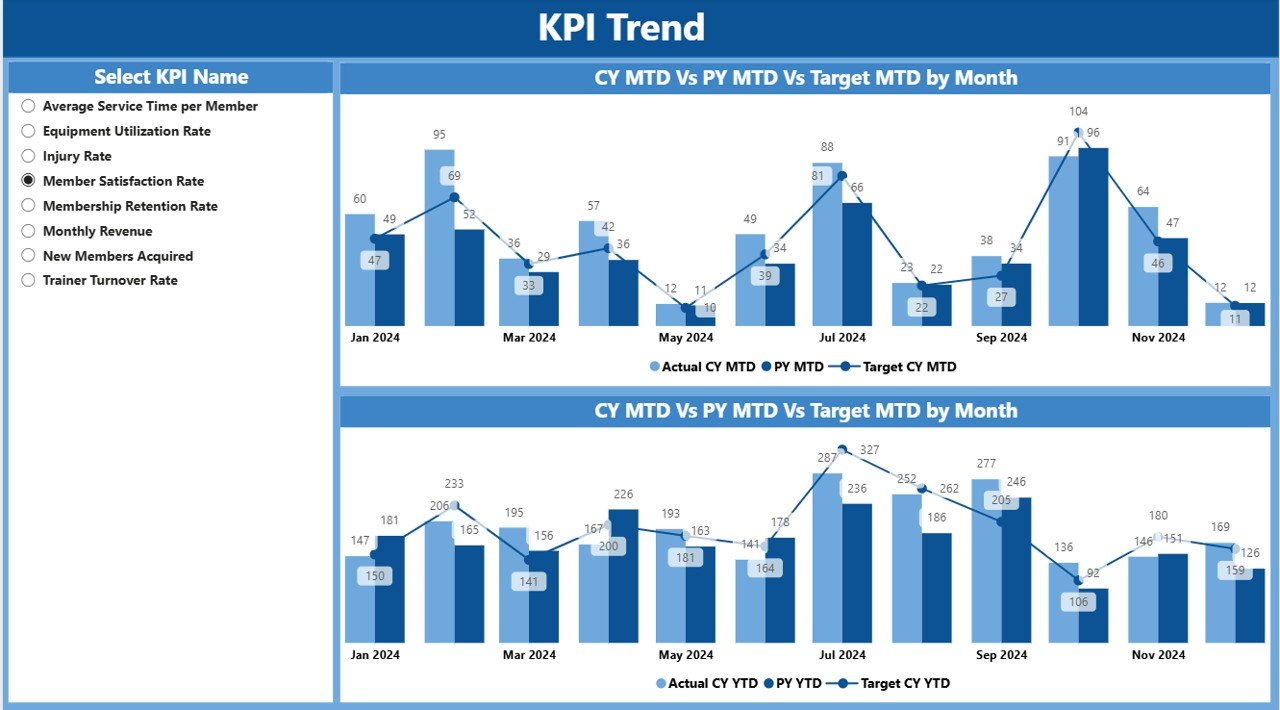
📉 2. KPI Trend Page – Visualize Over Time
📅 Combo charts show Actual vs Target vs Previous Year
🔍 Slice by individual KPIs to track progress and identify trends
🧬 Great for understanding seasonal patterns, setbacks, or breakthroughs
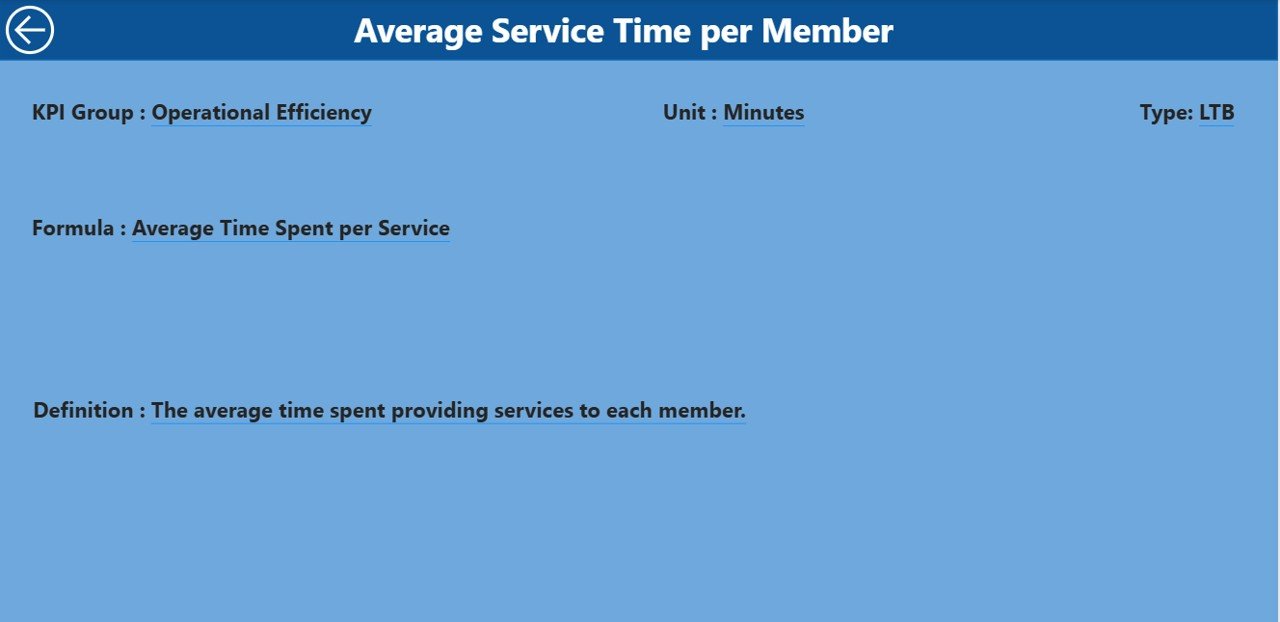
📘 3. KPI Definition Page – Drill-through Insights
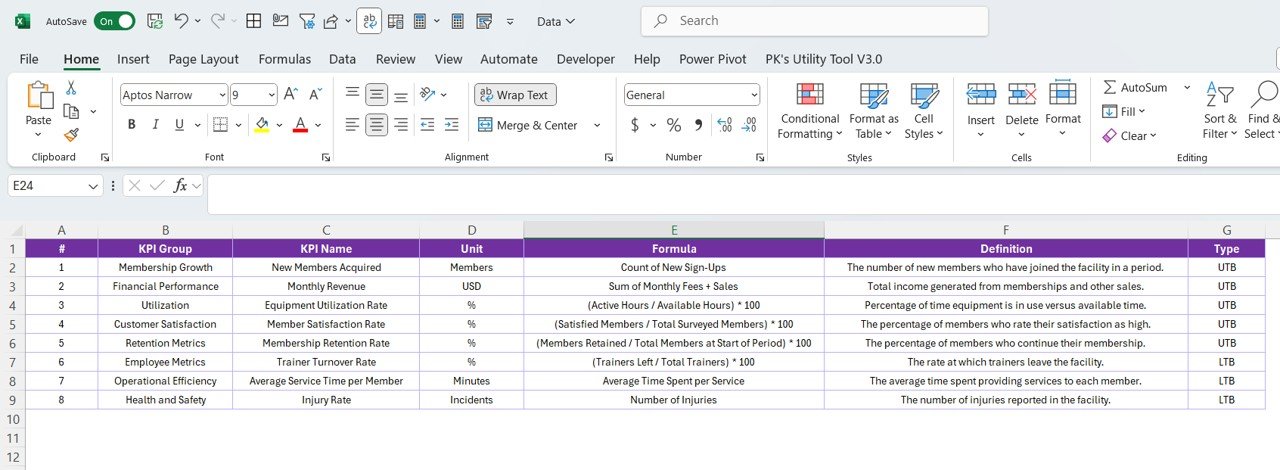
🧾 View KPI Name, Group, Formula, Unit, and Type (UTB/LTB)
🔍 Clarifies what each KPI means and how it’s calculated
💡 Empowers teams with a shared understanding of performance metrics
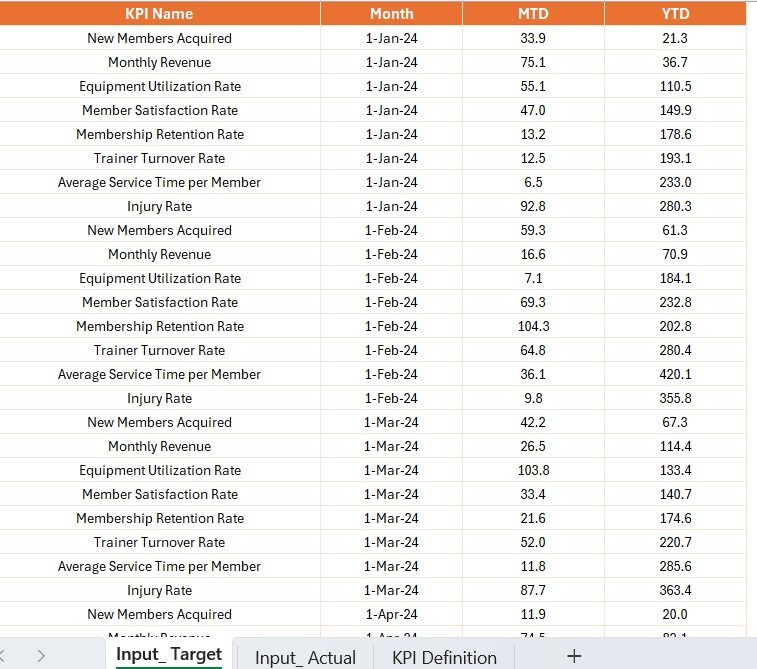
🧮 4. Excel-Based Data Source – Easy to Manage
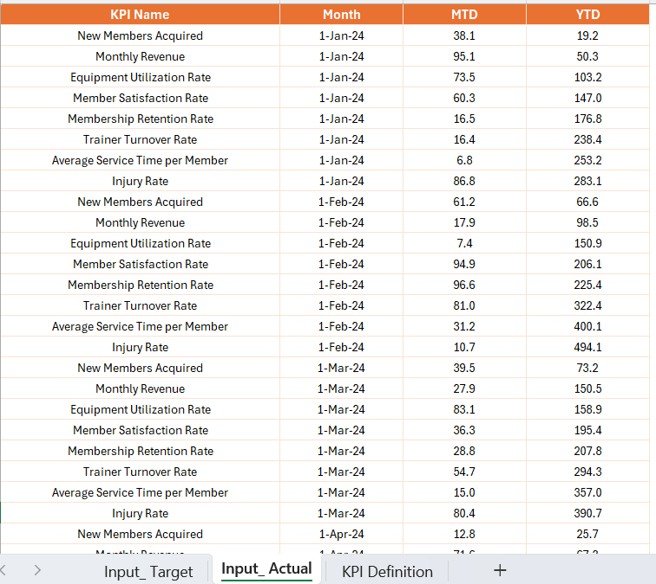
📂 Input_Actual: Enter MTD/YTD actual values for each KPI
📂 Input_Target: Log monthly/annual performance targets
📂 KPI_Definition: Define every metric—name, group, unit, formula, UTB/LTB type
No Power BI expertise required—just update the Excel sheets and refresh the dashboard!
✅ Advantages of This Dashboard
📊 Crystal-Clear Performance Visualization
Use cards, charts, and color cues to assess KPI performance instantly🏃♂️ Enhanced Athlete Monitoring
Spot rehab delays, nutrition gaps, or training inefficiencies in real time🧠 Data-Driven Decision Making
Align your strategy with actual performance—not guesswork⏱️ Save Time on Reports
No manual calculations—just update Excel, and Power BI does the rest🤝 Team-Wide Collaboration
Let strength coaches, nutritionists, and rehab staff focus on what matters most
📌 What’s Inside?
✅ Power BI (.pbix) file with dynamic visuals
✅ Excel input sheets: Actual, Target, KPI Definition
✅ Pre-built Summary, Trend, and Definition Pages
✅ Sample KPIs and data
✅ Instructions for refresh and customization
👥 Who Is This For?
🏋️ Strength & Conditioning Coaches
🧑⚕️ Physical Therapists & Rehab Staff
🧪 Sports Scientists
🏆 Athletic Performance Directors
🏫 School & College Athletic Departments
🏟️ Sports Academies & Training Centers
Whether you track VO2 max or compliance with therapy sessions, this dashboard adapts to your facility.
💡 Best Practices for Using This Dashboard
📅 Update your Excel data monthly to ensure trends are accurate
🔐 Set permissions to protect sensitive data
🧾 Define KPIs clearly using consistent units and formulas
📊 Leverage trend visuals to guide training or rehab strategies
🔄 Review and refine targets quarterly for optimal results
🎬 Watch a Step-by-Step Tutorial
📺 YouTube.com/@PKAnExcelExpert
🔗 Click here to read the Detailed blog post
Watch the step-by-step video tutorial:
Compatibility and Requirements
- Built for Power BI Desktop, which is free. Get it from Microsoft: Get Power BI Desktop.
- Data comes from three Excel sheets: Input_Actual, Input_Target and KPI_Definition. Update them and refresh the dashboard.
Frequently Asked Questions
Which pages does the report have?
A Summary page, a KPI Trend page and a KPI Definition drill-through page.
What can I filter by?
The Summary page has two slicers: Month and KPI Group, such as Rehab, Strength or Nutrition.
What do the cards show?
Total KPIs Tracked, MTD Target Met and MTD Target Missed.
What is in the download?
The Power BI (.pbix) file, the Excel input sheets, sample KPIs and data, and instructions for refresh and customization.
Is there an Excel or Google Sheets version?
Yes. See the Athletic Training Facility KPI Dashboard in Excel and the Athletic Training Facility KPI Dashboard in Google Sheets.
Related Sports and Fitness Templates
- Athletic Training Facility KPI Dashboard in Excel: the same KPIs in Excel
- Athletic Training Facility KPI Dashboard in Google Sheets: the Google Sheets edition
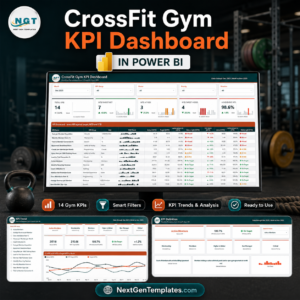
- CrossFit Gym KPI Dashboard in Power BI: KPIs for CrossFit gyms
- Gym Fitness Business Dashboard in Power BI: a business view for gyms
- Power BI Dashboard Mega Collection: 15 Power BI templates in one download
Browse all Power BI KPI dashboards.































Reviews
There are no reviews yet.