

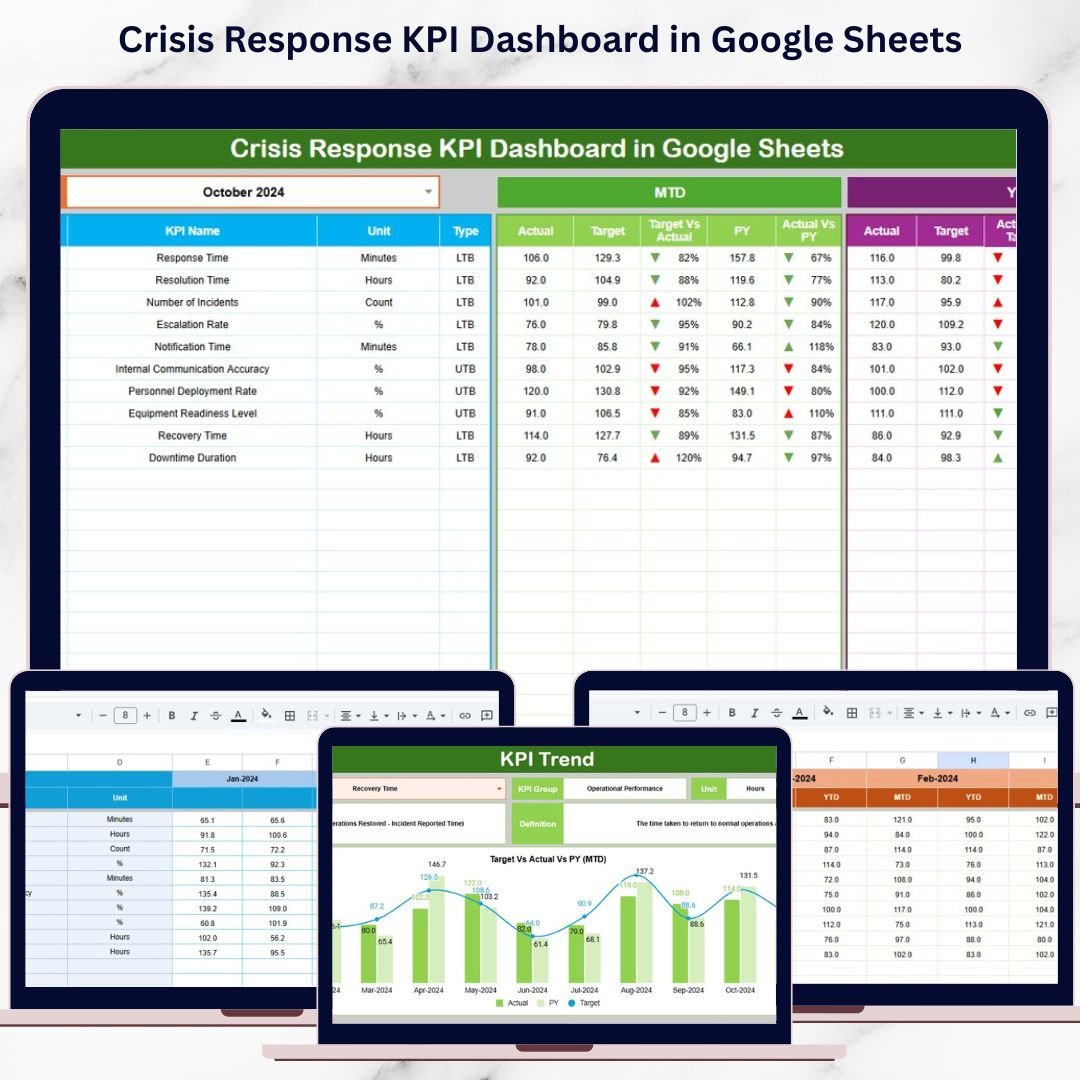



In today’s unpredictable environment, organizations face crises more frequently than ever—ranging from IT outages and cybersecurity incidents to natural disasters, safety events, and operational disruptions. During such situations, leadership teams must act fast, coordinate effectively, and make decisions based on accurate information. However, many organizations still rely on fragmented spreadsheets, emails, or delayed reports. As a result, response efforts slow down, accountability weakens, and risks increase.
That is exactly why the Crisis Response KPI Dashboard in Google Sheets becomes a mission-critical solution.
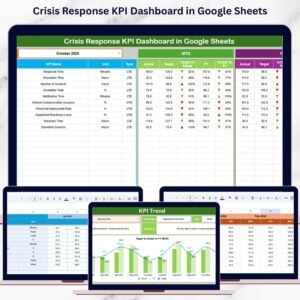
This ready-to-use dashboard provides a structured, KPI-driven system to monitor crisis response performance in real time. It helps organizations track response speed, resolution effectiveness, preparedness levels, and recovery outcomes using clear metrics, automated calculations, and trend analysis. Instead of reacting blindly during emergencies, teams gain visibility, control, and confidence—all from a single Google Sheets dashboard.
Because it is built in Google Sheets, the dashboard is easy to access, collaborative, and cost-effective—without the need for complex software.
✨ Key Features of the Crisis Response KPI Dashboard in Google Sheets
🚦 1. MTD & YTD Crisis Performance Tracking
Monitor Month-to-Date and Year-to-Date performance for every crisis KPI. A simple month selection instantly updates the entire dashboard.
🎯 2. Target vs Actual & Previous-Year Comparison
Measure actual response performance against predefined targets and historical benchmarks to identify gaps and improvements.
📈 3. Visual Performance Indicators
Conditional formatting arrows provide instant clarity:
🟢 Green arrow → improving response performance
🔴 Red arrow → delays or performance decline
📉 4. KPI Trend Analysis
Understand how response metrics evolve over time. Identify recurring issues, bottlenecks, and readiness gaps before the next crisis occurs.
☁️ 5. Google Sheets-Based & Collaborative
Enable real-time collaboration among risk teams, operations, IT, compliance, and leadership—using one shared source of truth.
📦 What’s Inside the Crisis Response KPI Dashboard in Google Sheets
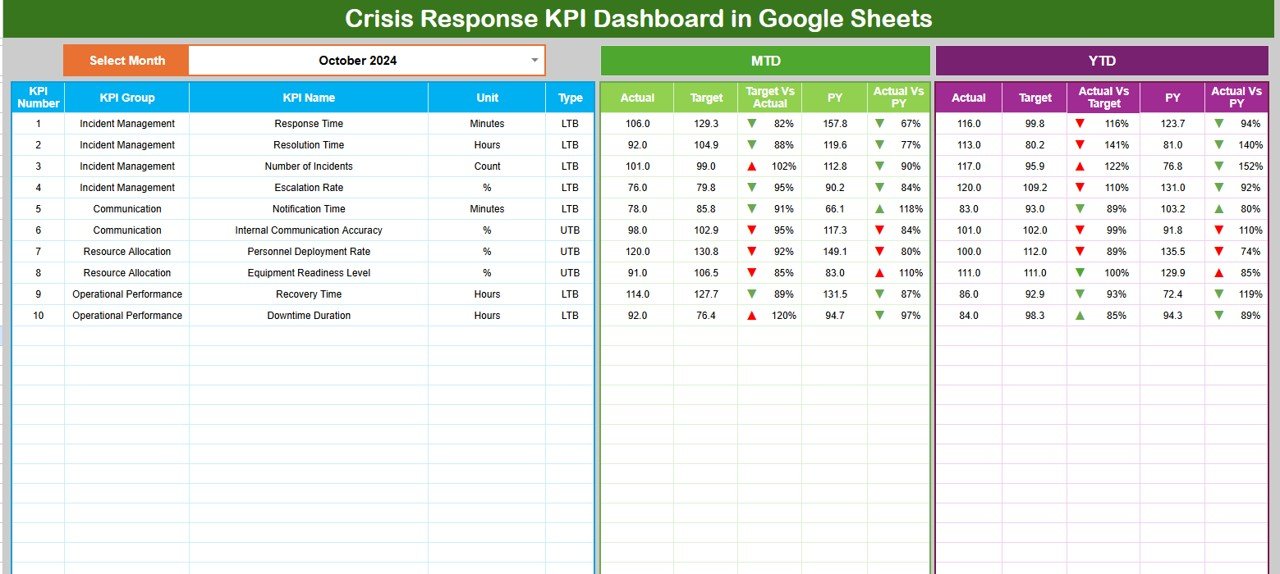
🖥️ Dashboard Sheet Tab (Main Control Panel)
This is the primary page used during crisis reviews, drills, and audits.
Month Selector
Located in cell D3
Automatically refreshes all KPIs when the month changes
MTD Metrics Displayed
Actual
Target
Previous Year
Target vs Actual
Previous Year vs Actual
YTD Metrics Displayed
Actual
Target
Previous Year
Target vs Actual
Previous Year vs Actual
This layout ensures leadership has instant clarity during critical moments.
📊 KPI Trend Sheet Tab
This sheet enables deep-dive analysis for individual KPIs.
How It Works
Select a KPI from the dropdown in cell C3
Details Displayed
KPI Group
KPI Unit
KPI Type (LTB / UTB)
KPI Formula
KPI Definition
Trend Visualization
Month-wise KPI movement
Performance fluctuations
Early warning signs
This sheet is ideal for post-incident reviews and preparedness assessments.
📋 Actual Number Sheet Tab
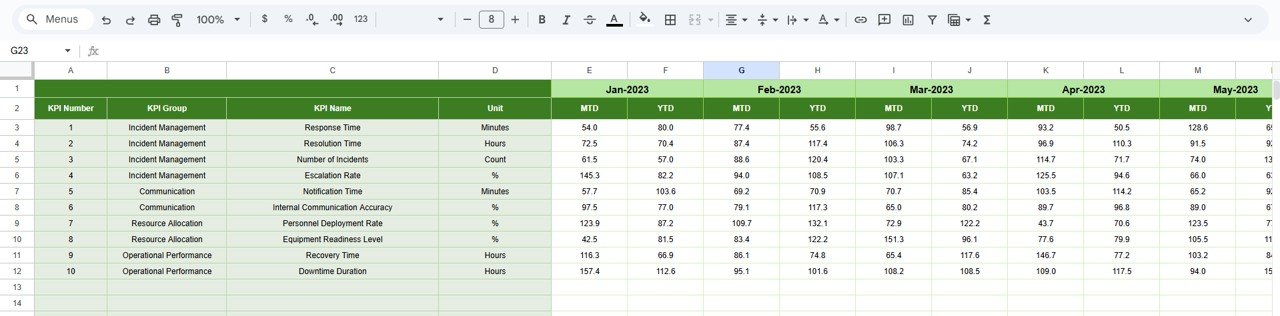
This is the structured data-entry sheet.
Enter monthly MTD Actual values
Enter YTD Actual values
Define the first month of the year in cell E1
All calculations and dashboard visuals update automatically.
🎯 Target Sheet Tab
This sheet stores expected response benchmarks.
Monthly (MTD) targets
Annual (YTD) targets
Targets support accountability and performance alignment across teams.
📆 Previous Year Number Sheet Tab
Stores historical KPI data to support:
Year-over-year analysis
Crisis response maturity assessment
Continuous improvement tracking
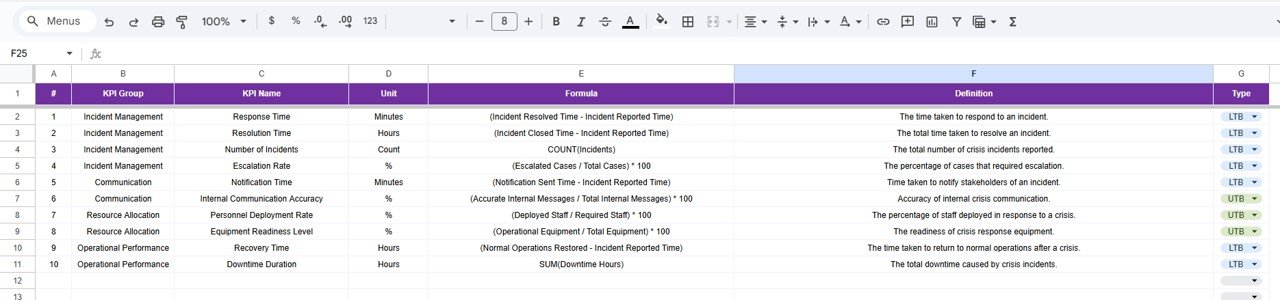
📘 KPI Definition Sheet Tab
This is the governance backbone of the dashboard.
It contains:
KPI Name
KPI Group
Unit
Formula
KPI Definition
KPI Type (LTB / UTB)
This ensures consistency, clarity, and audit readiness.
🎯 Who Can Benefit from This Crisis Response KPI Dashboard
🛡️ Risk & Resilience Teams
Monitor response effectiveness and preparedness levels.
⚙️ Operations & IT Teams
Track resolution speed, downtime impact, and recovery quality.
🔐 Security & Compliance Teams
Support audits, drills, and regulatory reviews with structured data.
🏢 Executive Leadership
Gain real-time visibility into crisis readiness and performance.
🚑 Emergency & Safety Teams
Use KPIs to strengthen response coordination and planning.
### Click here to read the Detailed blog post
Watch the step-by-step video tutorial:
Visit our YouTube channel to learn step-by-step video tutorials — Youtube.com/@NeotechNavigators
Compatibility and Requirements
- Works in Google Sheets. You need a free Google account and a web browser.
- You pick the month from a dropdown on the Dashboard sheet and the KPI from a dropdown on the KPI Trend sheet. Google explains dropdowns in Create an in-cell dropdown list.
Frequently Asked Questions
Which sheets are included?
Six sheets: Dashboard, KPI Trend, Actual Number, Target, Previous Year Number and KPI Definition.
How do I update the dashboard?
Enter your MTD and YTD actual values in the Actual Number sheet and set the first month of the year in cell E1. Add your goals in the Target sheet. Then choose a month in cell D3 on the Dashboard sheet and everything refreshes.
Can I compare this year with last year?
Yes. Store last year’s figures in the Previous Year Number sheet. The Dashboard shows Previous Year and Previous Year vs Actual for both MTD and YTD.
How do I see the trend for one KPI?
Open the KPI Trend sheet and select a KPI from the dropdown in cell C3. It shows the KPI group, unit, type (LTB or UTB), formula and definition, plus the month-wise movement.
Is there an Excel or Power BI version?
Yes. See the Crisis Response KPI Dashboard in Excel and the Crisis Response KPI Dashboard in Power BI.
Related Crisis and Incident Response Templates
- Crisis Response KPI Dashboard in Excel: the same dashboard in Excel
- Crisis Response KPI Dashboard in Power BI: the Power BI edition
- Crisis Management KPI Dashboard in Google Sheets: a Google Sheets dashboard for crisis management metrics
- Cyber Incident Response KPI Dashboard in Google Sheets: KPIs for cyber incident response
- Emergency Response Plan Checklist in Google Sheets: a checklist for your emergency response plan
Browse all Google Sheets KPI dashboards.






























Reviews
There are no reviews yet.