

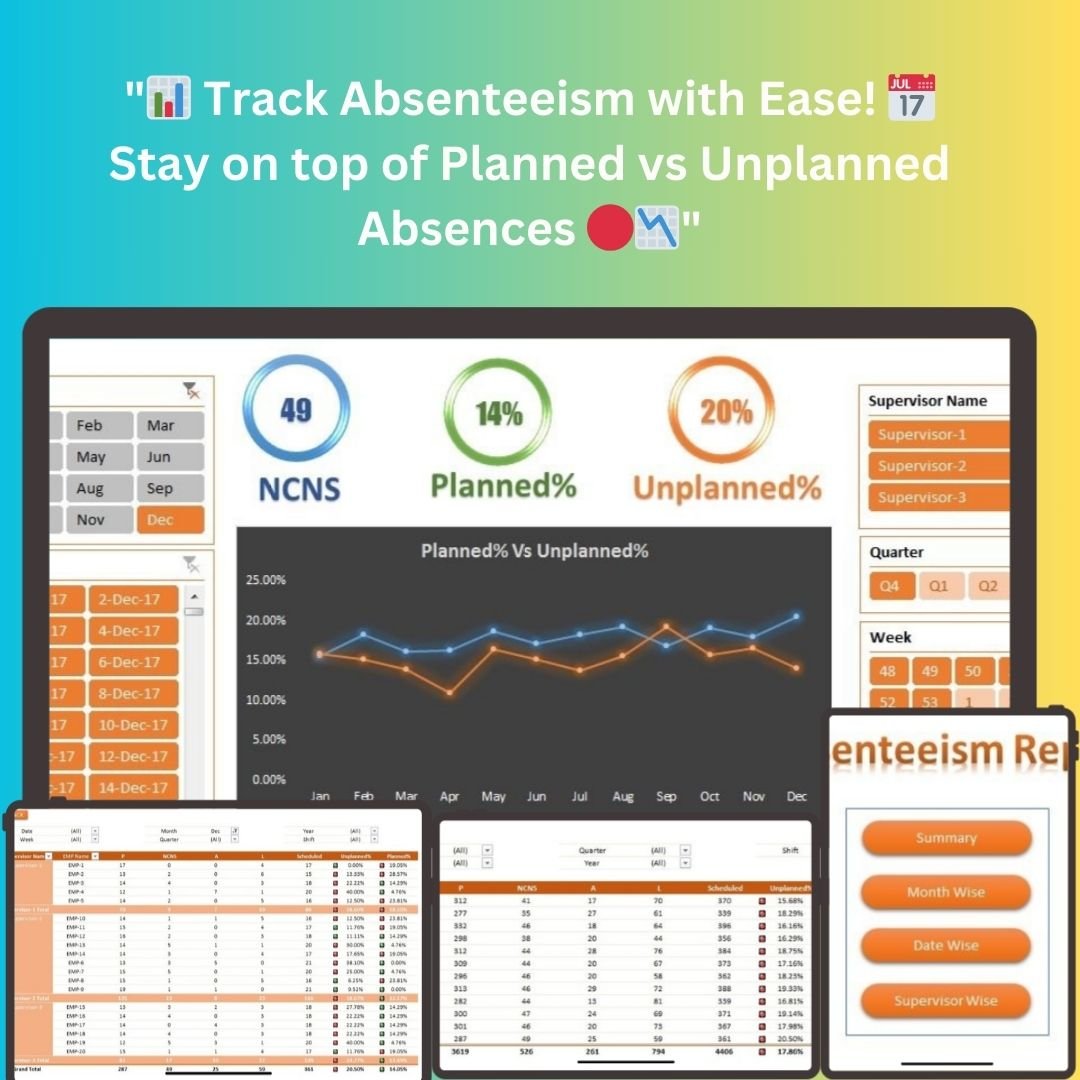

The Absenteeism Report in Excel is a ready-made template for tracking and managing employee attendance. It is built for HR teams, operational managers and senior leadership who need to compare planned vs unplanned absences, monitor No Call No Show (NCNS) cases and spot attendance trends. You get a clear monthly, weekly and supervisor-wise view of absenteeism without sifting through large datasets by hand.
Key Features of the Excel Absenteeism Report
- Interactive Index: An Index sheet lets you jump quickly between the summary, monthly reports, weekly data and supervisor-specific insights. You can find the data you need without scrolling through large tables.
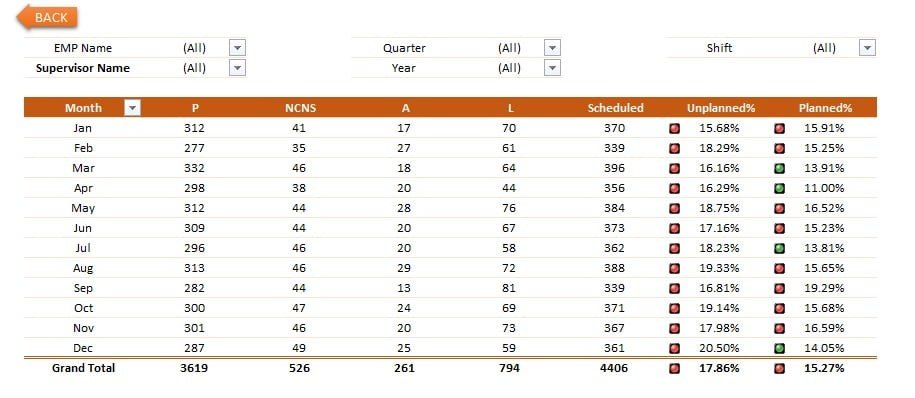
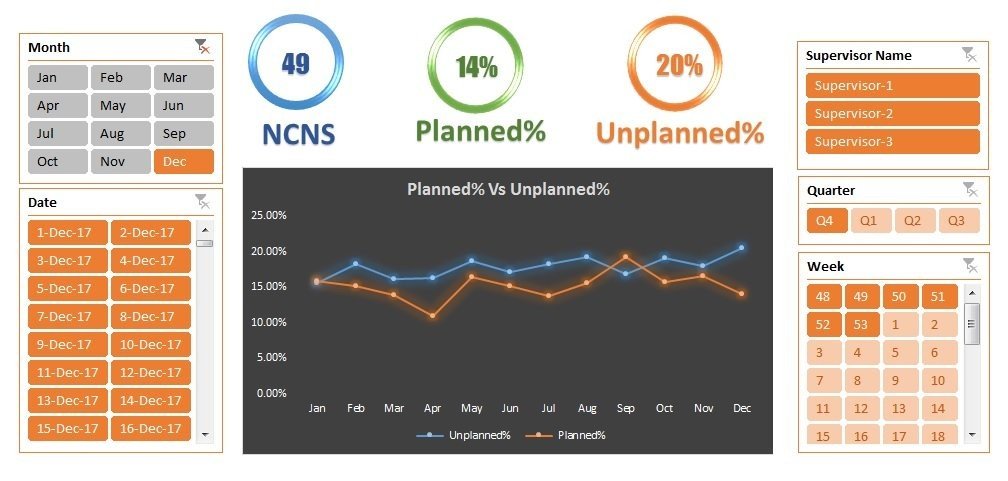
- Monthly Comparison Dashboard: Compare planned vs unplanned absences month by month. This helps you assess absenteeism patterns and plan for staffing requirements.
- Real-time NCNS tracking: No Call No Show (NCNS) data is tracked alongside planned and unplanned absences, so the figures stay up to date as you add records.
- Dynamic Slicers for Data Filtering: Filter the report by Month, Date, Supervisor, Quarter and Week. You can tailor each view to a specific need or business condition.
- Traffic Light Indicators: Conditional formatting colour-codes absence percentages against target thresholds, such as 12% for unplanned absences and 15% for planned absences. You can see at a glance how attendance is tracking against company benchmarks.
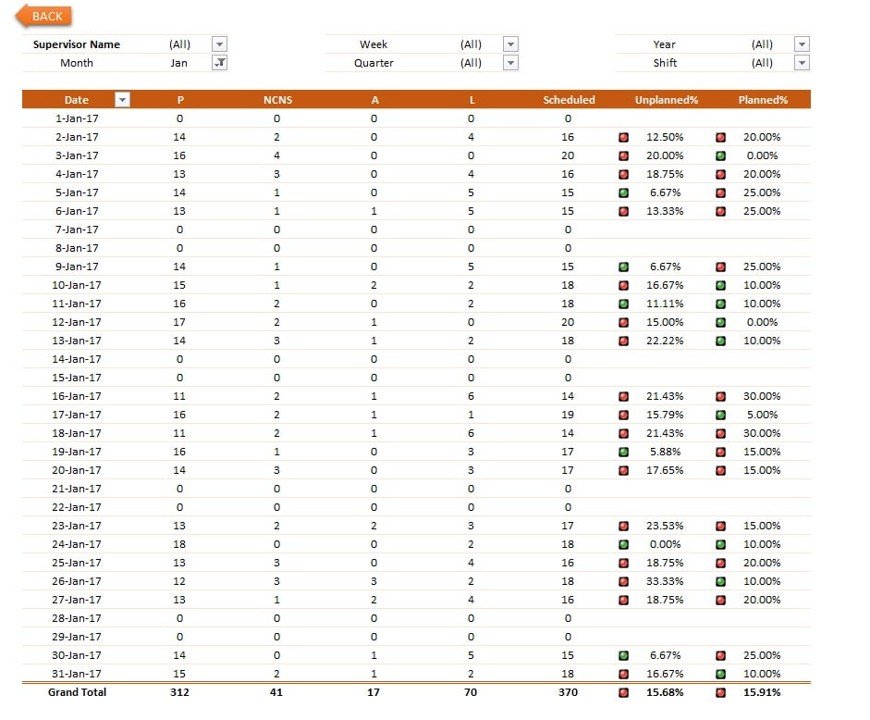
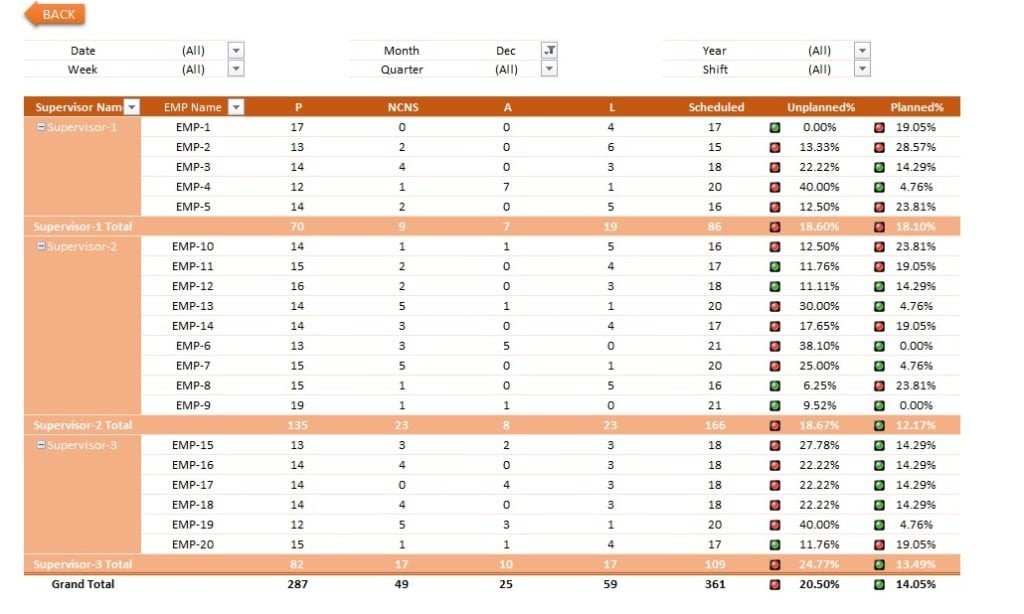
- Detailed Pivot Tables: Attendance metrics are organised by Month, Week and Supervisor. Pivot tables show Present, Absent and Leave counts, so you can assess absenteeism at both individual and departmental levels.
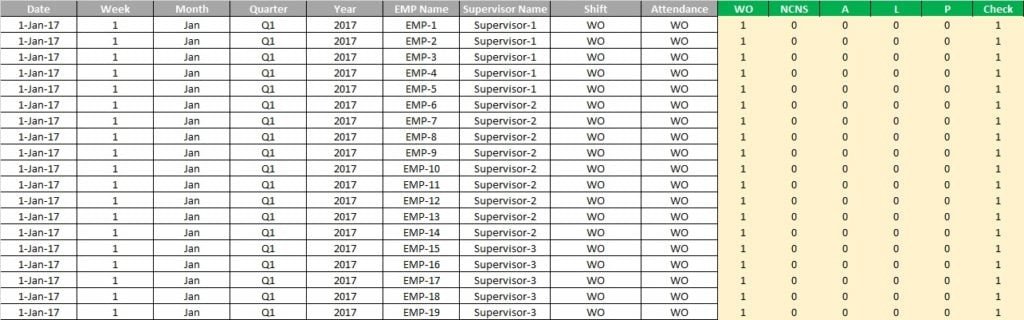
- Raw Data Management: A structured data sheet makes input easy, and key fields are calculated automatically. Automated calculations reduce manual errors and keep the report accurate.
- Customizable Views: Adjust the slicers to look at absenteeism in different formats and time periods.
- Enhanced Reporting: Review attendance performance over time, broken down by different criteria.
- User-Friendly Interface: Simple navigation designed for HR and operational teams.
What’s Inside the Template
| Section | What it does |
|---|---|
| Index | Navigation hub linking to the summary, monthly, weekly and supervisor-wise views |
| Monthly Comparison Dashboard | Planned vs unplanned absences and NCNS figures by month, with traffic light indicators against target thresholds |
| Monthly, Weekly and Supervisor Views | Pivot tables showing Present, Absent and Leave counts, filtered with slicers for Month, Date, Supervisor, Quarter and Week |
| Raw Data Sheet | Structured input sheet with automatic calculation of fields that feeds every report |
Who This Absenteeism Report Is For
- HR teams who need an accurate overview of employee attendance and absenteeism.
- Operational managers who plan resources and staffing around expected and unexpected absences.
- Supervisors who want to review attendance for their own team members.
- Senior leadership who monitor attendance data to improve overall organisational performance.
The Absenteeism Report in Excel gives you an accurate overview of employee attendance. That supports better resource planning and helps you spot trends or patterns that need attention. It makes HR reporting more efficient and helps you make better-informed decisions about workforce management.
How to Use the Absenteeism Report in Excel
- Enter your data: Add employee attendance records to the structured raw data sheet. Fields are calculated automatically.
- Open the Index: Use the Index sheet to go to the summary, monthly, weekly or supervisor-wise view.
- Filter with slicers: Choose a Month, Date, Supervisor, Quarter or Week to focus the report.
- Review the indicators: Check the traffic light colours to see where planned or unplanned absence percentages are above or below target.
- Act on insights: Use the Present, Absent, Leave and NCNS figures to plan staffing and follow up on attendance issues.
Watch the step-by-step video tutorial:
Click here to read the detailed blog post
Visit our YouTube channel to learn from step-by-step video tutorials: Youtube.com/@PKAnExcelExpert
Frequently Asked Questions
What does the Absenteeism Report in Excel track?
It tracks employee attendance, including planned and unplanned absences, No Call No Show (NCNS) cases, and Present, Absent and Leave counts. You can view the data by Month, Week and Supervisor.
Can I compare planned vs unplanned absences?
Yes. The Monthly Comparison Dashboard compares planned vs unplanned absences month by month, alongside NCNS tracking.
How do the traffic light indicators work?
Conditional formatting colour-codes absence percentages against pre-defined target thresholds, such as 12% for unplanned absences and 15% for planned absences. You can see straight away whether attendance is on track.
How can I filter the report?
Dynamic slicers let you filter by Month, Date, Supervisor, Quarter and Week. This gives you customised views of absenteeism.
Do I need to calculate anything manually?
No. You enter records in the structured raw data sheet and fields are calculated automatically. This reduces manual errors and keeps the Excel absenteeism report up to date.
Is there a tutorial for this template?
Yes. A step-by-step video tutorial is embedded above, and a detailed blog post is linked on this page.
Also check our Download Attachments from Multiple Emails Automatically using VBA
Last updated: October 2026
Compatibility and Requirements
- Works in Microsoft Excel desktop (Excel 2016 or later, or Microsoft 365).
- The report uses pivot tables and slicers. Microsoft’s guide Use slicers to filter data shows how slicers filter the data.
Related Attendance Templates
- Attendance and Overtime Dashboard in Excel: add overtime to the attendance view
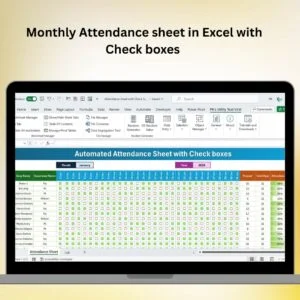
- Monthly Attendance Sheet in Excel with Check boxes: a free sheet for daily attendance
- Employee Attendance Tracker in Google Sheets: track attendance in the browser
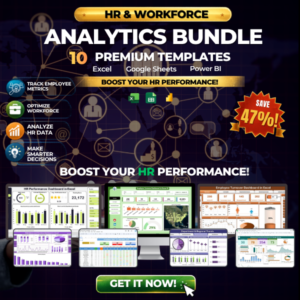
- HR & Workforce Analytics Bundle: 10 HR templates in one bundle
Browse all HR and Payroll templates or the Excel report templates.







Reviews
There are no reviews yet.