

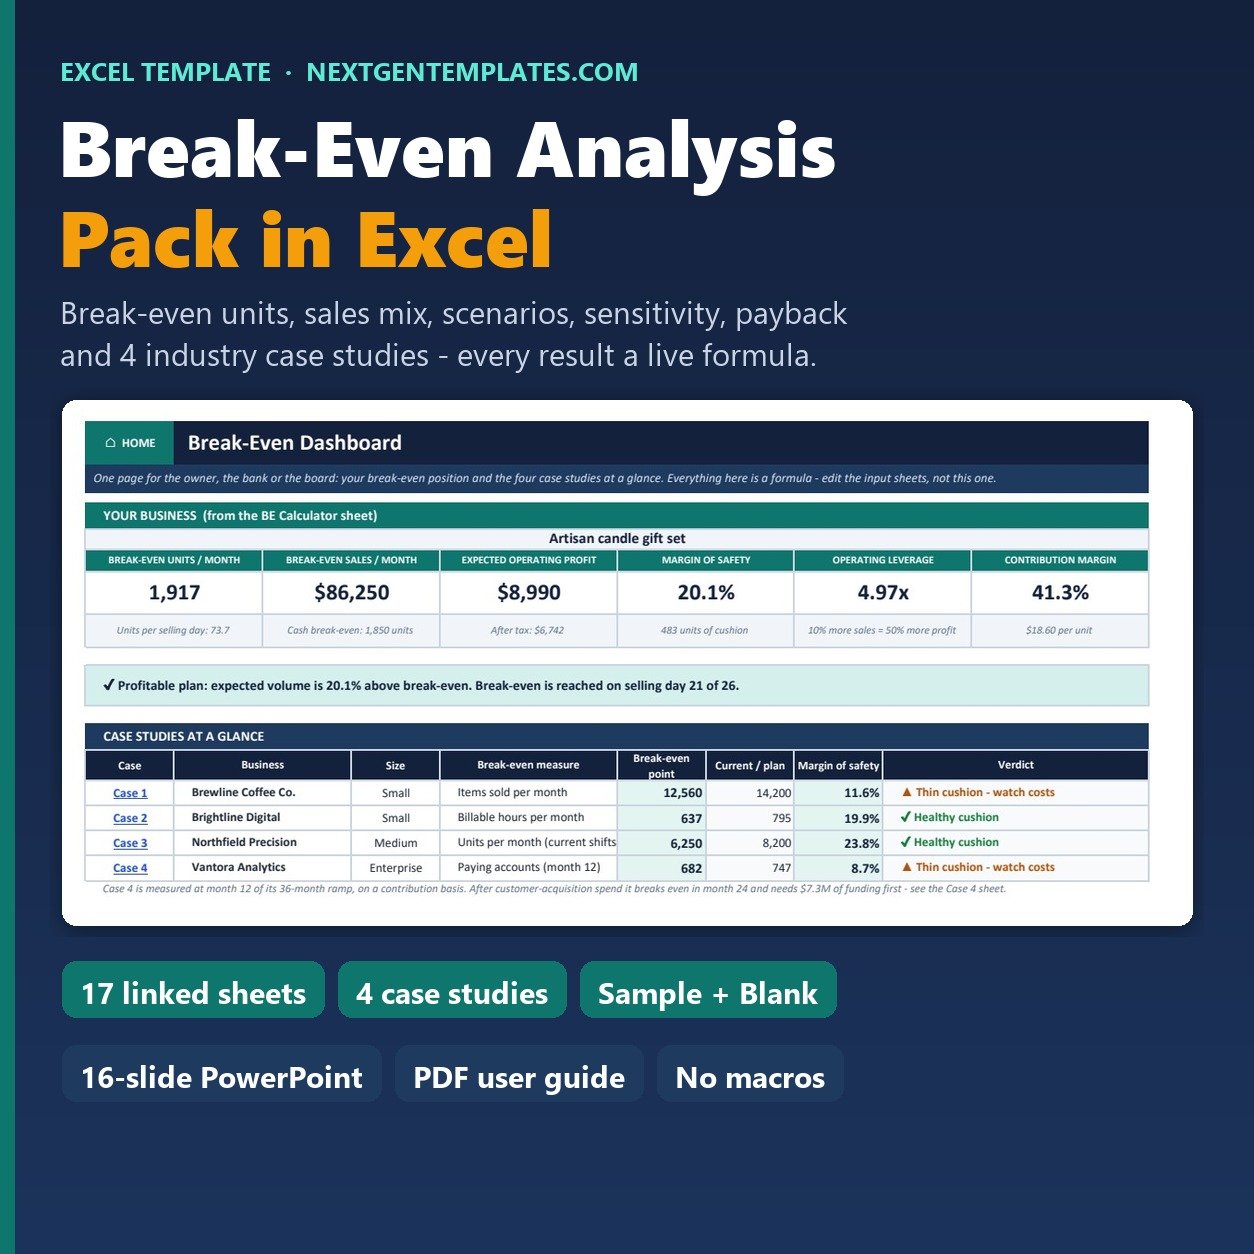
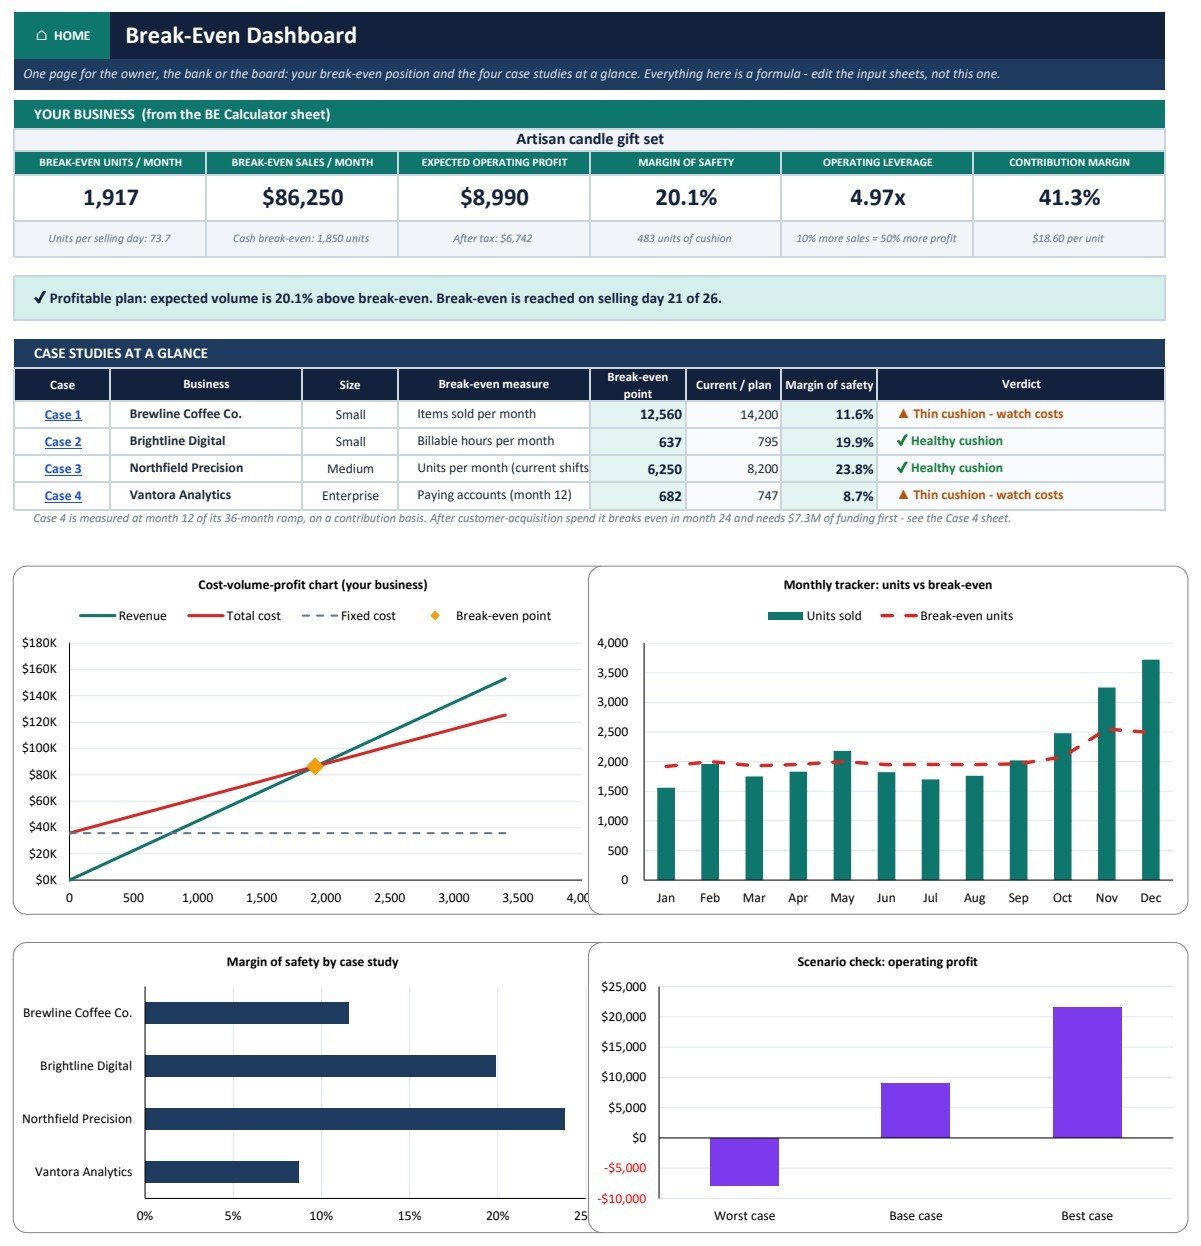
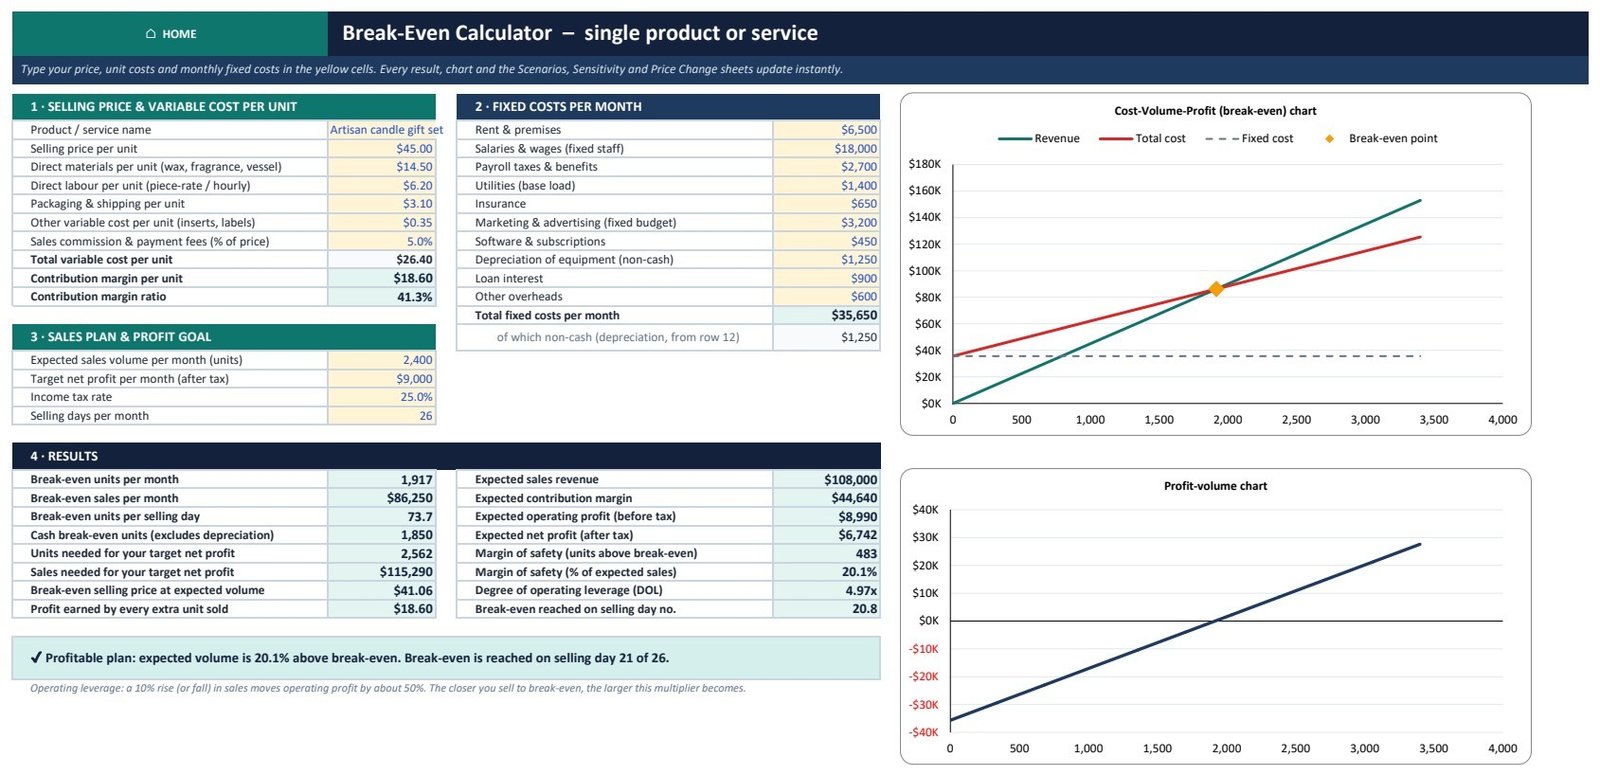
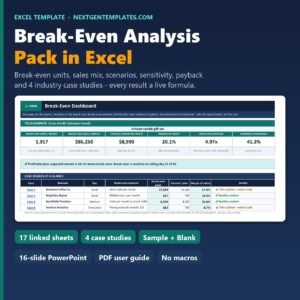
The Break-Even Analysis Pack in Excel answers the question every owner, analyst and lender asks first: how many units, customers, billable hours or subscribers does this business need before it stops losing money? The pack contains a 17-sheet workbook, delivered in a Sample edition and a Blank edition, a 16-slide editable PowerPoint deck and a 9-page PDF user guide. Every result is a live Excel formula, with no macros and no add-ins. In the sample, a $45 product with $26.40 of variable cost and $35,650 of monthly fixed costs breaks even at 1,917 units ($86,250 of sales), and the workbook shows that on the chart, in the dashboard and in a plain-English verdict sentence. The pack is built by PK, whose YouTube channels reach 300K+ subscribers, and it is covered by our refund policy.
Key Features of the Break-Even Analysis Pack in Excel
- Break-even calculator for one product or service: contribution margin, break-even units and sales, units per selling day, cash break-even, units for a target after-tax profit, break-even price, margin of safety and operating leverage.
- Cost-volume-profit chart with the break-even point marked, plus a profit-volume chart. Both redraw when you change an input.
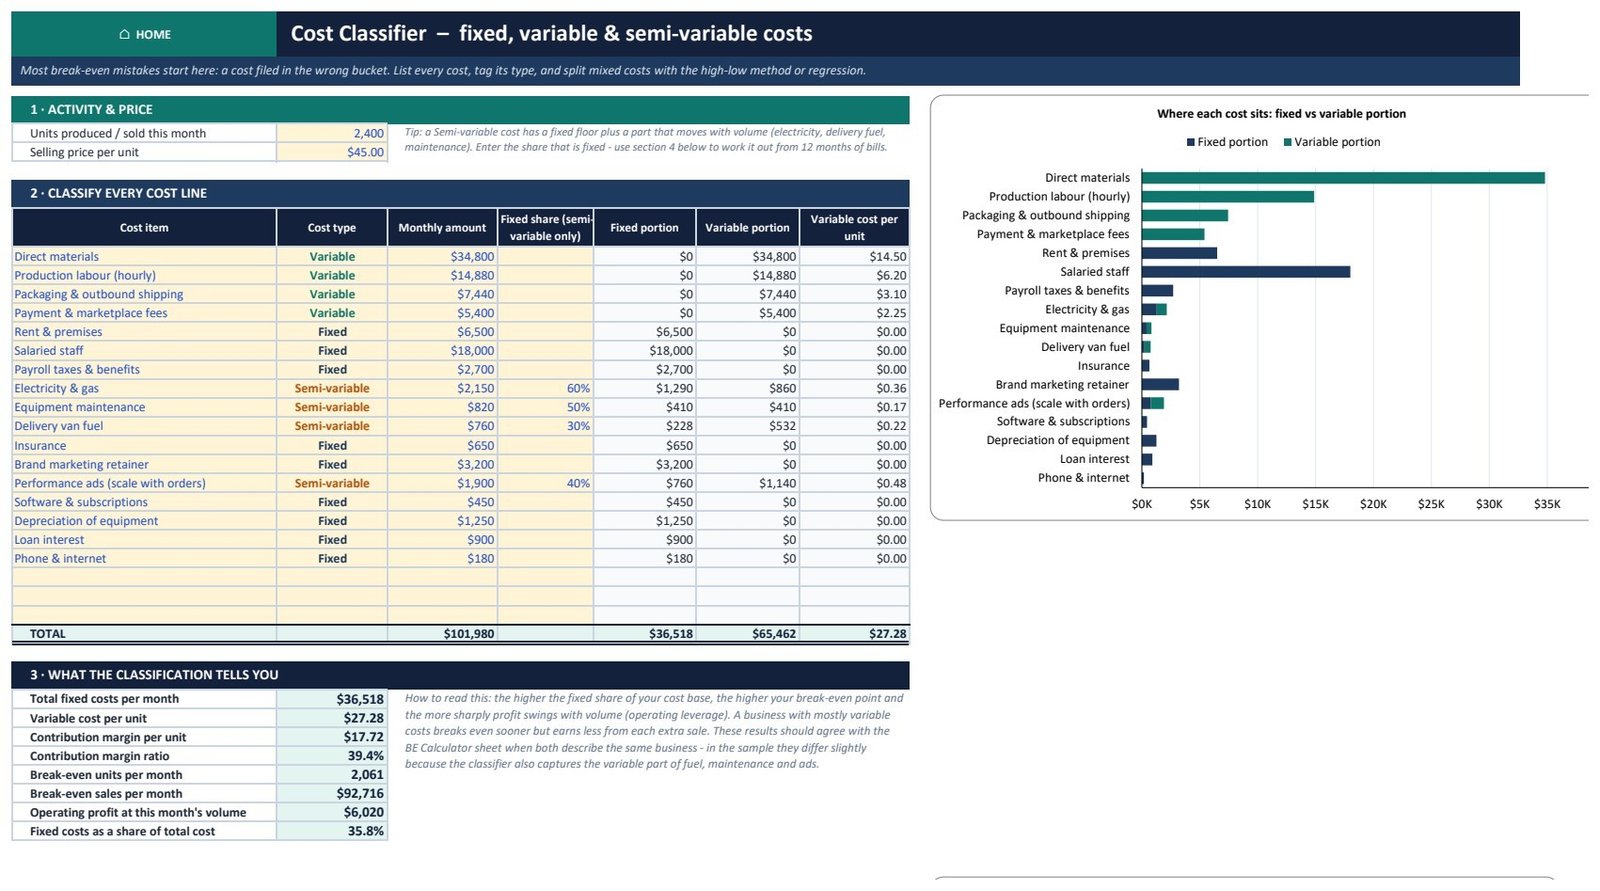
- Cost Classifier for up to 20 cost lines tagged fixed, variable or semi-variable. Mixed costs such as electricity are split using the high-low method and regression (SLOPE, INTERCEPT and RSQ).
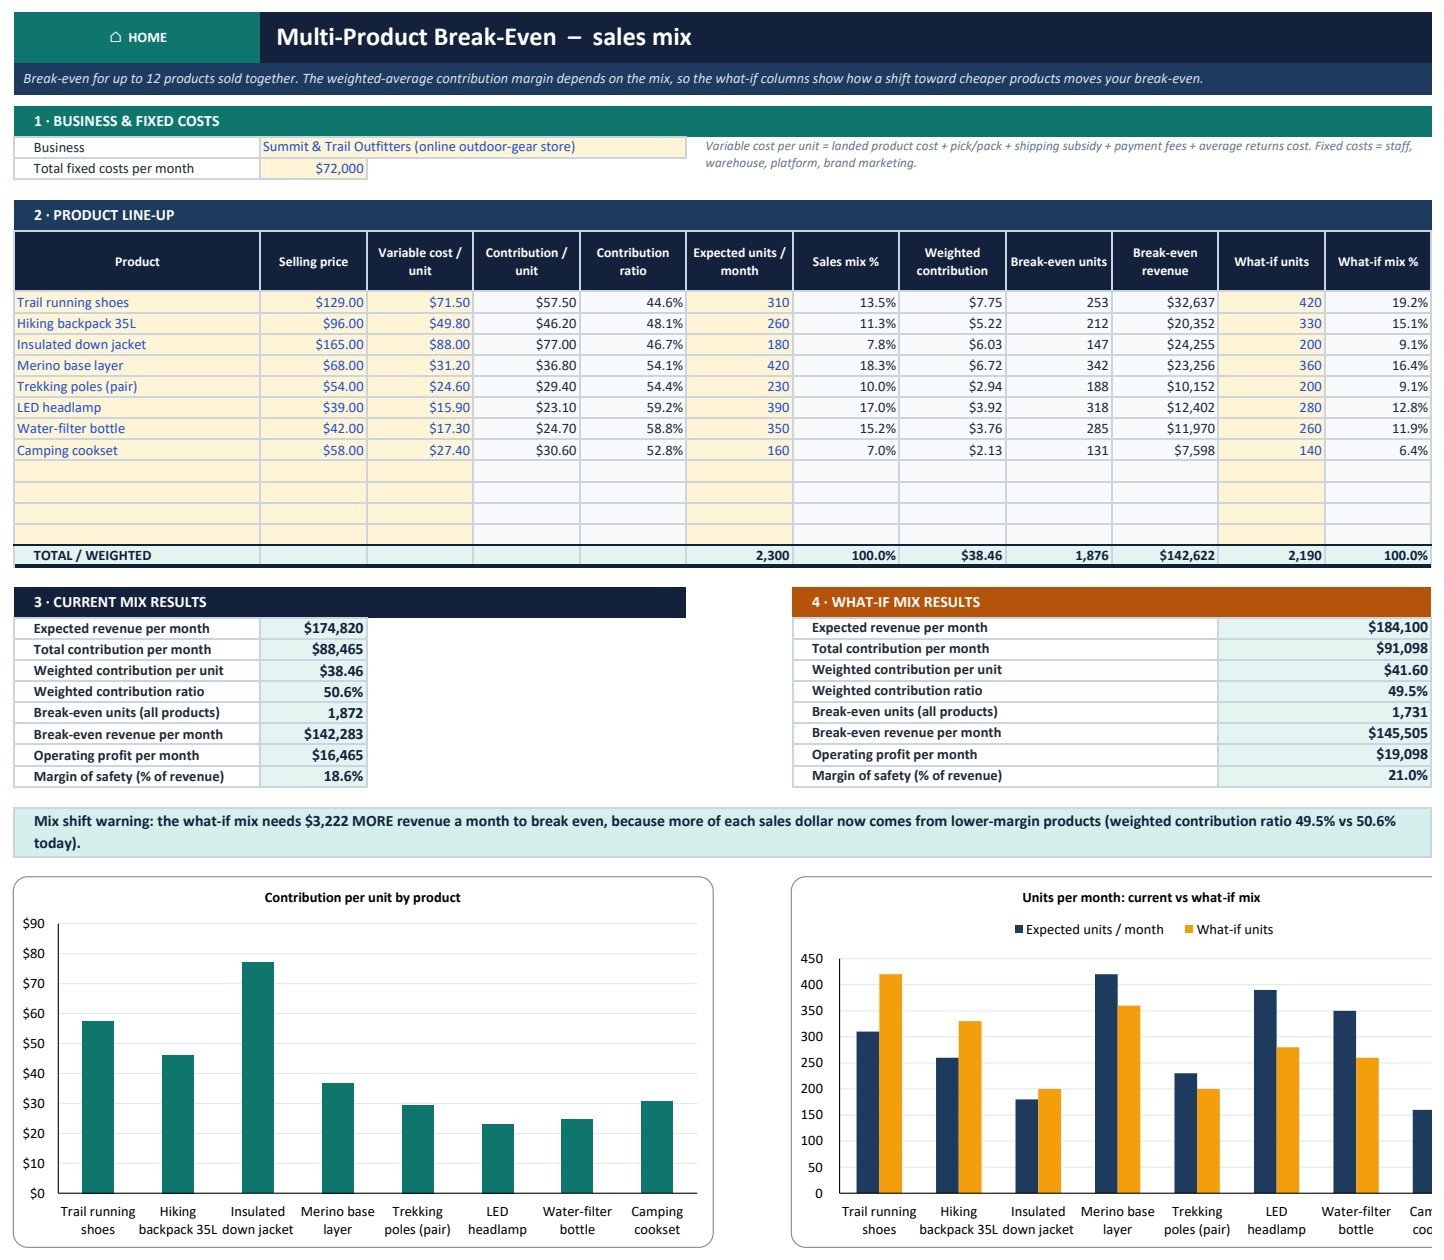
- Multi-product break-even analysis for up to 12 products, with a what-if mix column that shows how selling more low-margin items moves break-even revenue.
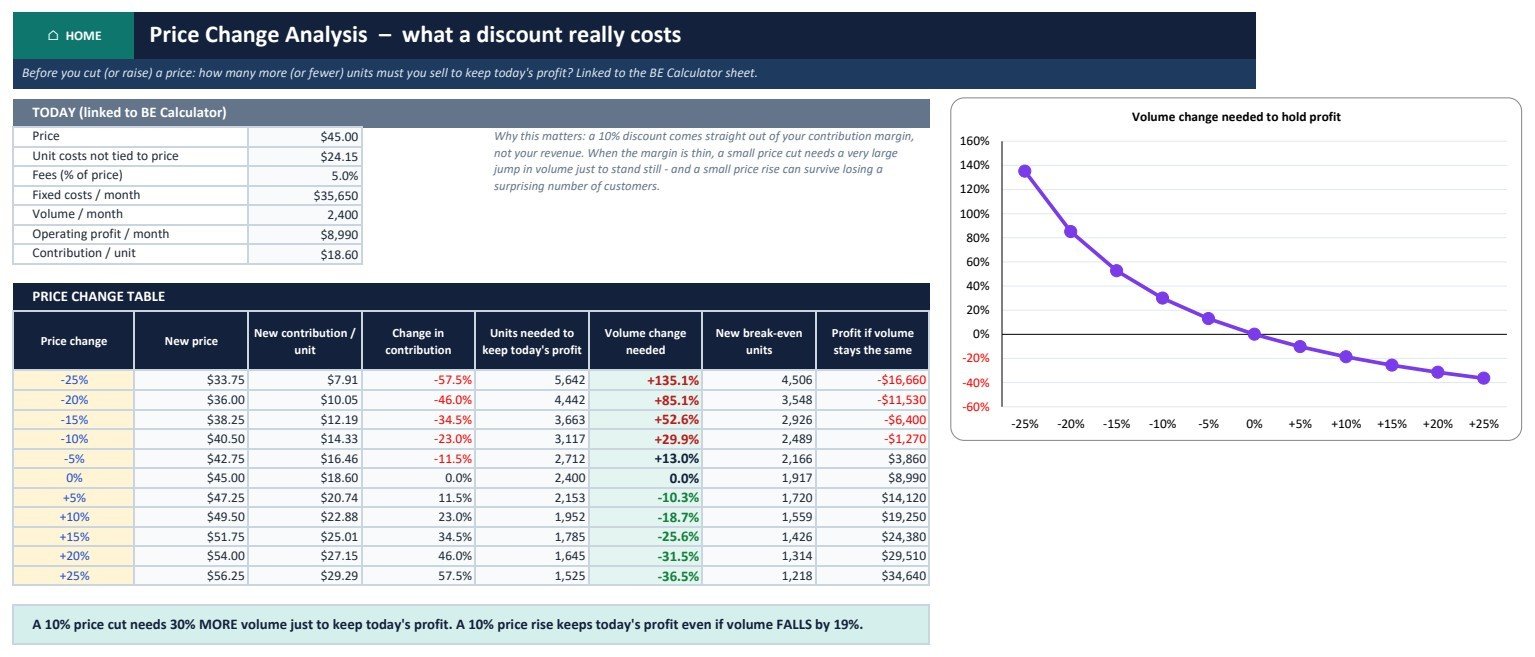
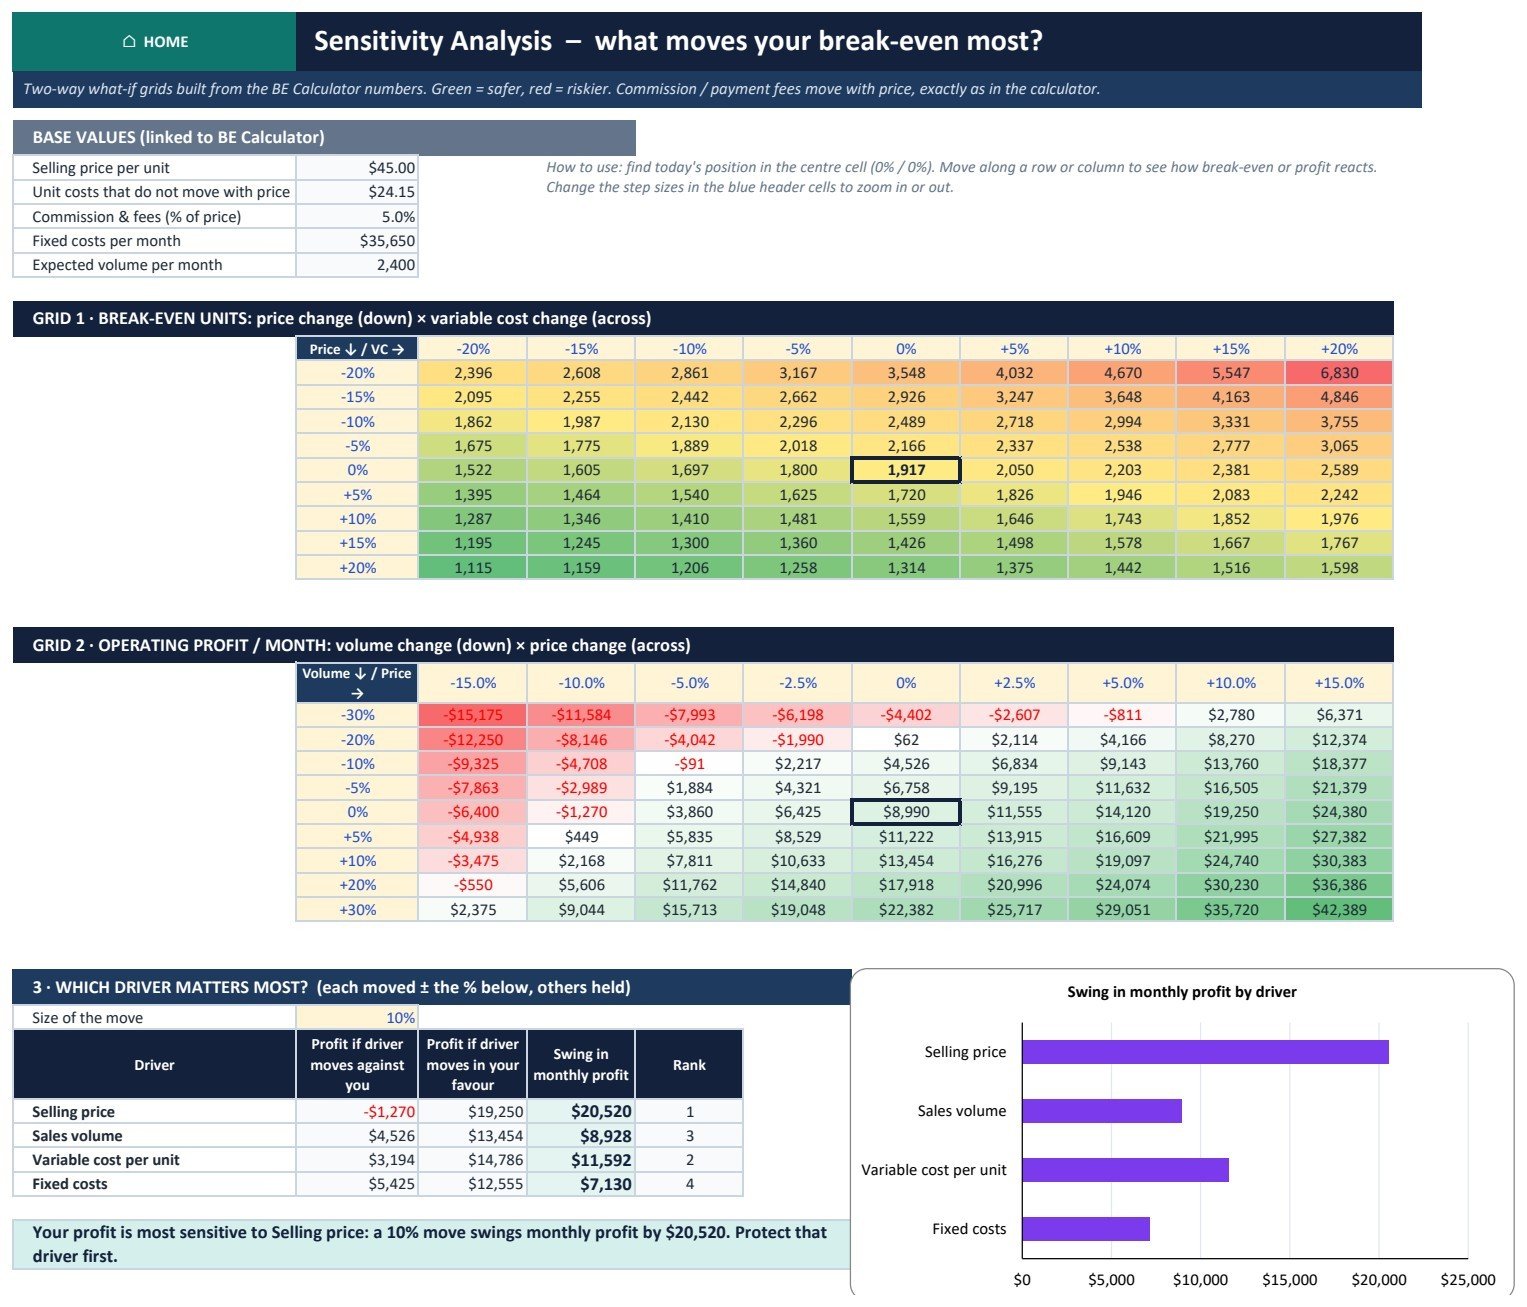
- Scenarios, sensitivity and price change: worst, base and best cases side by side, two-way heat-map grids, a ranked driver check and the volume needed to hold profit after a discount.
- Investment payback for a new site or machine, with a six-month sales ramp, cash versus accounting break-even and simple and discounted payback.
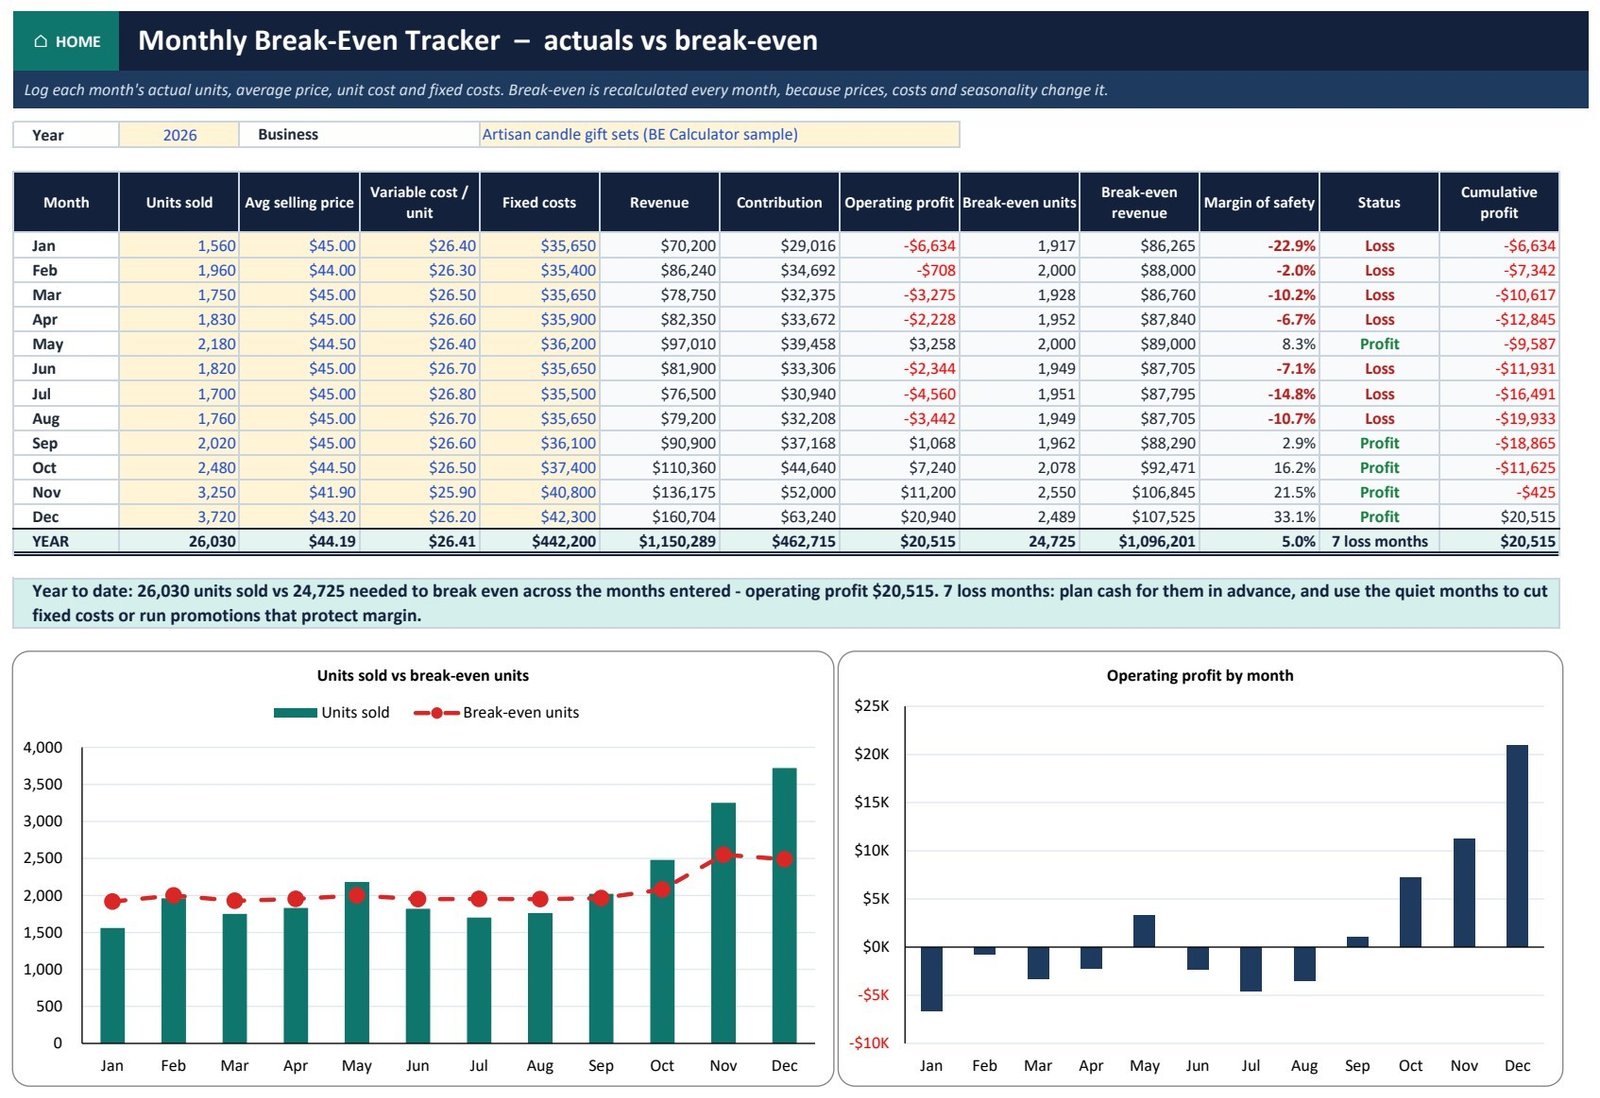
- Monthly tracker that recalculates break-even every month, so seasonal loss months stand out.
What’s Inside the Break-Even Pack
The workbook opens on a Home page that links to every sheet. Core tools: Dashboard, BE Calculator, Cost Classifier, Sales Mix and Monthly Tracker. What-if analysis: Scenarios, Sensitivity, Price Change and Investment Payback. Four worked case studies, each measured in its own industry’s unit:
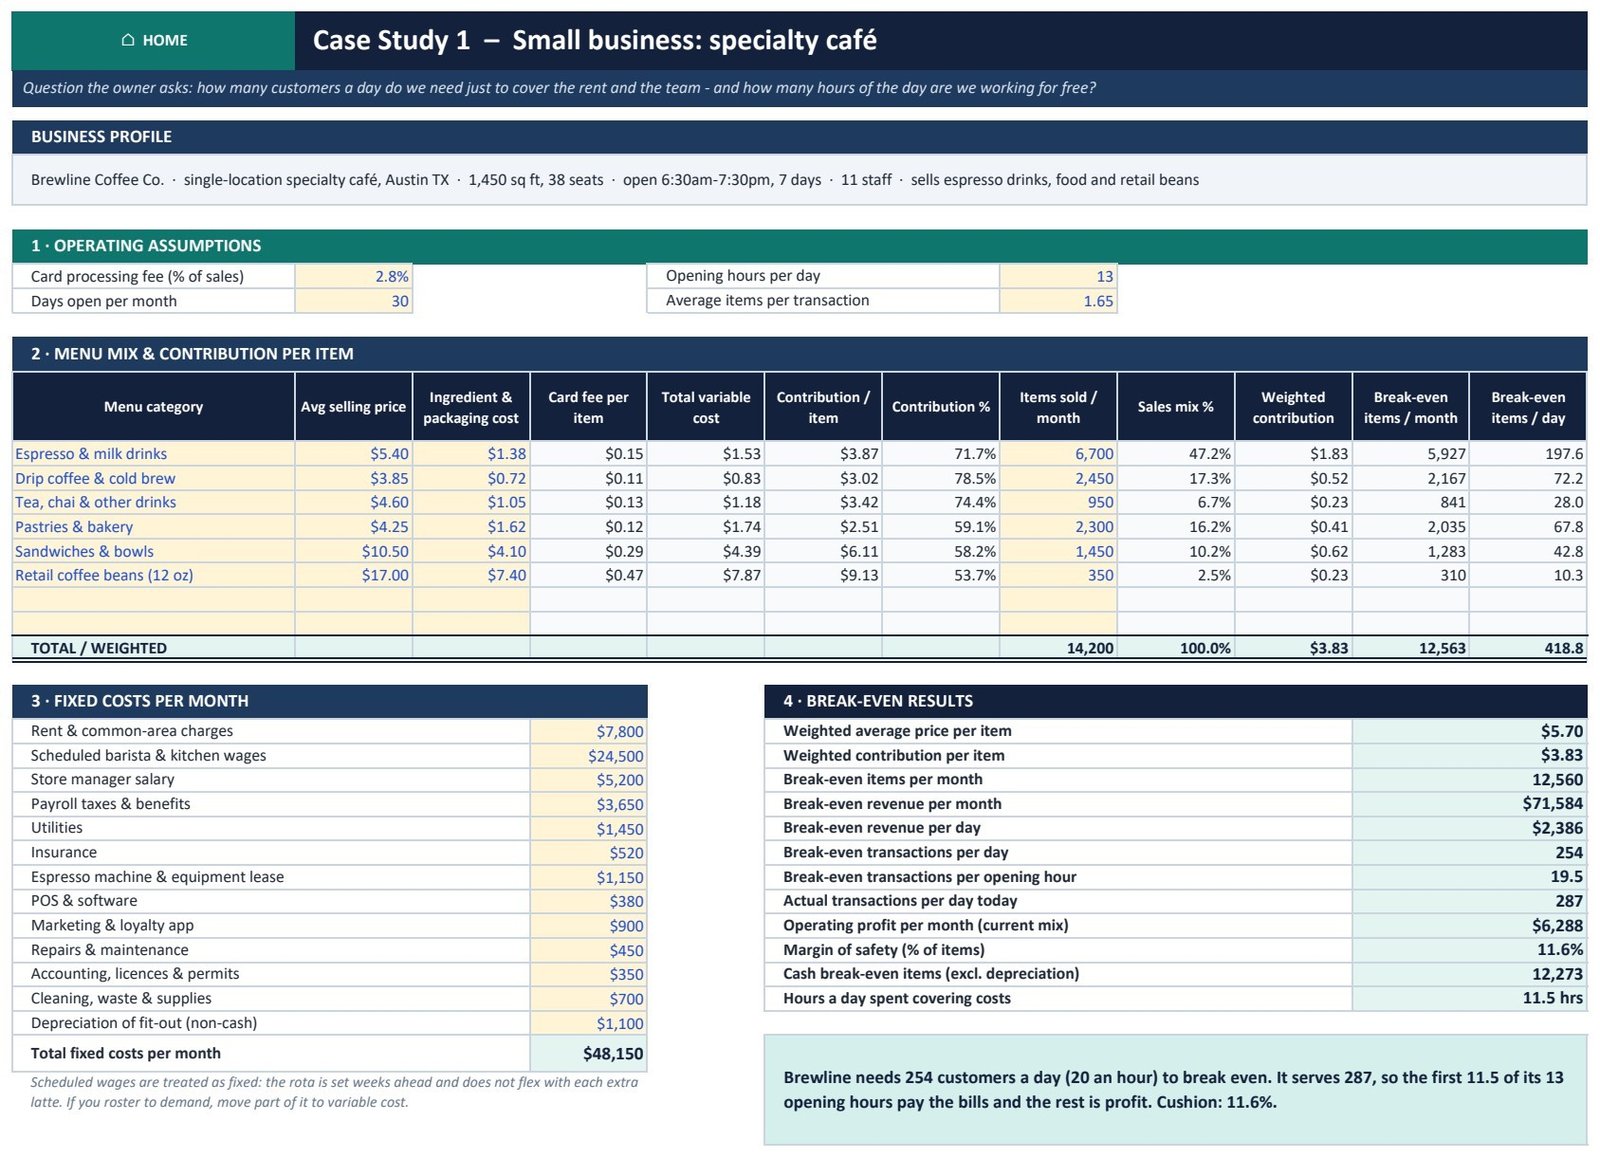
- Small business café: 254 customers a day to break even, and the café spends 11.5 of its 13 opening hours covering costs.
- Digital agency: 637 billable hours a month, which is 52% utilisation, and the lowest blended rate the agency can charge before it makes a loss.
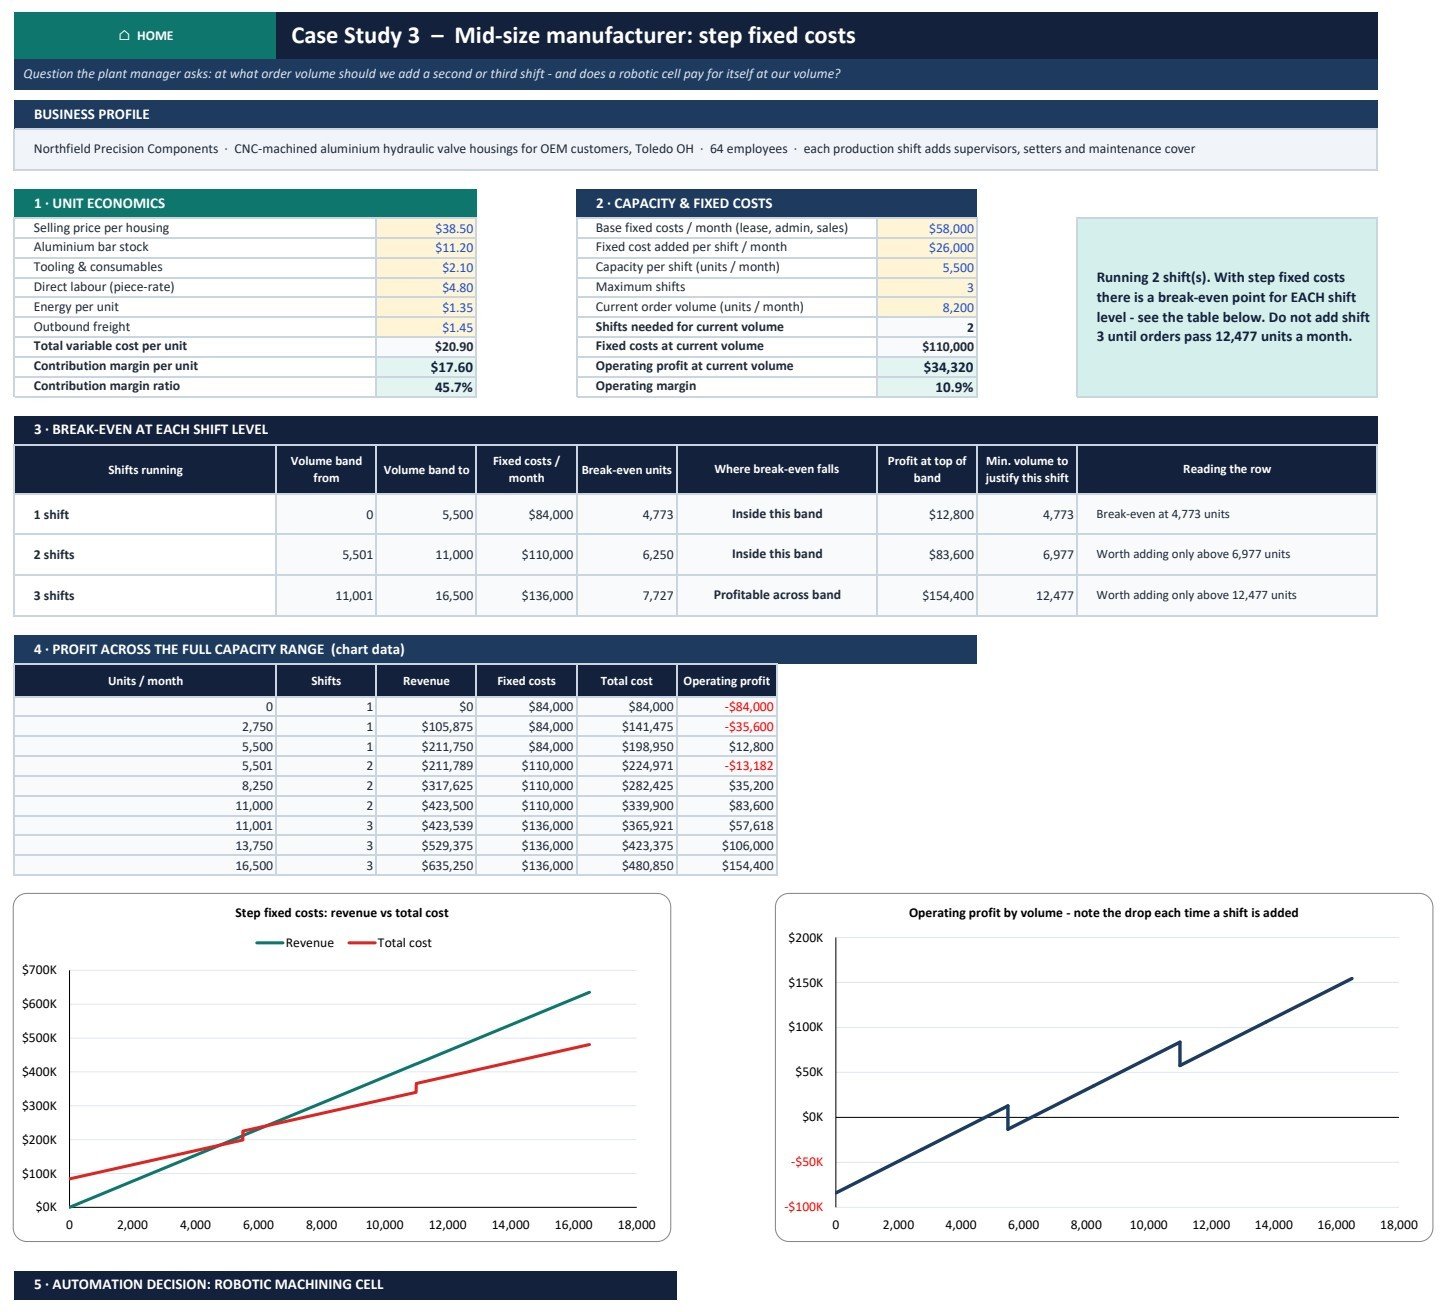
- Mid-size manufacturer: step fixed costs give a separate break-even point for each shift. A second shift only pays above 6,977 units, and a robotic cell pays above 3,625 units.
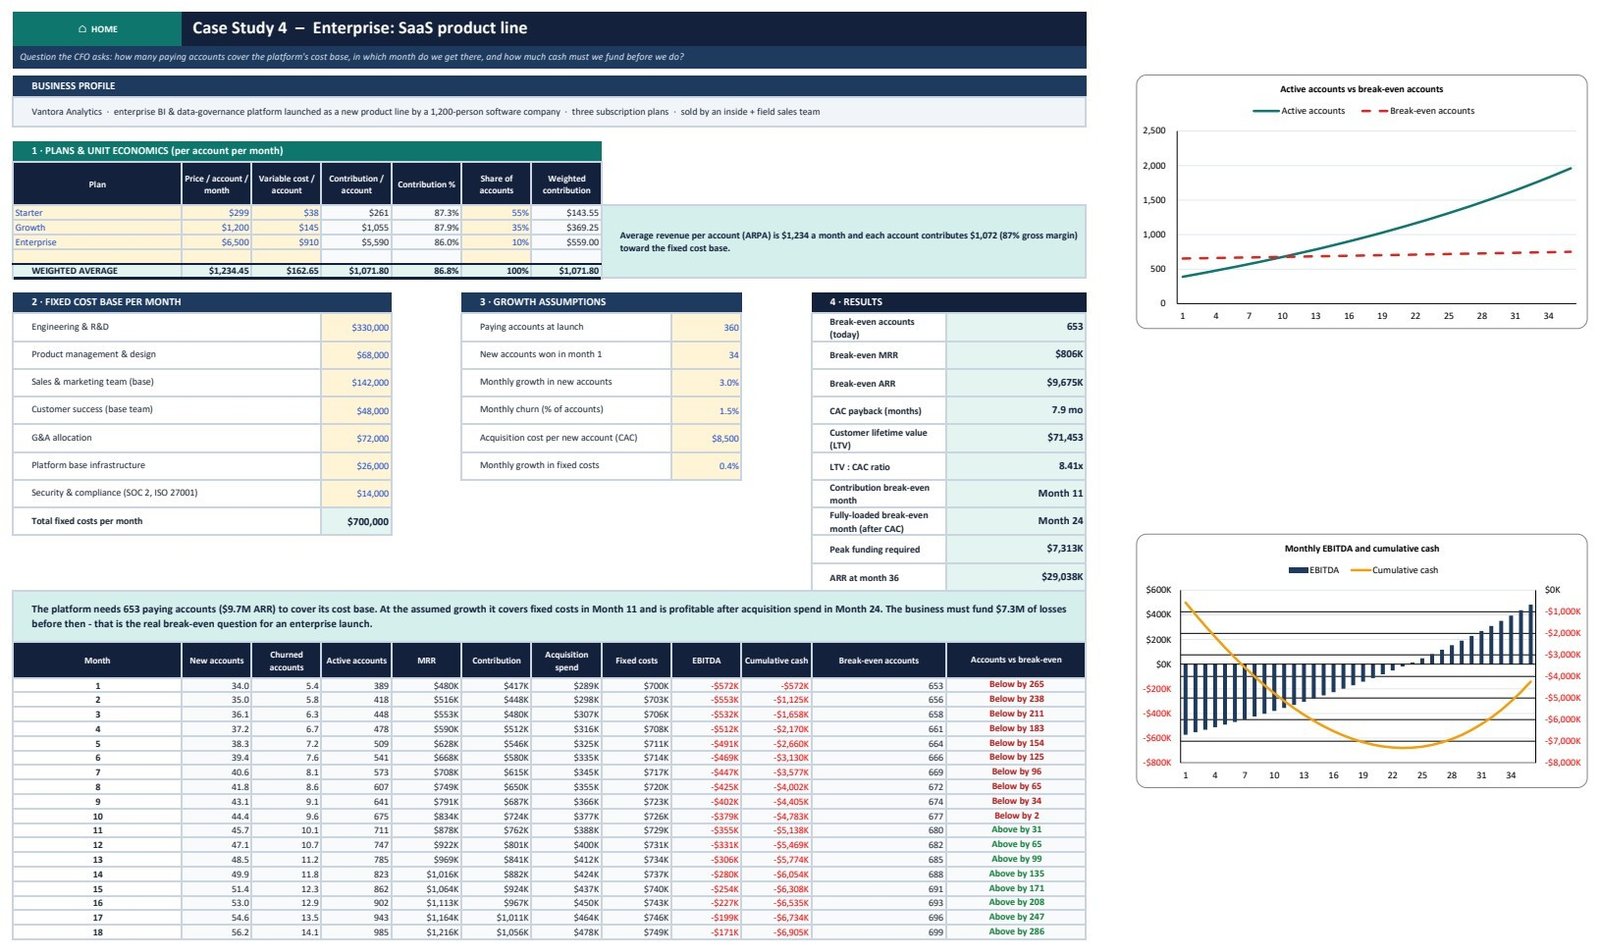
- Enterprise SaaS product line: 653 paying accounts to break even, reached in month 24 after acquisition cost, with $7.3M of peak funding along the way.
The pack also includes a Formula Guide sheet, a Blank edition for your own numbers, the PowerPoint deck and the PDF guide.
Break-Even Analysis Pack in Excel vs. Google Sheets Template vs. Paid Planning Software – Where This Fits
| Feature | This Excel pack | Free Google Sheets break-even template | Paid business-planning SaaS |
|---|---|---|---|
| Cost | One-time purchase | Free | Monthly subscription |
| Platform | Excel 2010+ (Windows and Mac) | Google Sheets | Web app |
| Setup time | About 5 minutes | About 5 minutes | Account setup and onboarding |
| Real-time team collaboration | Through OneDrive or SharePoint | Yes | Yes |
| Mobile access | Excel mobile app | Yes | Yes |
| Customizable fields and formulas | Fully editable, nothing locked | Usually limited | Limited to the vendor’s model |
| Share with link | Through OneDrive | Yes | Yes |
| Year-1 cost at 5 users | One purchase | Free | Per-seat fee, every month |
| Multi-product sales mix and semi-variable costs | Yes (12 products, high-low and regression) | Rarely | Varies |
| Industry case studies and a presentation deck | 4 cases plus a 16-slide deck | No | No |
Who This Template Is For – and Who It’s Not For
It is for small-business owners pricing a product or opening a second site, finance and FP&A analysts building a cost-volume-profit analysis in Excel for a board or bank pack, consultants and agencies checking utilisation, manufacturers deciding whether to add a shift, and students learning managerial accounting with worked examples.
It is not for teams that need live links to accounting software, since you type or paste your own figures. It is also not a full three-statement financial model, not a budgeting system, and not tax, legal or investment advice. All sample companies are fictional, and their numbers are illustrations, not industry benchmarks.
How to Use the Break-Even Pack
- Open the Sample edition and click through Home. Every sheet has a HOME button.
- On the BE Calculator sheet, replace the yellow input cells: price, unit costs, fixed costs, expected volume, profit goal, tax rate and selling days.
- Check your costs in the Cost Classifier. Use section 4 to split a mixed cost from 12 months of bills.
- Stress-test the plan on Scenarios, Sensitivity and Price Change. All three read the BE Calculator automatically.
- Log actual results each month on the Monthly Tracker, then present the Dashboard or the included PowerPoint deck.
Real-World Use Cases
Maria, café owner. Maria wanted to know whether a 10% rent rise was survivable. The Case 1 sheet showed her break-even in customers per day and per hour, and the Price Change sheet showed that a 10% discount would need about 30% more volume just to keep today’s profit.
David, FP&A analyst. David used the margin of safety calculator, the Scenarios sheet and the Dashboard for a quarterly review. The worst case showed a monthly loss and the cash reserve it would need, a figure he could defend line by line.
Anita, plant manager. Anita adapted the Case 3 manufacturing sheet to her own shift costs. It showed the order volume at which a second shift adds profit rather than cost.
Frequently Asked Questions
Does it handle more than one product?
Yes. The Sales Mix sheet runs a multi-product break-even analysis for up to 12 products and includes a what-if mix column.
Do I need macros or add-ins?
No. It is a plain .xlsx file with worksheet formulas and charts, and it works offline in Excel 2010 and later on Windows and Mac.
What is the difference between cash and accounting break-even?
Cash break-even leaves out non-cash costs such as depreciation. The BE Calculator and the Investment Payback sheet show both figures.
Can I change the currency?
Yes. Select the cells, press Ctrl+1 and change the symbol in the number format. The calculations do not change.
Is there a blank version?
Yes. The Blank edition clears the core tools for your own numbers and keeps the four case studies as worked examples.
Does it work in Google Sheets?
It is built and tested for Microsoft Excel. The formulas are standard, but the charts and formatting have not been tested in Google Sheets.
Is this the same as the older Break-Even Analysis Template?
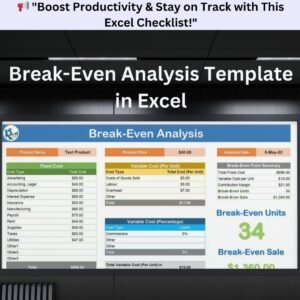
No. The Break-Even Analysis Template in Excel is a simpler single-sheet calculator. This pack adds sales mix, cost classification, scenarios, sensitivity, payback, case studies, a deck and a guide.
About the Author
Built by PK – Microsoft Certified Professional with 15+ years of Excel, Google Sheets, and Power BI experience. Founder of NextGenTemplates, reaching 300K+ subscribers across YouTube channels. Every template is hand-built and tested before release.
Explore Related Templates
- Manufacturing Business Plan Templates Kit: a complete first-year planning kit for manufacturers.
- CFO’s Financial Command Toolkit: 10 finance templates in one bundle.
- Profit and Loss (P&L) Template in Excel
- Cash Flow Template in Excel
- Pricing Strategy KPI Dashboard in Excel
Browse more Excel financial tools and Excel analysis templates, or read the full walkthrough of the Break-Even Analysis Pack in Excel on our blog.
Download the pack today and know your break-even point before your next pricing, hiring or investment decision.
Last updated: September 2026













Reviews
There are no reviews yet.