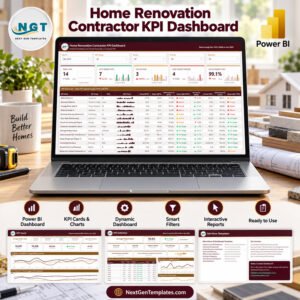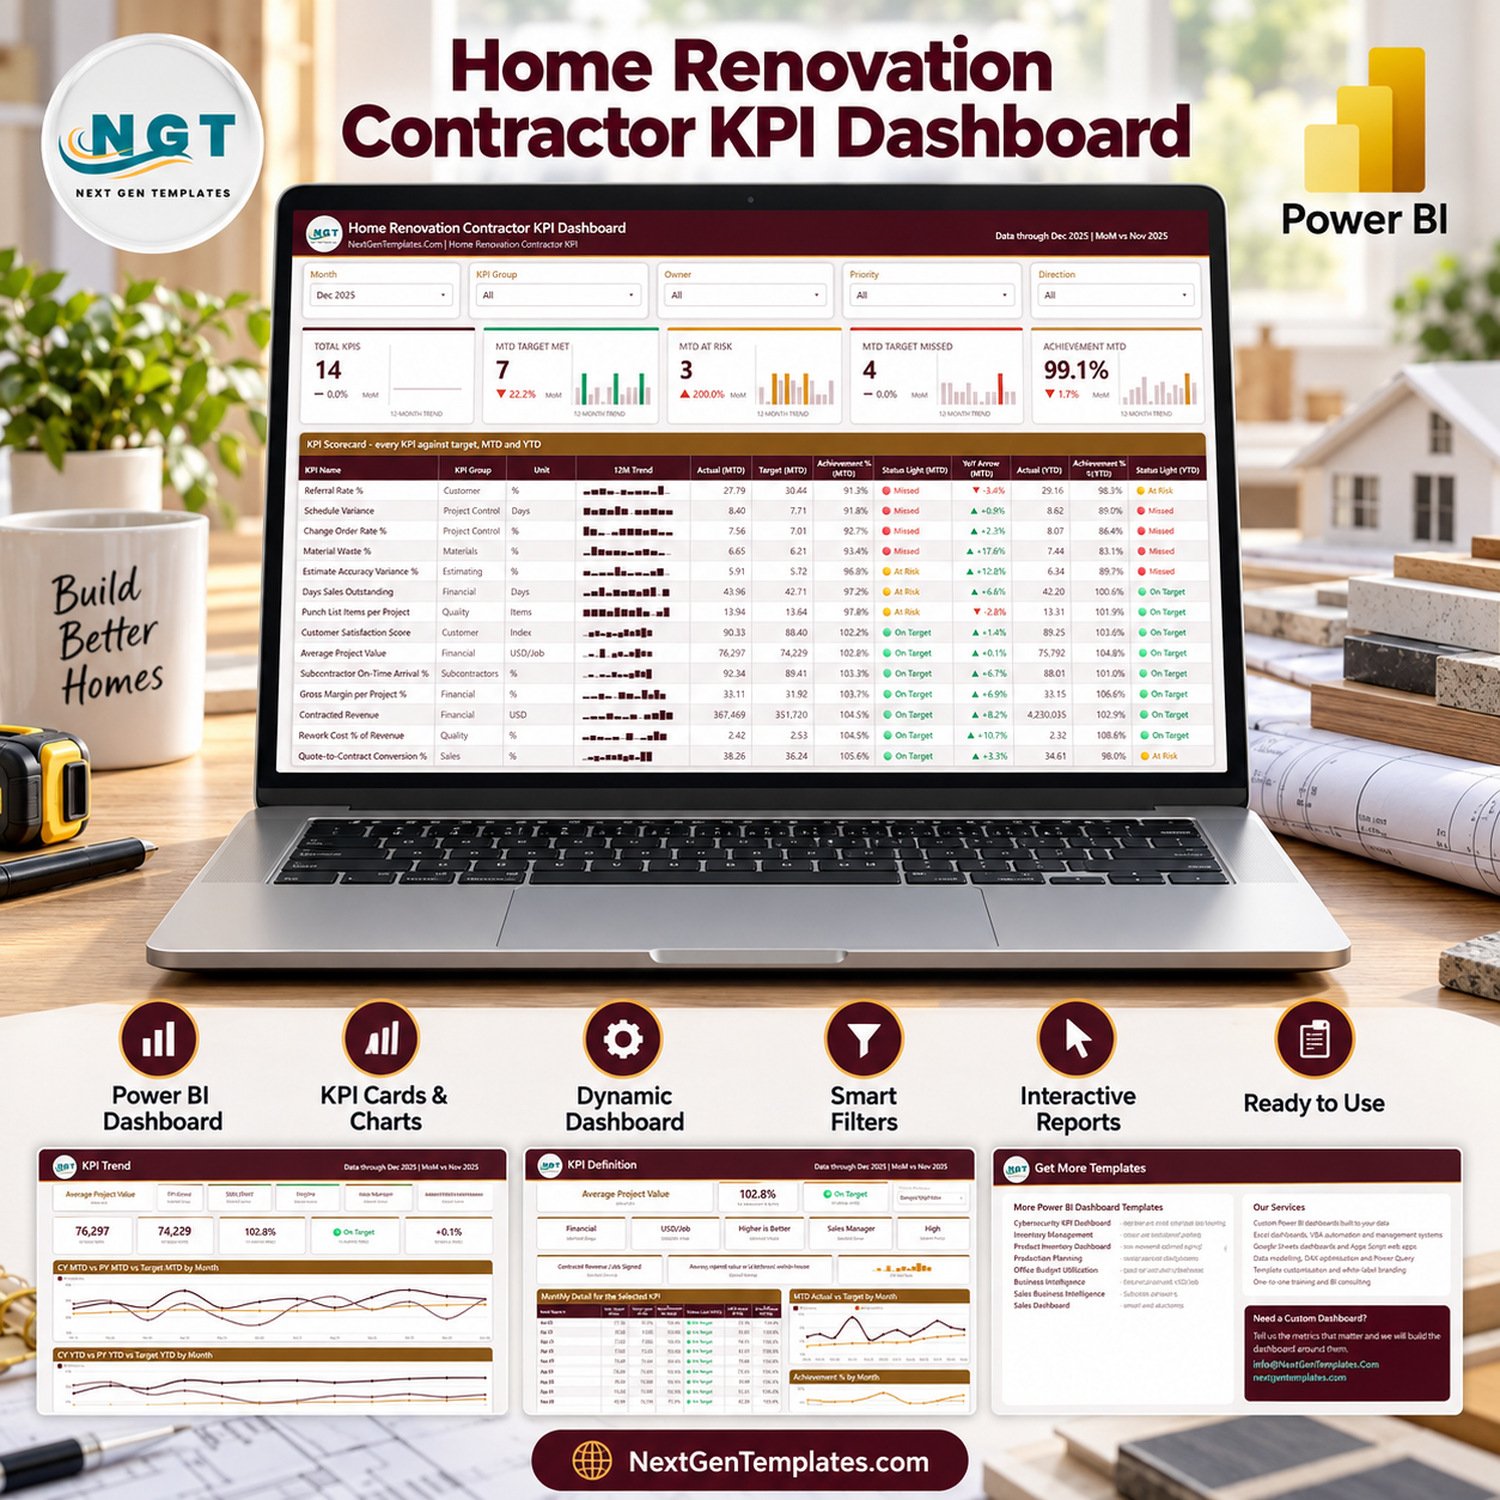
The Home Renovation Contractor KPI Dashboard in Power BI tracks 14 remodelling KPIs across 8 KPI groups, on 4 report pages plus 2 hidden tooltip pages, driven by 104 DAX measures. The sample pack ships 168 monthly target rows and 336 monthly actual rows — 24 months of history, so every prior-year and YoY figure works the moment you open the file. Setup takes under 10 minutes: swap the three sheets in Data.xlsx, hit Home > Refresh, and every card, light and chart follows.
🌍 Join 8,400+ teams in 40+ countries using NextGenTemplates to replace paid SaaS reporting with one-time-purchase Excel, Google Sheets and Power BI templates.
✅ Instant download · One-time payment · No subscription · No per-user fees · Lifetime access
This is the KPI dashboard line — a month picker, red/amber/green traffic lights, a KPI Trend page and a KPI Definition page. It is not one of our analytical Power BI dashboards (those slice jobs, crews and revenue by dimension), and it is not a KPI scorecard. If you want the scorecard treatment of the same topic, the Home Renovation Contractor KPI Scorecard in Google Sheets is a separate, live product.
Please read this before you buy. This is an internal reporting template that runs on numbers you supply. It does not establish compliance with building codes, permitting, licensing, mechanics-lien or home-improvement-contract law in any jurisdiction. It is not a structural, electrical, plumbing or safety assessment, not an inspection record and not a warranty. It does not produce estimates, bids or contracts that are binding, accurate or fit to hand a customer, and it does not replace a licensed contractor’s statutory duties. Every figure in the screenshots is buyer-entered demo data.
🔑 Key Features of the Home Renovation Contractor KPI Dashboard in Power BI
- 📊 14 KPIs, 8 groups, one scorecard. Financial (4), Sales, Estimating, Project Control (2), Subcontractors, Materials, Quality (2) and Customer (2). Named metrics include Contracted Revenue, Gross Margin per Project %, Change Order Rate %, Schedule Variance, Estimate Accuracy Variance %, Rework Cost % of Revenue and Punch List Items per Project.
- 💡 Direction-aware scoring. Each KPI is typed UTB (higher is better) or LTB (lower is better). Higher-is-better KPIs score Actual ÷ Target; lower-is-better KPIs score Target ÷ Actual, so beating a waste or cycle-time target scores above 100% instead of looking like a miss.
- 🔴 Three-state traffic lights. On Target is 100% or more, At Risk is 95% to 100%, Missed is below 95%. The same rule runs on MTD and on YTD, and the header cards count how many KPIs sit in each state.
- 📅 Month picker plus five slicers. Month, KPI Group, Owner, Priority and Direction. Pick Dec 2025 and the whole page re-reads; the 12-month sparklines stay on the full year so you keep the shape.
- 🧮 Nothing is hard-coded. Add, rename or delete a KPI in the three input sheets and the counts, the scorecard table, the KPI list and every chart follow on refresh. The KPI name is the join key across all three sheets.
- 🔧 Fully editable model. 104 measures in clear display folders, native Power BI visuals only, no custom visuals to install and no locked pages.
📦 What’s Inside the Download
The zip contains three files: the .pbix report, Data.xlsx (the input pack), and a generic Power BI Dashboard — User Manual.pdf. The report file holds 6 pages: the 4 shown below plus two hidden 280×360 tooltip pages (“KPI Detail” and “Trend Detail”) that appear on hover rather than in the page tabs.
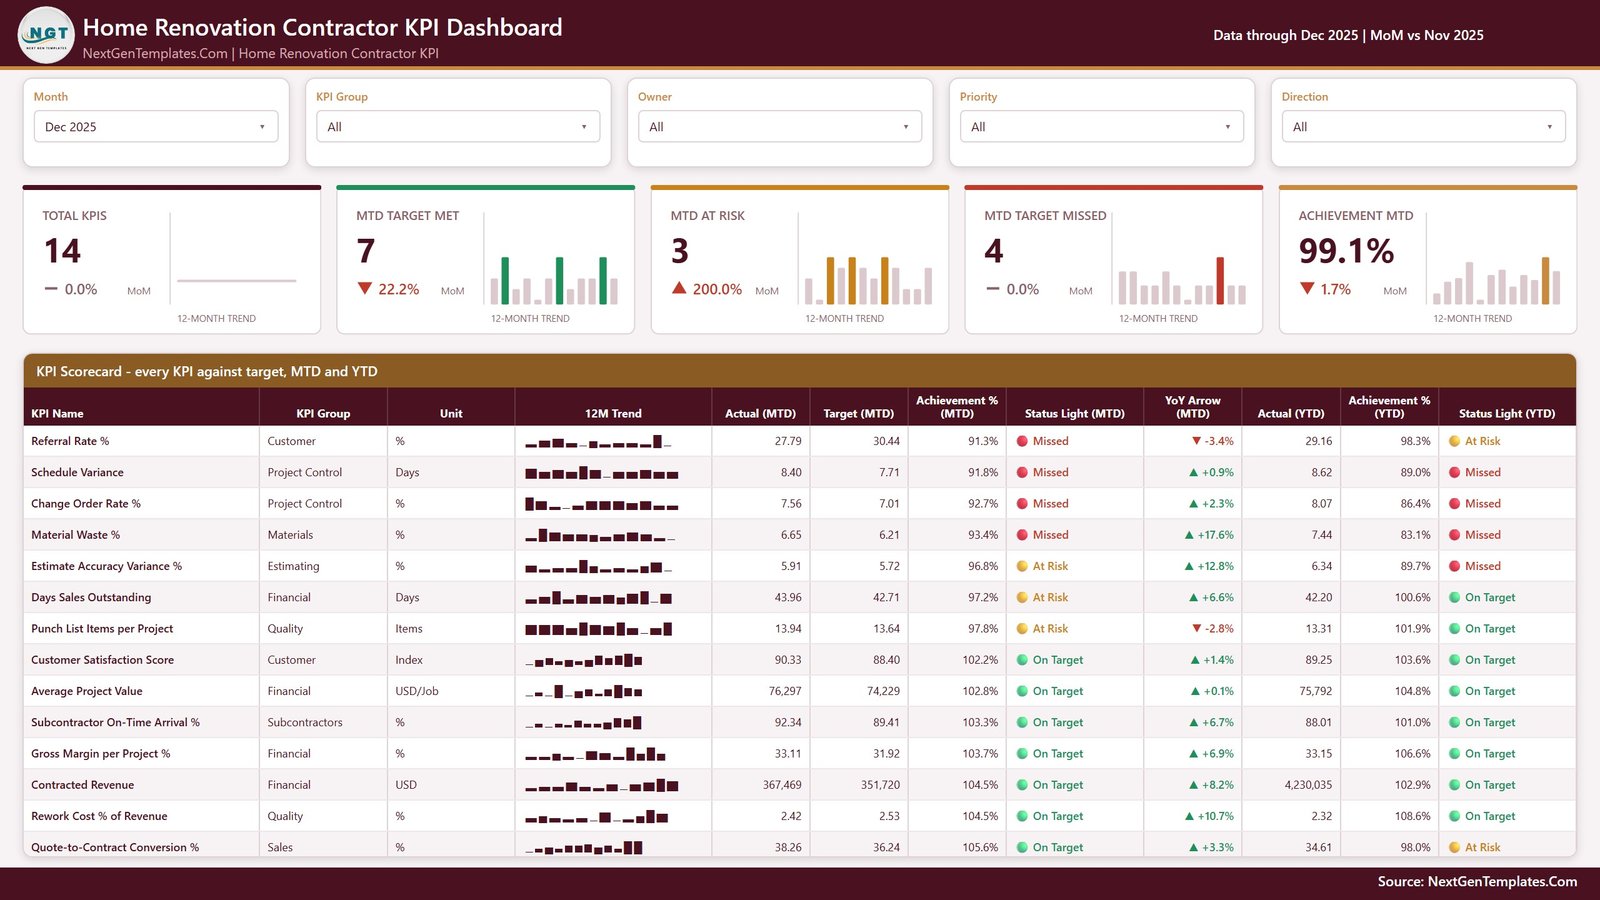
Page 1: KPI Scorecard
Five slicers (Month, KPI Group, Owner, Priority, Direction) sit above five header cards — Total KPIs, MTD Target Met, MTD At Risk, MTD Target Missed and Achievement MTD — each carrying a month-on-month percentage and a 12-month trend sparkline. Below them the scorecard table lists every KPI with its group, unit, 12-month trend, Actual and Target (MTD), Achievement % (MTD), a status light, a YoY arrow, then Actual (YTD), Achievement % (YTD) and a second status light. In the demo month 7 KPIs are on target, 3 at risk and 4 missed, at 99.1% achievement.
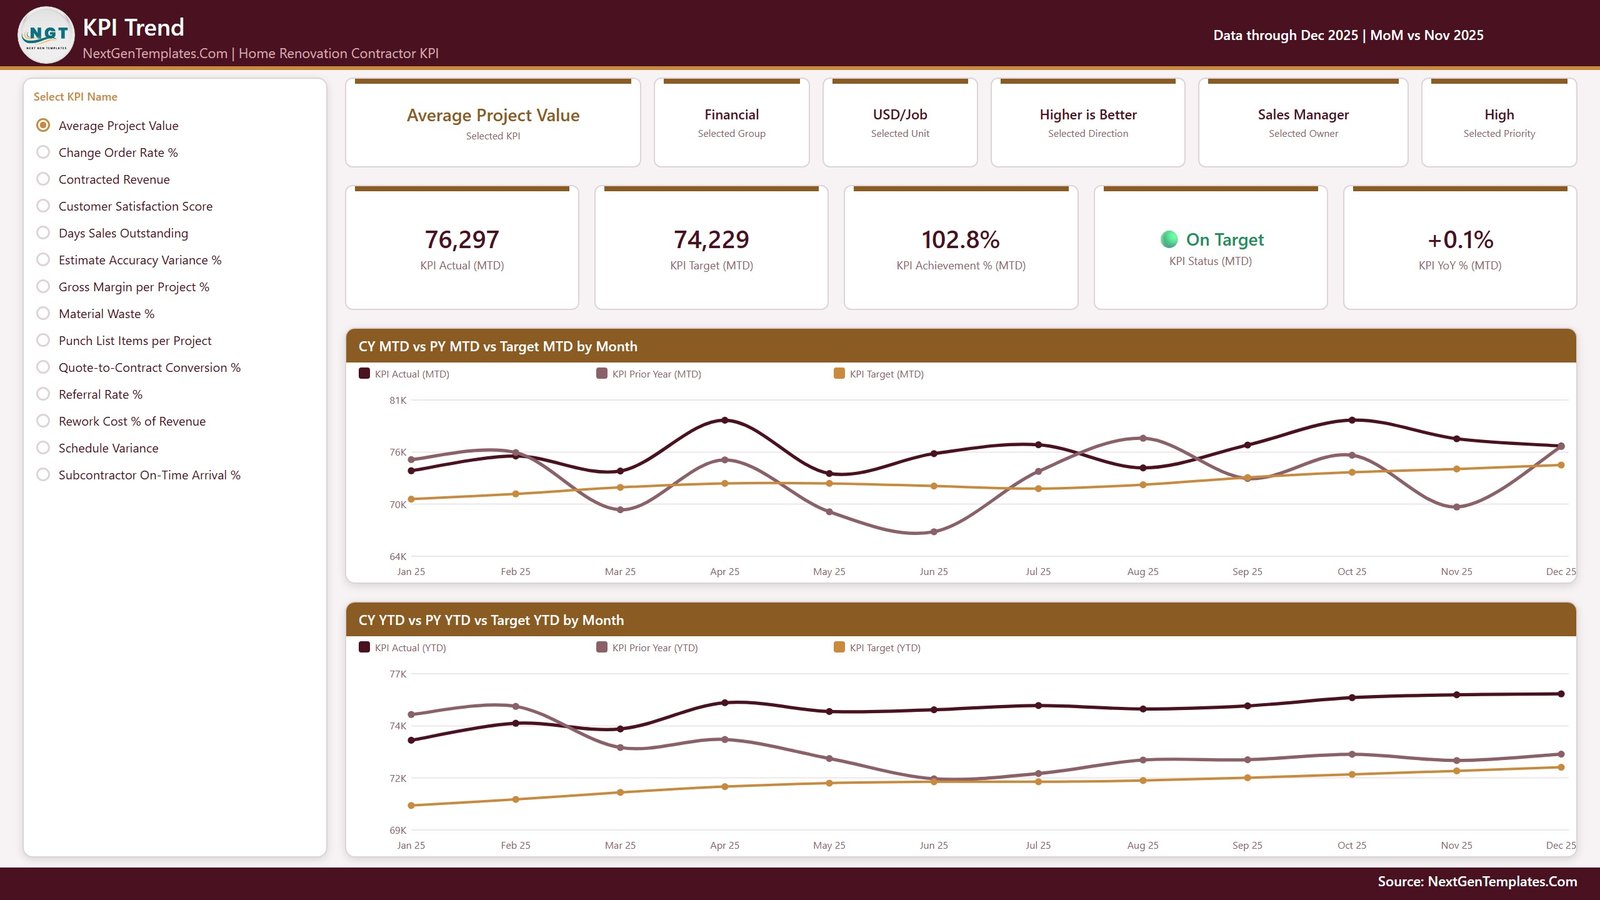
Page 2: KPI Trend
A list slicer down the left names all 14 KPIs. Picking one fills six attribute cards (selected KPI, group, unit, direction, owner, priority) and five value cards (Actual MTD, Target MTD, Achievement % MTD, status and YoY % MTD), then redraws two line charts: CY MTD vs PY MTD vs Target MTD by Month and CY YTD vs PY YTD vs Target YTD by Month, each plotting current year, prior year and target across the 12 months.
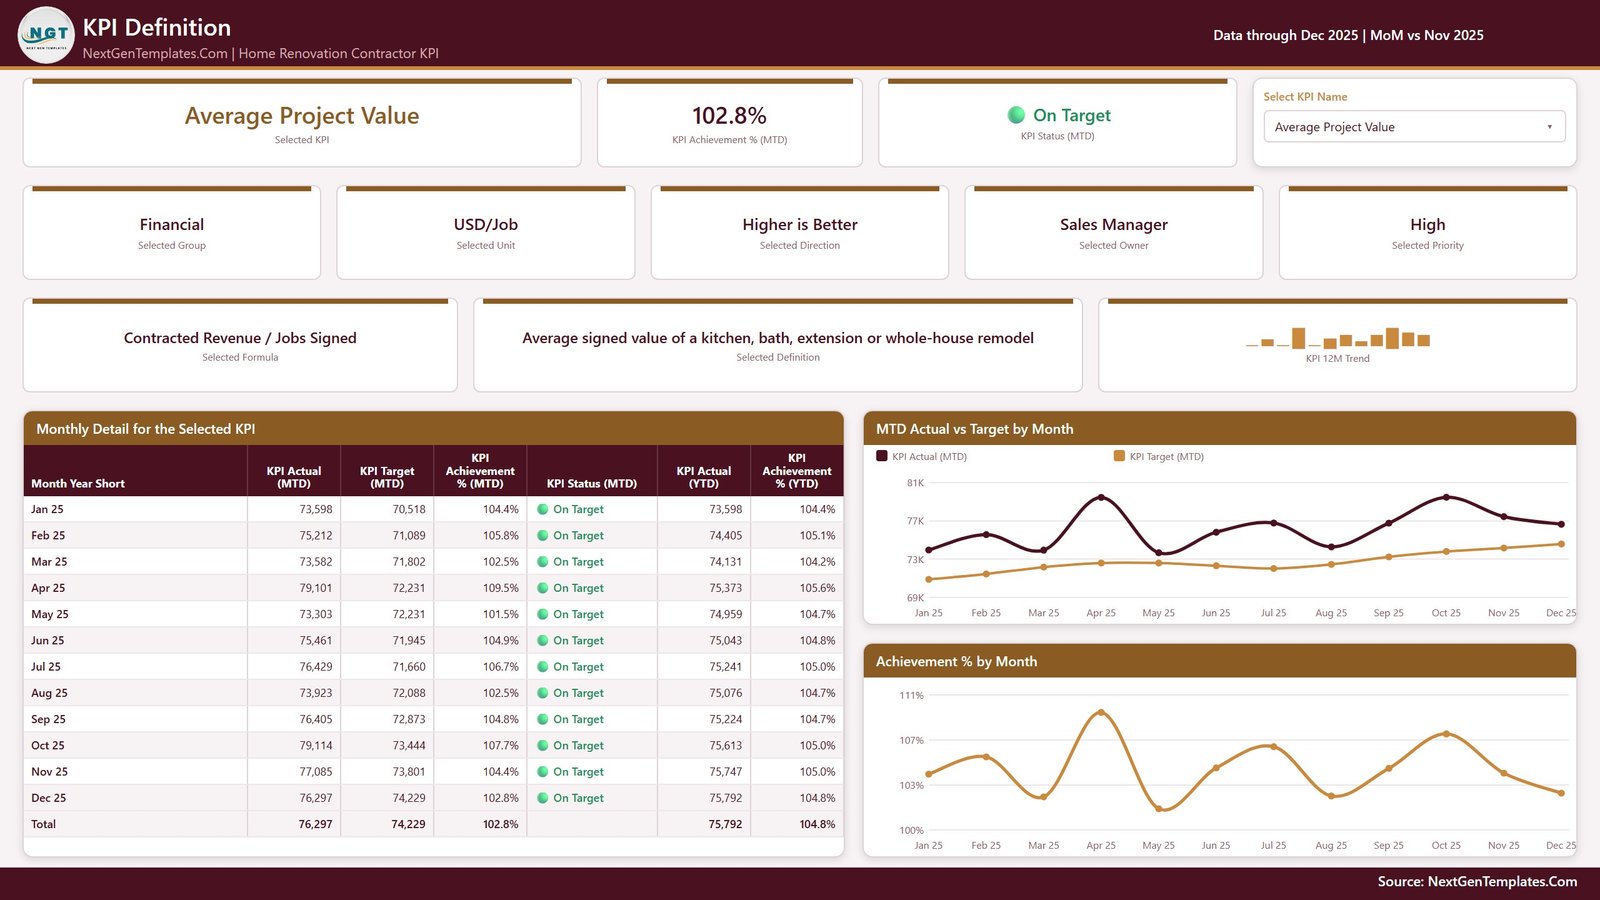
Page 3: KPI Definition
The same KPI selection, as a dropdown, with the documentation attached: the formula and the plain-English definition of the metric, its owner and priority, and a 12-month trend. A Monthly Detail for the Selected KPI table lists all twelve months with Actual, Target, Achievement % and status for MTD plus Actual and Achievement % for YTD, beside two charts — MTD Actual vs Target by Month and Achievement % by Month.
The file also has a fourth visible page, “Get More Templates”, which is a NextGenTemplates catalogue page rather than a report page. It is left out of the gallery above on purpose — it carries no data of yours.
📈 This Template vs. Tableau or Qlik vs. Paid Construction SaaS
| Feature | This Power BI template | Tableau / Qlik build | Buildertrend / Procore |
|---|---|---|---|
| Cost | $12.99 one-time ✅ | $70–$115 / user / month for the platform, plus build time | $99–$500+ / month, tier-dependent |
| Platform | Power BI Desktop (free from Microsoft) ✅ | Tableau Desktop or Qlik Sense licence | Vendor-hosted web app |
| Setup time | Under 10 minutes — replace 3 sheets, refresh ✅ | Days to weeks of dashboard development | Weeks of onboarding and data migration |
| Real-time team collaboration | Publish to a Power BI workspace (licence needed) | Yes, on the paid server ✅ | Yes ✅ |
| Mobile access | Power BI mobile app once published | Yes ✅ | Yes ✅ |
| Add or rename a KPI yourself | Yes — a row in Data.xlsx, then refresh ✅ | Requires editing the workbook and its calculations | Limited to fields the vendor exposes |
| Own the file forever | Yes — the .pbix is yours ✅ | Ends when the licence ends | Data leaves with you only on export |
| Year-1 cost at 5 users | $12.99 ✅ | $4,200–$6,900 | $1,200–$6,000+ |
| Job costing, scheduling and client portal | No — reporting only | No | Yes ✅ |
For a remodelling firm that wants a monthly KPI review it can read in one screen, without a per-seat BI licence or a full construction-management subscription, this template sits in the sweet spot.
👥 Who This Template Is For — and Who It’s Not For
✅ Built for:
- Owners and principals of kitchen, bath, extension and whole-house remodelling firms running 5–200 jobs a year
- Project managers and field superintendents who already track schedule variance, change orders and punch lists somewhere, and want one monthly view
- Estimators and finance leads who need margin, DSO and estimate accuracy side by side against target
- Anyone reporting to a board, a lender or a franchisor on a fixed monthly KPI set
❌ Not for you if:
- You need live job costing, scheduling, daily logs or a client portal — buy Buildertrend or Procore, not a reporting template
- You want the dashboard to pull automatically from QuickBooks, Xero or your CRM; this reads an Excel file you maintain
- You are looking for a permit, code-compliance, inspection or lien-tracking tool — this is none of those
- You do not have Power BI Desktop and will not install it
⚙️ How to Use It
- Unzip the download and open the .pbix in Power BI Desktop, keeping Data.xlsx in the same folder.
- Open Data.xlsx and edit the KPI Definition sheet — one row per KPI, with its group, unit, formula, definition, UTB/LTB type, owner and priority.
- Fill Input_ Target with one row per KPI per month for your reporting year, giving the MTD target and the YTD target.
- Fill Input_ Actual the same way, for the reporting year and the year before it — the prior year is what every PY and YoY figure reads from.
- For rates, ratios and index KPIs make YTD the average of the months so far, never a sum. Money and volume KPIs do add up.
- Back in Power BI Desktop press Home > Refresh, then pick your month. If you moved the workbook, use Transform data > Data source settings > Change Source.
💼 Real-World Use Cases
Dan runs a 22-person remodelling firm in Portland. On the first Monday of each month he opens the scorecard, sets the month picker, and walks his leads through the red rows before anything else. Last quarter that was change order rate and material waste, and the 12-month sparkline showed both had been drifting for two seasons rather than spiking once.
Priya is the estimator at a kitchen-and-bath specialist. She lives on the KPI Definition page: she picks Estimate Accuracy Variance %, reads the formula card so everyone agrees what the number means, and uses the month-by-month table to argue for re-pricing two supplier categories.
Marcus manages a franchise group of four renovation branches. He keeps one copy of the file per branch, points each at its own Data.xlsx, and compares the same 14 KPIs and the same red/amber/green rule across all four every month.
❓ Frequently Asked Questions
Does this make our renovation work compliant, or our estimates accurate?
No. The Home Renovation Contractor KPI Dashboard in Power BI is an internal reporting template. It does not establish code, permit, licensing or contract compliance, it is not an inspection or safety assessment, and it cannot make an estimate or a bid accurate or binding. It reports the numbers you type into it, nothing more.
Are the numbers in the screenshots real?
No. Every margin, cycle time, change-order rate, punch-list count and satisfaction score in the images is buyer-entered demo data, shipped so the file opens looking complete. Delete it and enter your own figures before you show the dashboard to anyone.
What KPIs does this template track?
Fourteen, in eight groups: Contracted Revenue, Gross Margin per Project %, Average Project Value, Days Sales Outstanding, Quote-to-Contract Conversion %, Estimate Accuracy Variance %, Change Order Rate %, Schedule Variance, Subcontractor On-Time Arrival %, Material Waste %, Rework Cost % of Revenue, Punch List Items per Project, Customer Satisfaction Score and Referral Rate %.
Can I use my own KPIs instead?
Yes. Nothing in the report hard-codes a KPI name. Add, rename or delete rows across the three input sheets, refresh, and the card counts, the scorecard table, the KPI slicer and every chart follow. Keep the KPI name identical in all three sheets — it is the join key.
How long does setup take?
Under 10 minutes if your monthly actuals and targets are already in a spreadsheet. The longest part is deciding your targets and your UTB/LTB direction per KPI; pasting the numbers and pressing refresh takes a couple of minutes.
Is this the same as the KPI Scorecard version?
No. The scorecard line is a different product with a different layout. This is the KPI dashboard line: a month picker, traffic-light counts, a KPI Trend page and a KPI Definition page. Treat the two as companions, not duplicates.
How does this compare with Buildertrend or Procore?
Those are construction-management platforms that run your jobs. This is a $12.99 monthly reporting layer you own outright. It will not schedule a crew or bill a client — it tells you, once a month, which of 14 KPIs hit target and which did not.
👤 About the Author
Built by PK — Microsoft Certified Professional with 15+ years of Excel, Google Sheets and Power BI experience. Founder of NextGenTemplates, reaching 300K+ subscribers across YouTube channels (@PKAnExcelExpert, @NextGenTemplates, @NeoTechNavigators). Every template is hand-built and tested before release.
🔗 Explore Related Templates
- Home Renovation Contractor KPI Scorecard in Google Sheets — the same topic as a scorecard rather than a dashboard.
- Kitchen Remodeling KPI Scorecard in Google Sheets and Bathroom Remodeling KPI Scorecard in Google Sheets — narrower trades, same scoring rules.
- Paving Contractor KPI Dashboard in Power BI and Masonry Contractor KPI Dashboard in Power BI — the same layout for other trades.
- Home Renovation Budget Tracker in Google Sheets — job-level budget tracking to feed the numbers above.
- Browse the full Power BI Dashboards catalogue.
Also available as: a Google Sheets edition is being prepared under the slug home-renovation-contractor-kpi-dashboard-in-google-sheets. It is still a draft, so it is named here rather than linked — a link would break until it goes live. The two editions are built independently and their KPI sets and page counts are not identical; what is described on this page is what the Power BI file actually holds.
📖 Click here to read the detailed blog post
🎥 Visit our YouTube channel for step-by-step video tutorials
👉 YouTube.com/@NextGenTemplates
📅 Last updated: September 2026