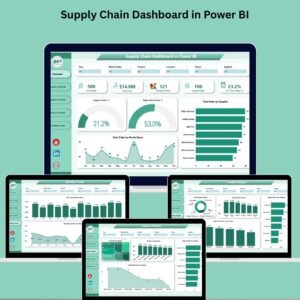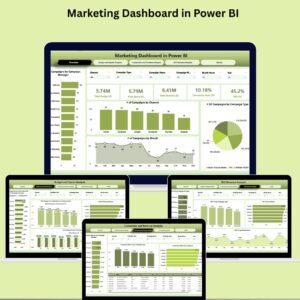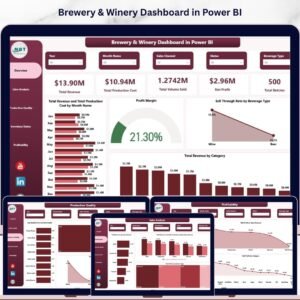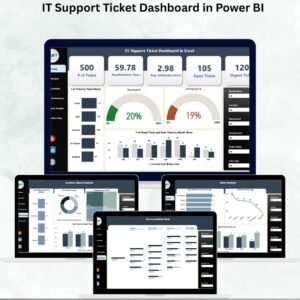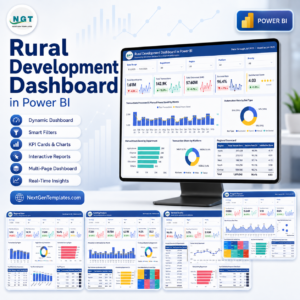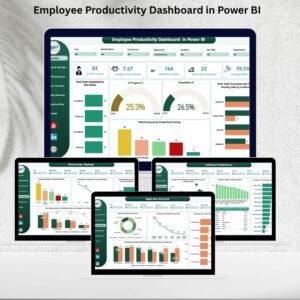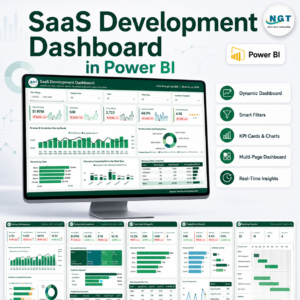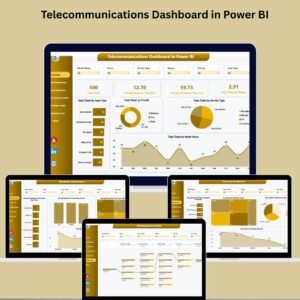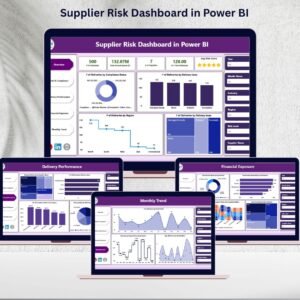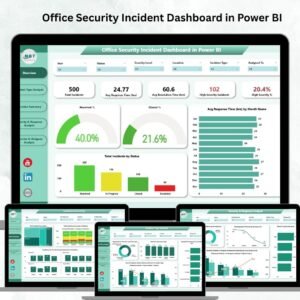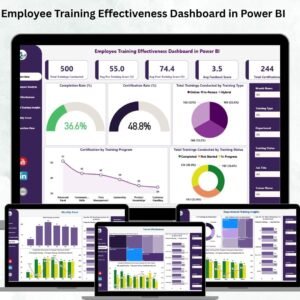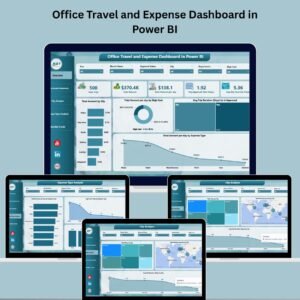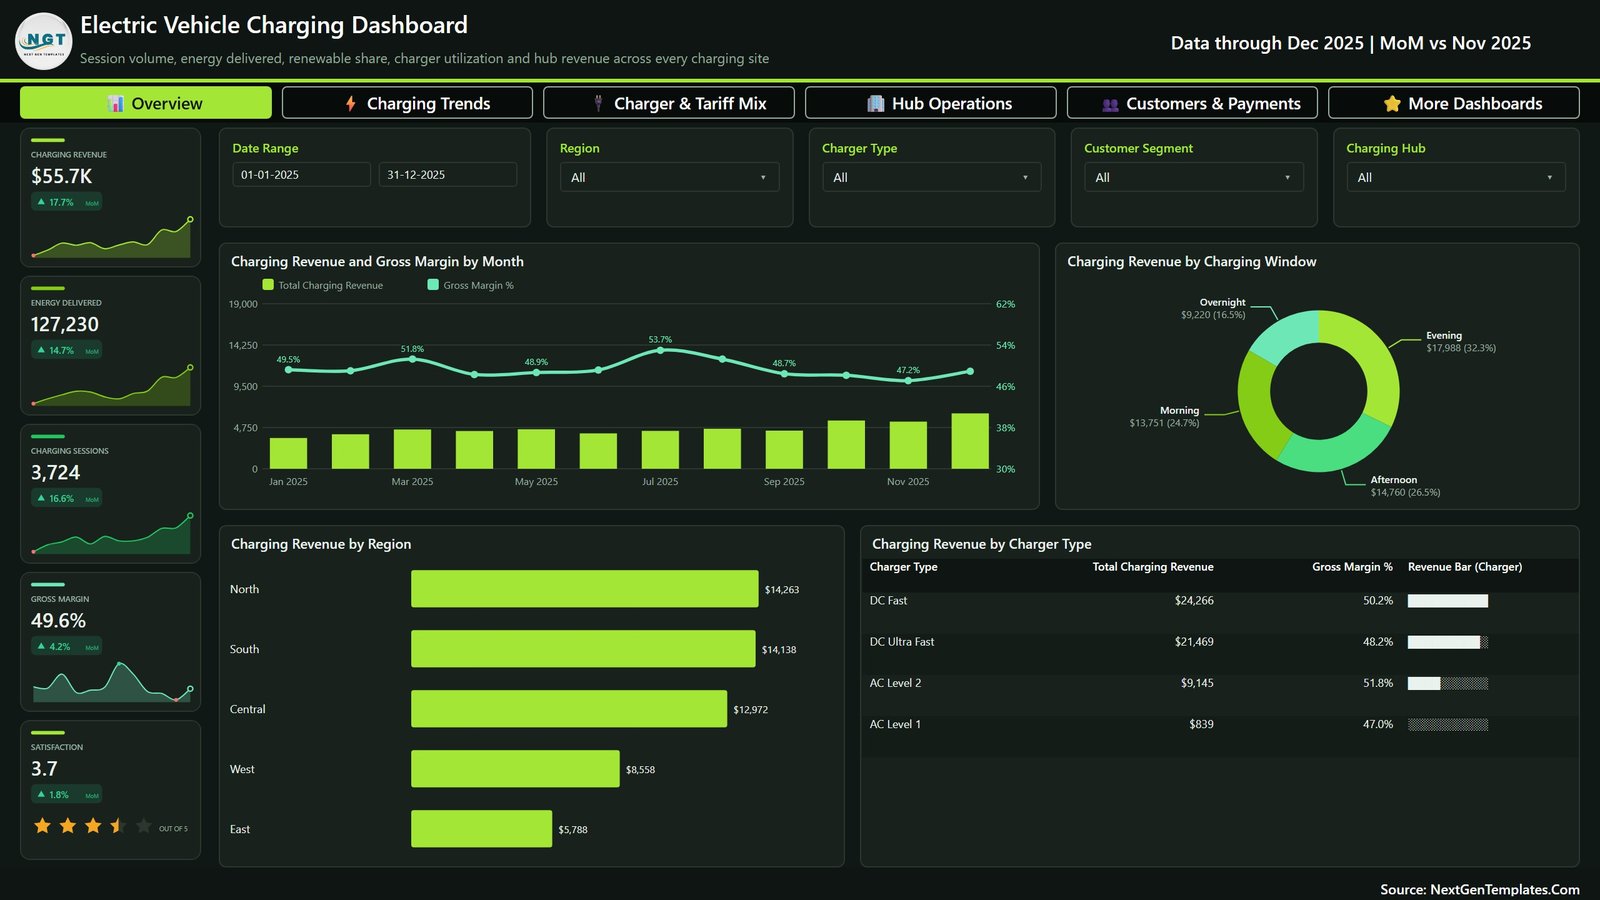
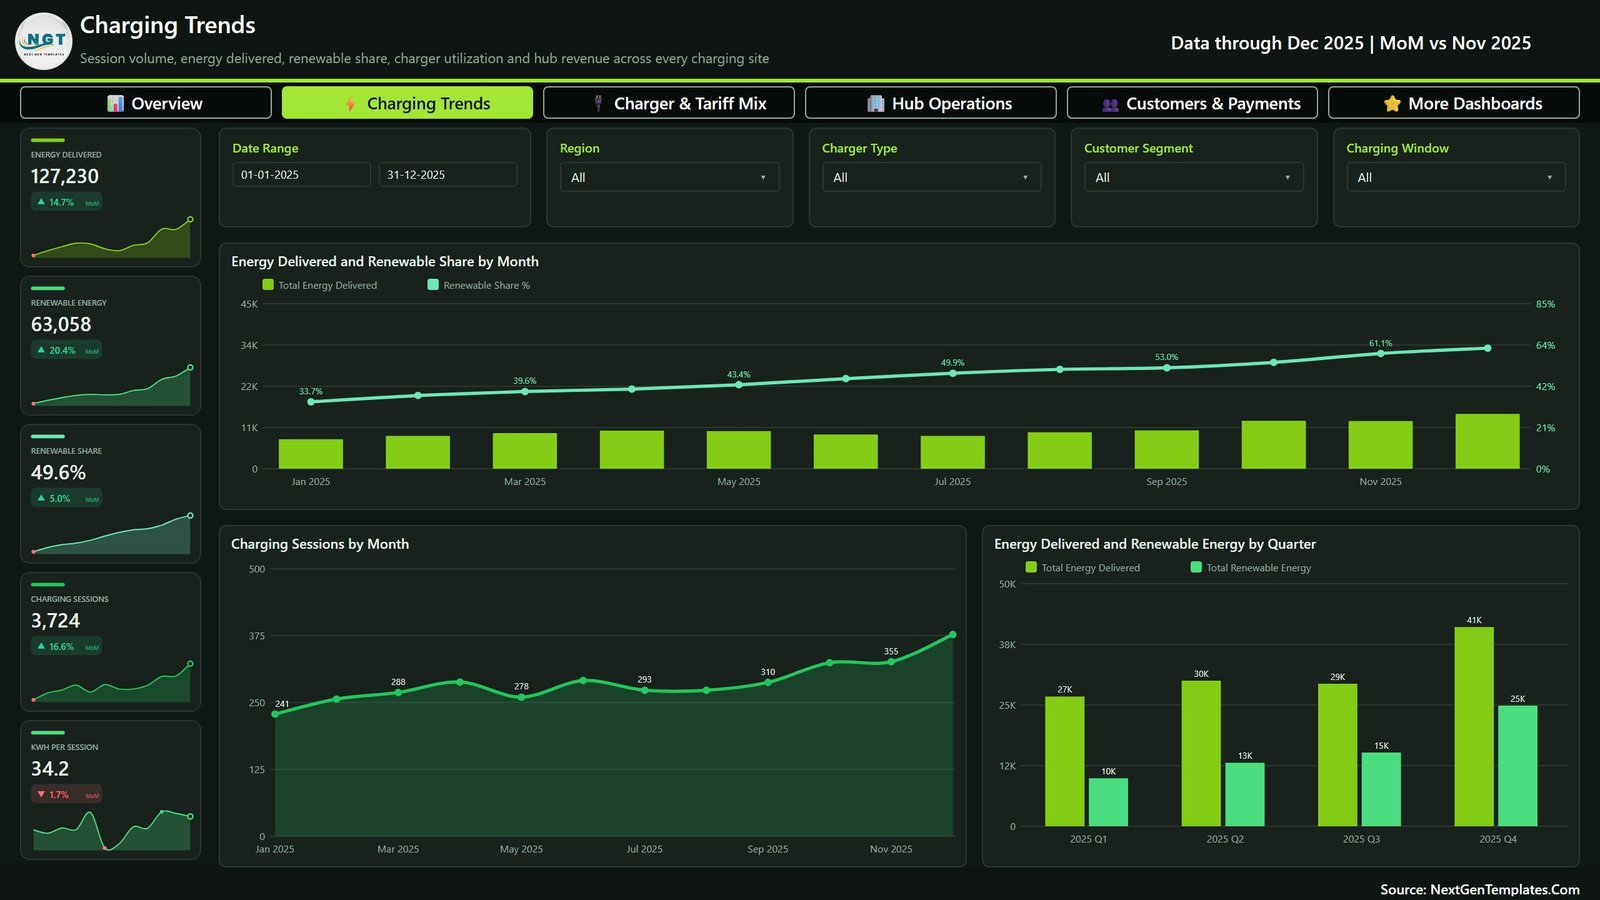
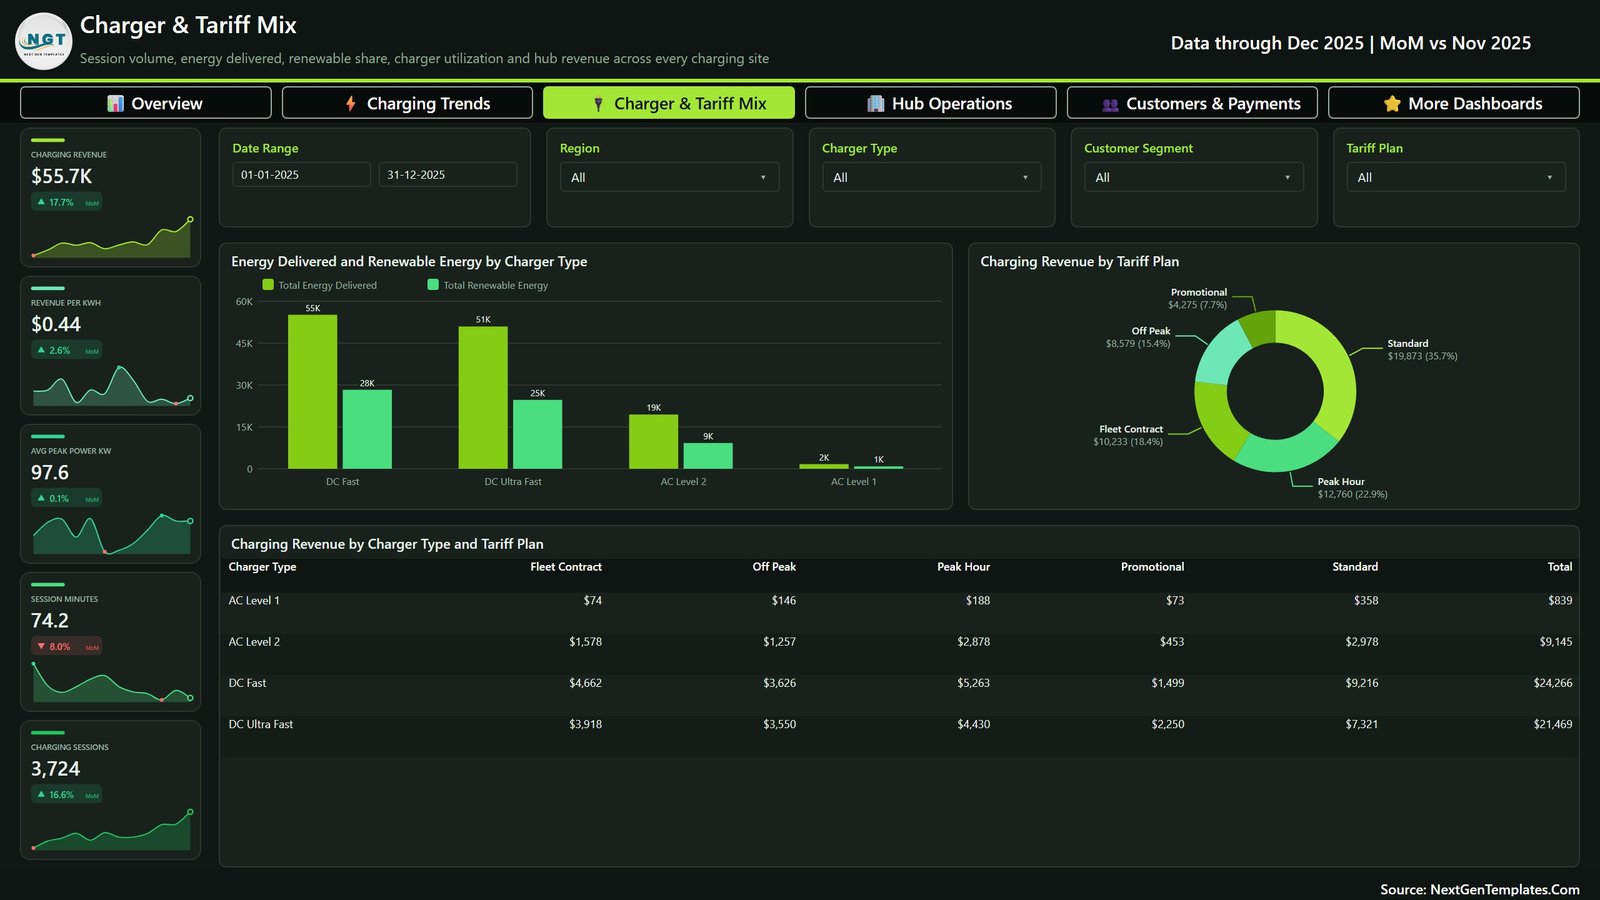
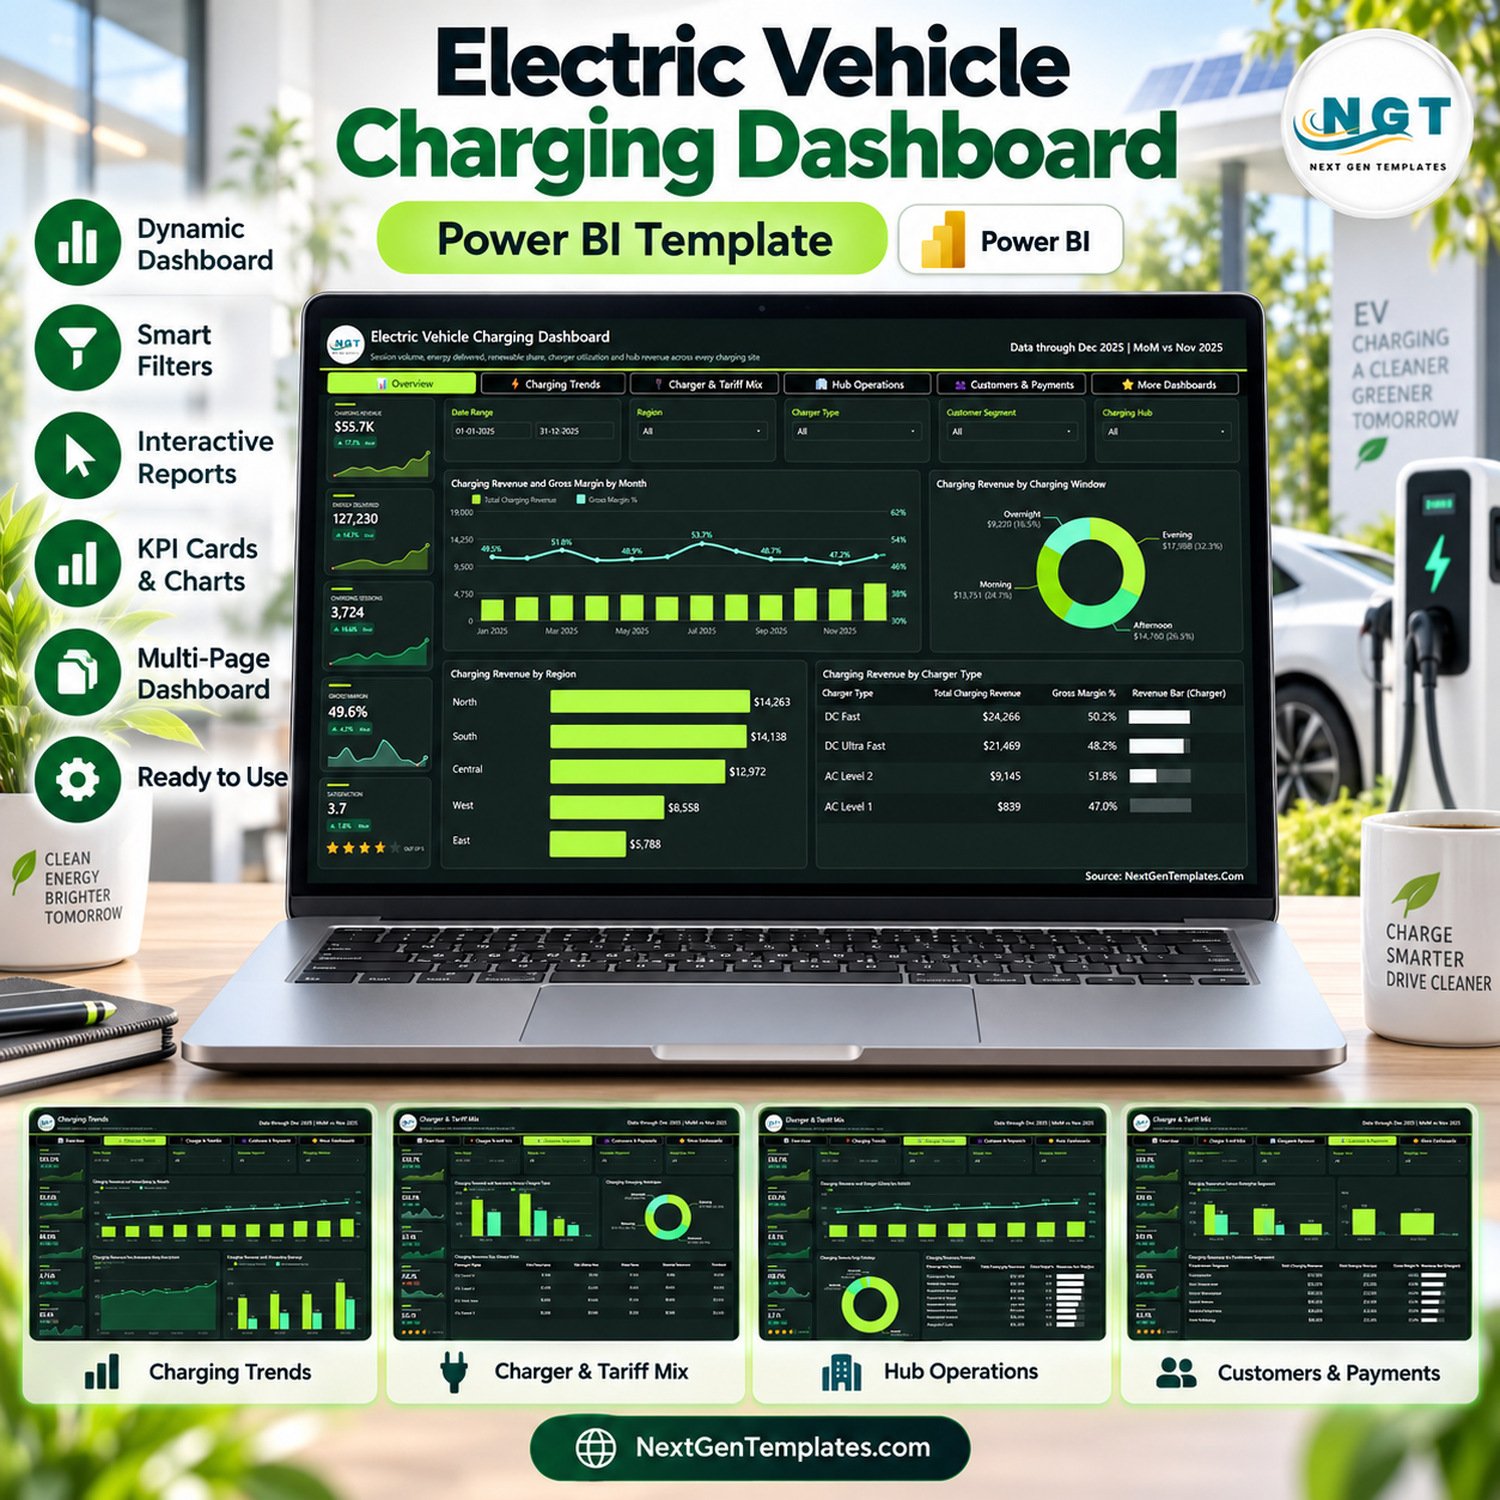
Electric Vehicle Charging Dashboard in Power BI presents charging revenue, sessions, energy, tariffs, hubs, customers, payments, utilization, and renewable-energy reporting across five analytical pages.
The ZIP includes an editable PBIX report, Data.xlsx with 500 fictional sample sessions, and a Power BI manual. Replace the examples with validated records and refresh the model. This reporting template does not control chargers, process payments, set tariffs, meter energy, dispatch technicians, forecast demand, or connect to a charging-network API.
Electric Vehicle Charging Dashboard in Power BI: five pages
- Overview: revenue, energy, sessions, margin, satisfaction, monthly performance, charging windows, regions, and charger types.
- Charging Trends: monthly energy, renewable share, session volume, and quarterly renewable energy.
- Charger & Tariff Mix: energy by charger type, revenue by tariff, and charger-by-tariff revenue.
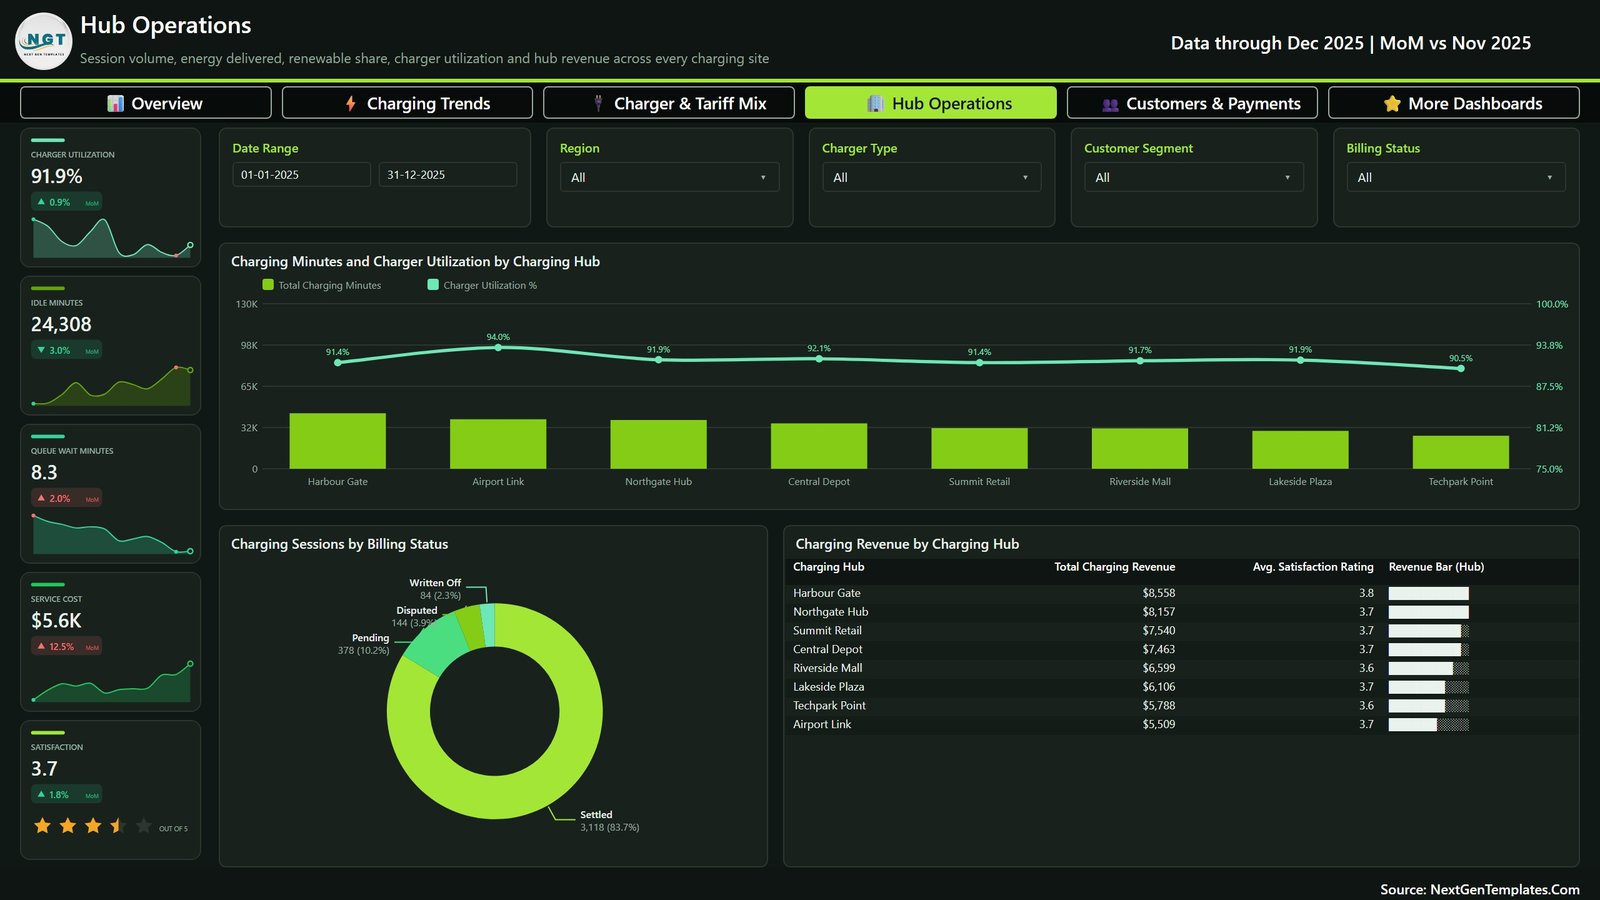
- Hub Operations: utilization, idle and queue minutes, service cost, billing status, hub revenue, and satisfaction.
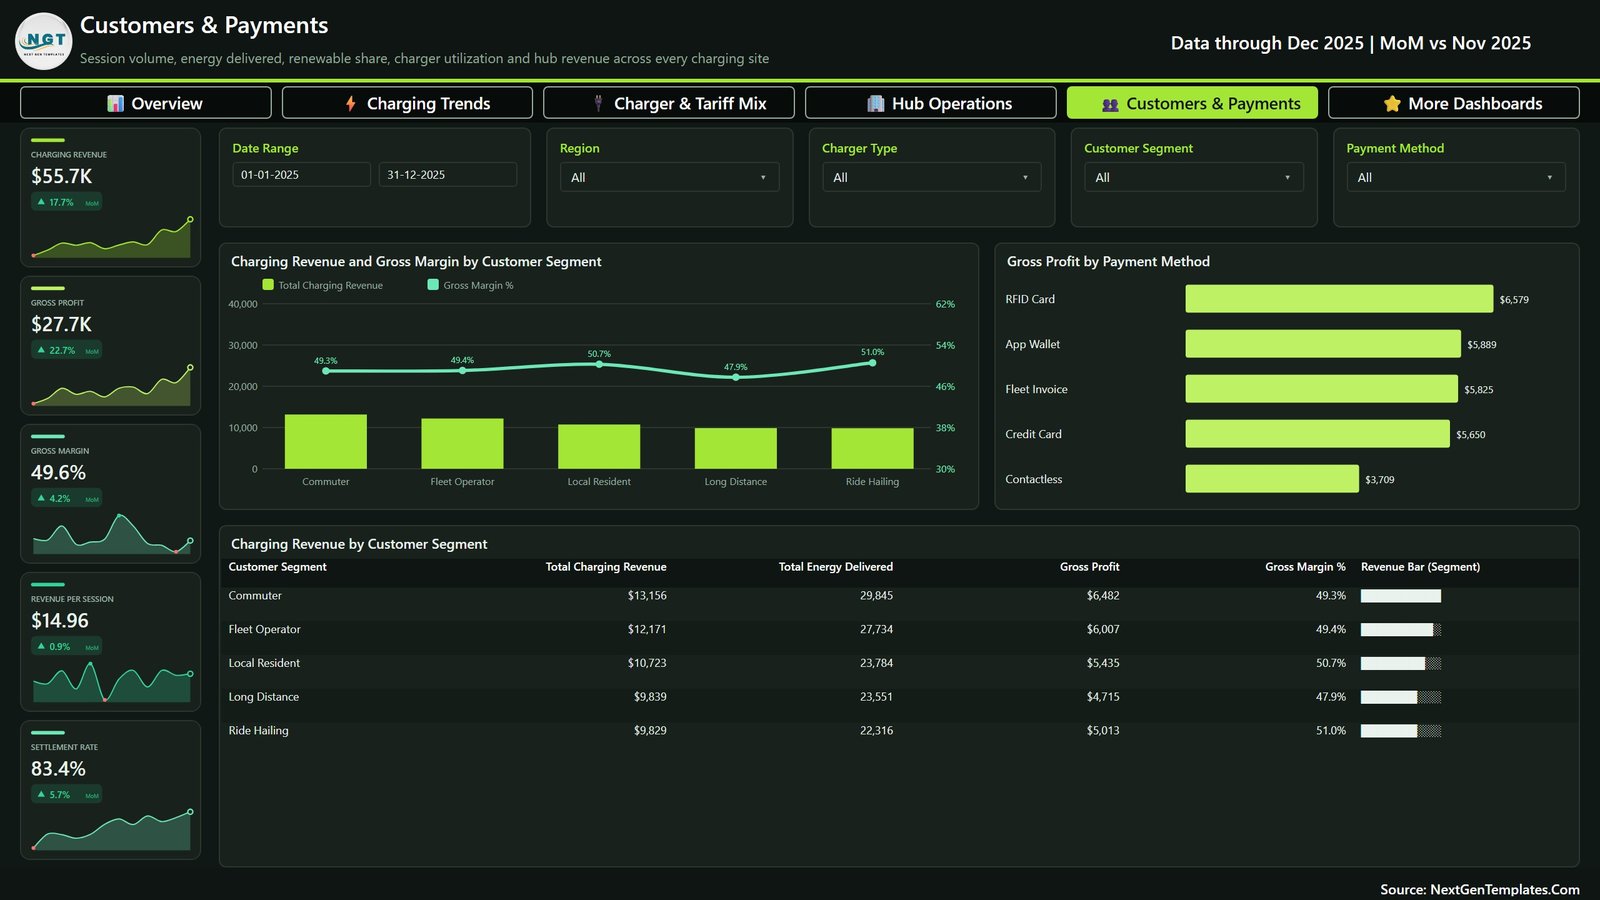
- Customers & Payments: revenue and margin by segment, gross profit by payment method, and segment scorecard.
Interactive filters
Filter by date, region, charger type, customer segment, hub, charging window, tariff, billing status, or payment method where relevant. The views summarize supplied data; they do not validate meter readings, payment settlement, renewable-energy provenance, or charger availability.
Editable data structure
The fictional dataset demonstrates session dates, hubs, regions, charger types, segments, tariff plans, charging windows, payment methods, billing status, energy, renewable energy, charging and idle time, queue time, peak power, revenue, cost, and satisfaction. Keep units and category names consistent.
Recommended workflow
- Save a clean backup.
- Map approved source fields to Data.xlsx.
- Standardize units, currencies, hubs, tariffs, segments, and statuses.
- Replace the examples and refresh Power BI.
- Reconcile cards and selected visuals to source systems.
- Document filters, exclusions, and refresh dates.
Operational and billing data can be sensitive. Restrict access and follow the security, privacy, retention, metering, tax, and payment rules applicable to your organization. An attractive chart cannot correct incomplete sessions, duplicated IDs, mixed energy units, or disputed payments.
Questions the report can support
Reviewers can ask where revenue and energy are concentrated, how renewable share changes, which charger types and tariffs contribute most, where utilization or queue time differs, and how payment and customer segments compare. Investigation and action remain in the authorized operational systems.
Validate each reporting cycle
Begin by checking the reporting date range and whether every expected hub submitted records. Compare the count of sessions, total energy, and billed revenue with the authorized charging platform. Sample several sessions across charger types and payment methods, and confirm that cancellations, failed sessions, write-offs, and disputed transactions are classified consistently.
Document how availability and utilization are calculated. A hub can show a high utilization percentage under one denominator and a very different figure under another. The same care applies to renewable share, gross margin, average revenue per session, and queue time. Preserve the definitions used for each published review.
Related charging and energy dashboards
Compare other operational reporting options in the Power BI dashboard collection, including the Electric Vehicle Charging KPI Dashboard in Excel and energy-focused templates. For general EV charging information, consult the U.S. Department of Energy Alternative Fuels Data Center or the competent energy and transport authority for your location.
Do not expose customer identifiers, payment credentials, precise access tokens, or infrastructure secrets in the data model. Use summarized or pseudonymized records where appropriate, and follow organizational incident-response procedures if a report reveals an operational or billing anomaly.
Archive the data dictionary and reconciliation evidence with each reporting cycle. Note source owners, refresh time, currency, time zone, energy unit, and any records excluded from the analysis. This makes later comparisons easier to reproduce and prevents a filter or definition change from being mistaken for operational improvement.
What you receive
- Editable PBIX report
- Five report pages
- Data.xlsx with 500 fictional sessions
- Power BI user manual
- Instant ZIP download
Use the dashboard as a controlled analytical layer for validated EV charging data.