

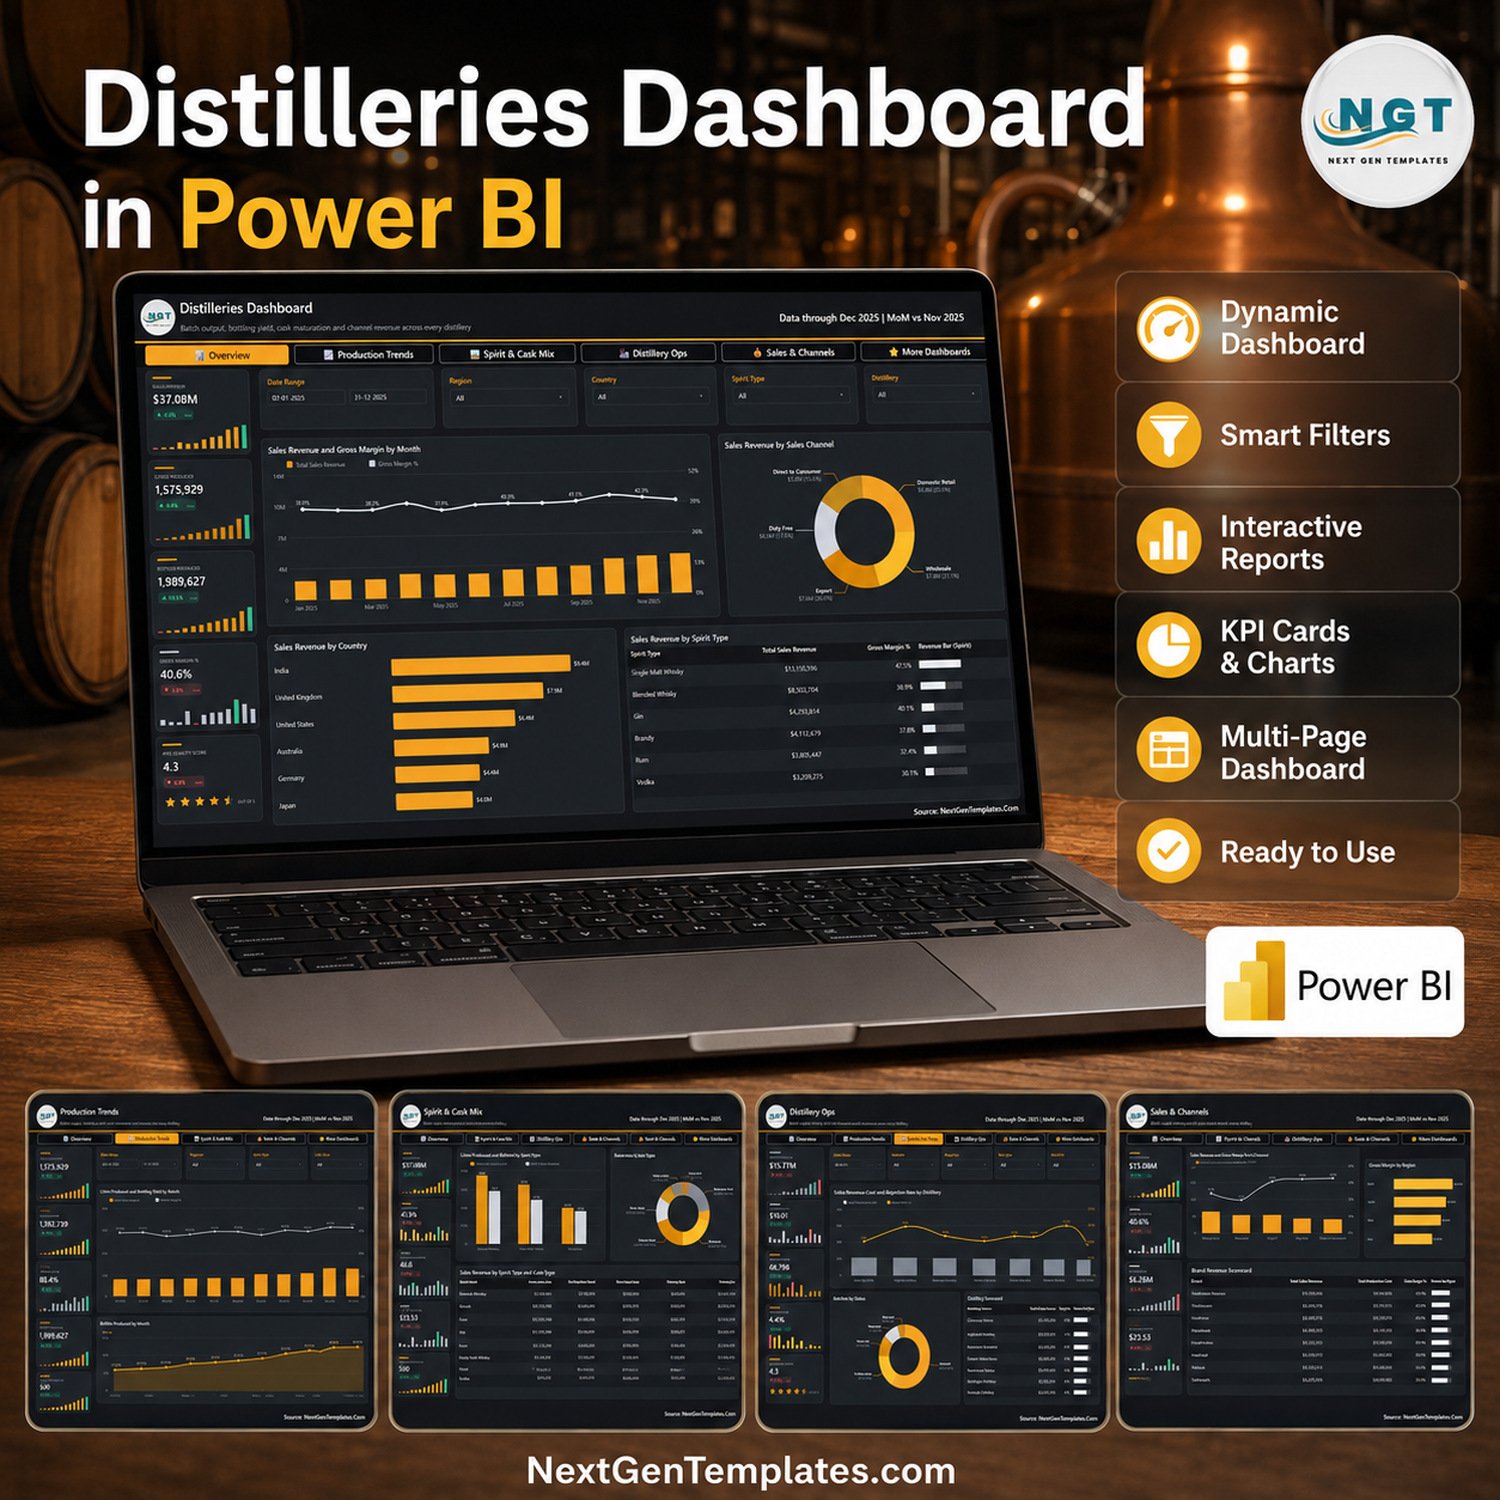

Five report pages, 500 sample production batches and 20 source columns covering eight distilleries, eight brands, six spirit types and six cask types. The Distilleries Dashboard in Power BI ships as a ready-built .pbix that opens in the free Power BI Desktop and shows $37.08M of sales revenue, 1,575,929 litres produced, 1,989,627 bottles produced, 88.4% bottling yield and a 4.4% rejection rate the moment you open it. Built by a Microsoft Certified Professional with 15+ years of Excel and Power BI work, and backed by 300K+ subscribers across our YouTube channels. If the file does not open in Power BI Desktop, contact us and we will fix it or refund you.
Key Features of the Distilleries Dashboard in Power BI
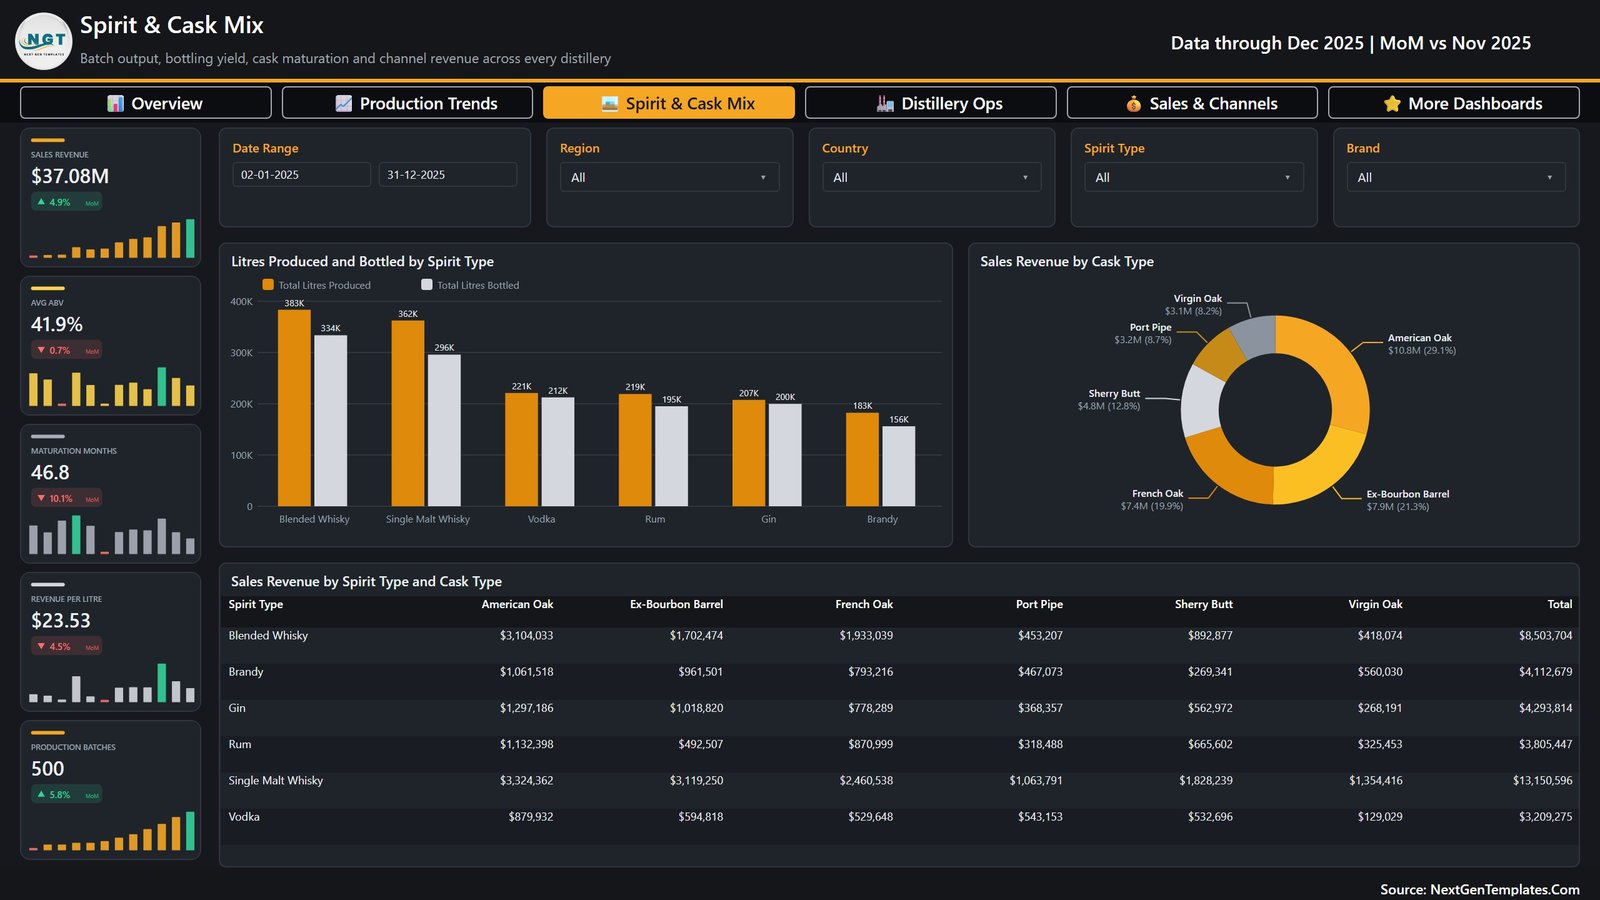
- Five linked report pages – Overview, Production Trends, Spirit & Cask Mix, Distillery Ops and Sales & Channels, with a button bar at the top of every page so you never hunt through the page tabs.
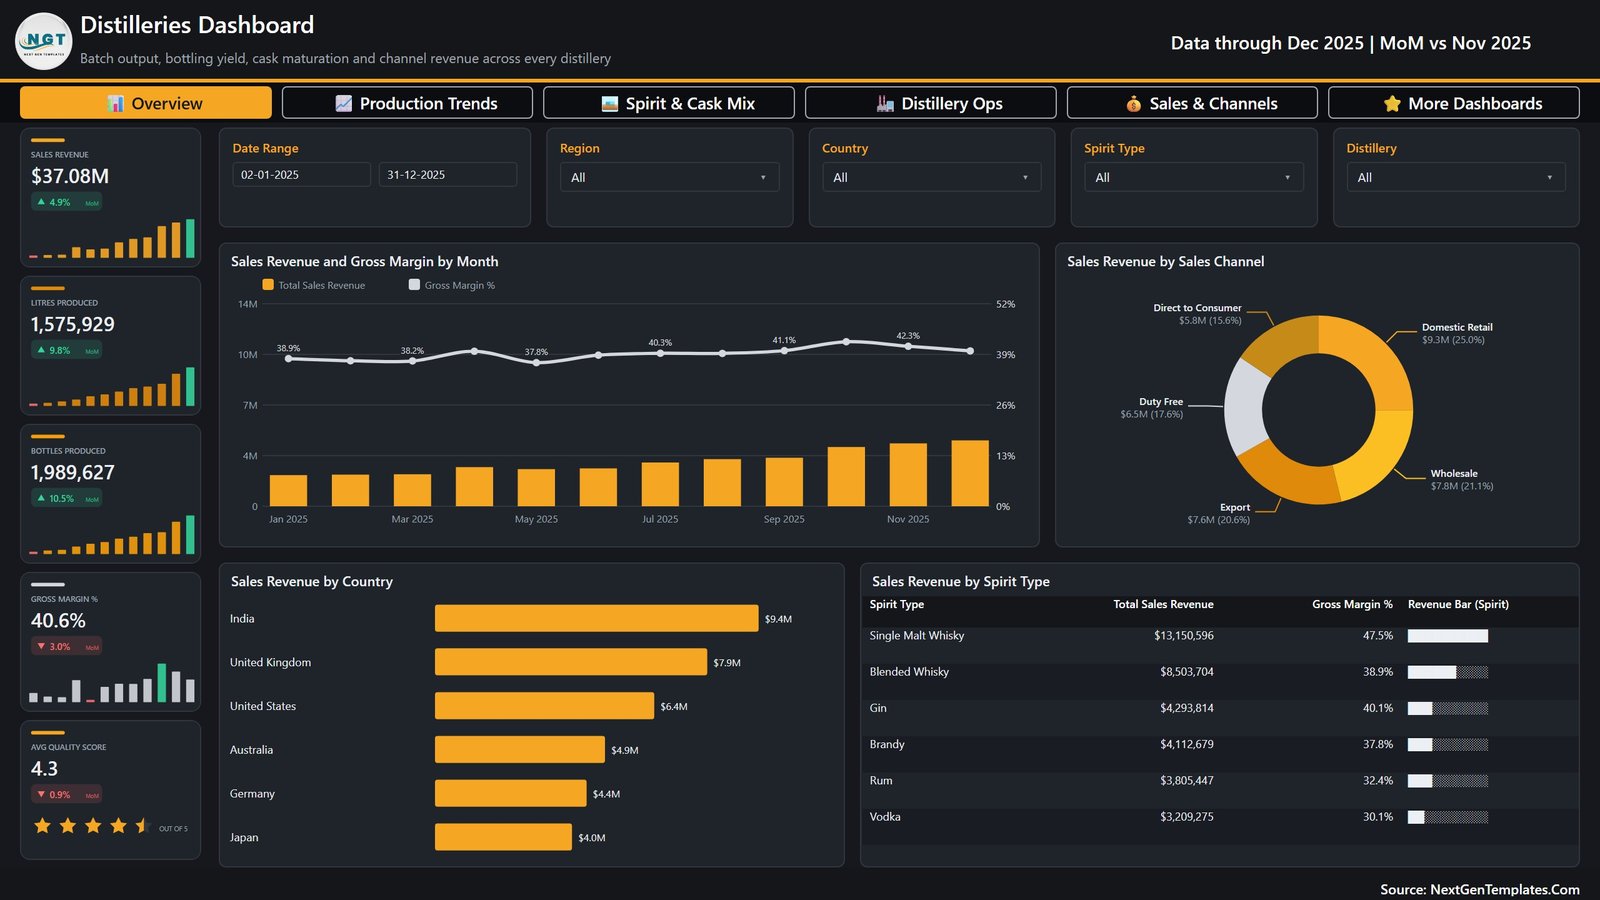
- 25 KPI cards with month-on-month deltas – each card carries an up or down arrow, a MoM percentage and its own 12-month sparkline. Sales Revenue reads $37.08M and +4.9% MoM; Gross Margin % reads 40.6% and -3.0%.
- Five slicers on every page – a Date Range pair plus Region, Country and Spirit Type on all five pages, and a fifth slicer that changes with the page: Distillery, Cask Type, Brand, Status or Sales Channel.
- Revenue and margin in one combo chart – Sales Revenue and Gross Margin by Month plots twelve revenue columns against a margin line that moves between 37.8% and 42.3%.
- Channel and cask donuts with values and shares – Domestic Retail $9.3M (25.0%), Wholesale $7.8M (21.1%), Export $7.6M (20.6%), Duty Free $6.5M (17.6%), Direct to Consumer $5.8M (15.6%).
- A six-by-six revenue matrix – Sales Revenue by Spirit Type and Cask Type crosses every spirit against every cask with a total column, so you can see that Single Malt Whisky in American Oak alone is worth $3,324,362.
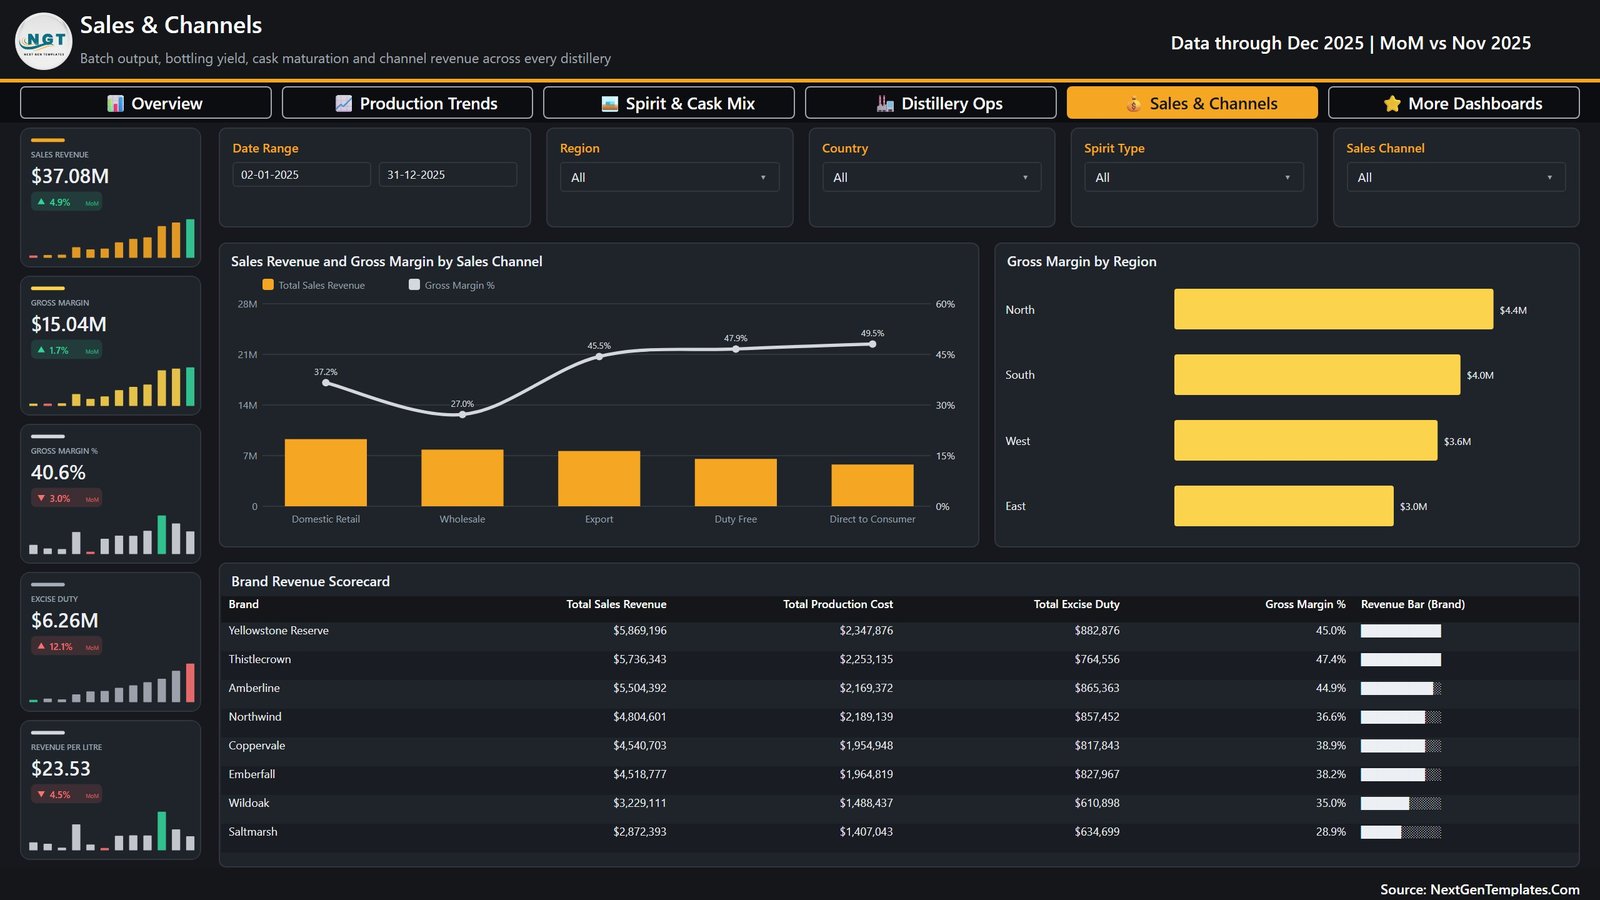
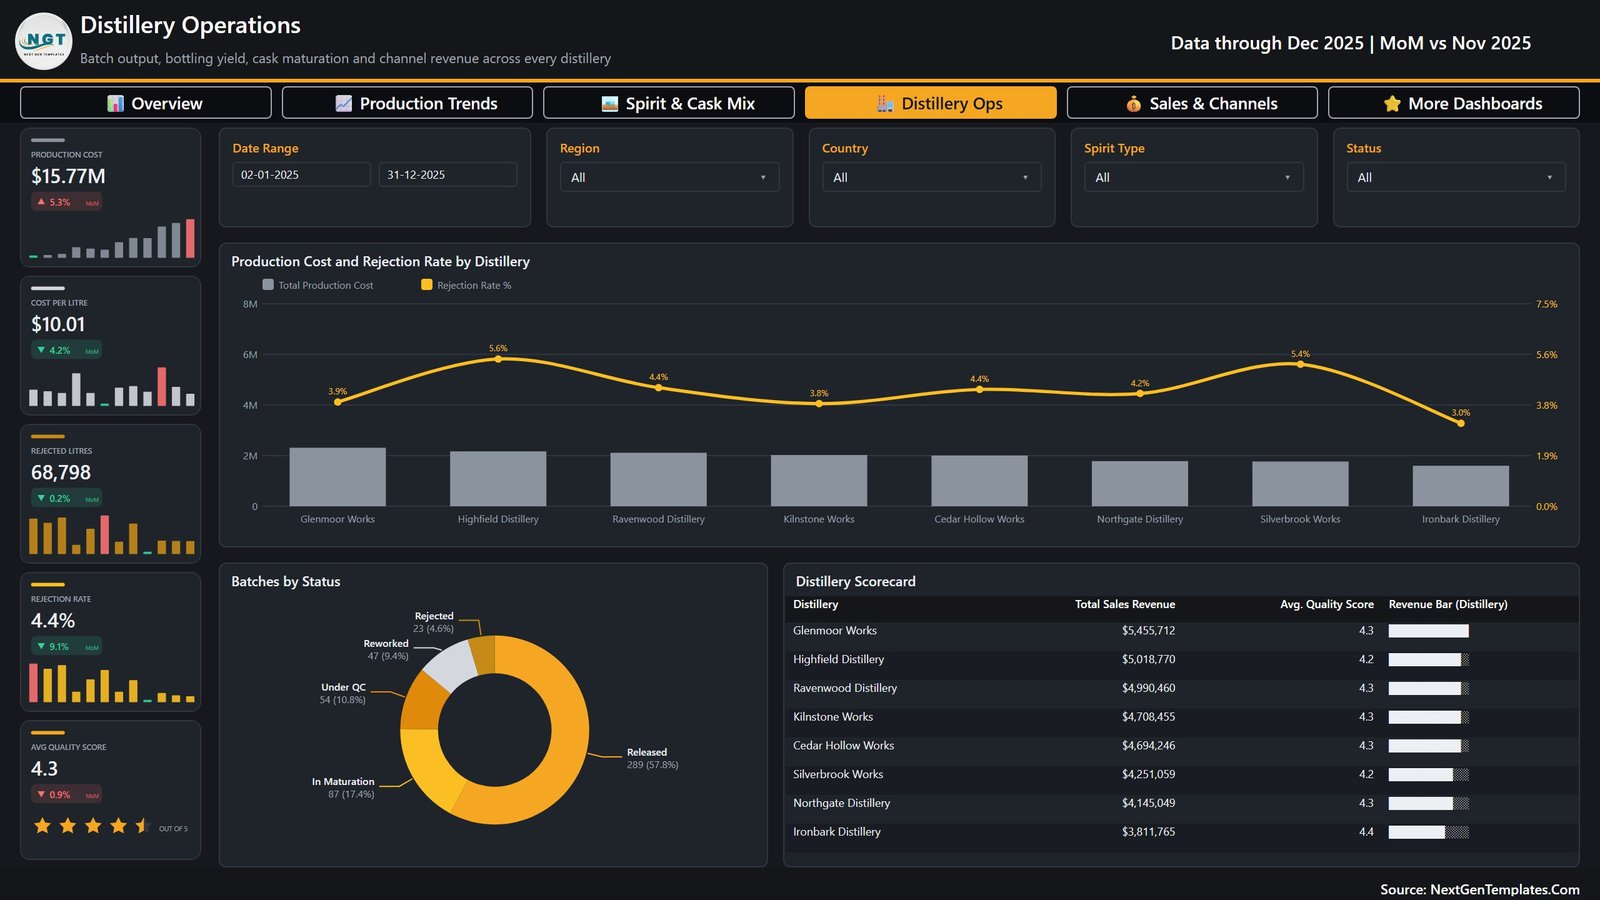
- Two scorecard tables – a Distillery Scorecard ranking eight sites by revenue and average quality score, and a Brand Revenue Scorecard showing revenue, production cost, excise duty and margin % for eight brands.
- Excise duty tracked as its own measure – $6.26M across the year, +12.1% MoM, so duty is never buried inside cost of goods.
- A 500-row Excel data source you can overwrite – replace the sample rows with your own batch export and every visual refreshes.
What’s Inside the Download
The ZIP holds three files and nothing else:
- Distilleries Dashboard in Power BI.pbix – the report itself, five pages, all measures and formatting already built.
- Data.xlsx – the 500-row source table. Columns: Batch ID, Production Date, Distillery, Region, Country, Spirit Type, Brand, Cask Type, Sales Channel, Litres Produced, Litres Bottled, Bottles Produced, Rejected Litres, Alcohol By Volume, Maturation Months, Quality Score, Production Cost, Sales Revenue, Excise Duty and Status.
- Power BI Dashboard – User Manual.pdf – how to repoint the data source, refresh, and publish to the Power BI service.
Distilleries Dashboard in Power BI vs. an Excel Build vs. a Paid Distillery ERP
| This template | Excel dashboard build | Paid distillery ERP / BI suite | |
|---|---|---|---|
| Cost | $29.99 one time | $0 plus your build time | $300-$1,200 per month |
| Platform | Power BI Desktop (free) | Microsoft Excel | Vendor cloud |
| Setup time | Under 15 minutes | 20-40 hours to build | 4-12 week implementation |
| Real-time team collaboration | Yes, once published to the Power BI service | Only via shared workbook | Yes |
| Mobile access | Power BI mobile app | Limited | Yes |
| Customisable fields | Full – it is your .pbix | Full | Vendor-controlled |
| Share with a link | Yes, via the Power BI service | No | Yes |
| Year-1 cost at 5 users | $29.99 | $0 plus 30 hours of labour | $18,000-$72,000 |
| Cask maturation tracking | Built in – average maturation months plus revenue by six cask types | Manual | Usually a paid module |
| Excise duty reporting | Built in as a KPI and a scorecard column | Manual | Yes |
Who This Template Is For – and Who It’s Not For
It fits a distillery group operations manager running three to twelve sites, a spirits brand owner who contract-distills and wants brand-level margin, a production planner reconciling litres produced against litres bottled, and an analyst who has batch data in a spreadsheet and needs a report by Friday.
It does not fit a single micro-still with under 20 batches a year – the visuals will look empty. It is not a compliance filing tool: the excise duty figures are for internal management reporting and are not a substitute for your TTB, HMRC or local revenue submissions. It is not a live plant historian, does not connect to SCADA, and has no barcode or warehouse-management module. And it is not a licence, permit or bond tracker.
How to Use It
- Unzip the download and open the .pbix in Power BI Desktop, which Microsoft gives away free.
- Open Data.xlsx, keep the 20 column headers exactly as they are, and paste your own batch rows underneath.
- In Power BI, use Transform data > Data source settings to point the query at your copy of Data.xlsx, then click Refresh.
- Set the Date Range slicer to the period you want and leave Region, Country and Spirit Type on All for a group view.
- Use the button bar to move between the five pages; each page keeps its own fifth slicer.
- Publish to the Power BI service if you want to share a link with your production and sales teams.
Real-World Use Cases
Priya, group operations manager, eight sites. She opens Distillery Ops every Monday. Highfield Distillery is running a 5.6% rejection rate against a 4.4% group average and Silverbrook is at 5.4%, so those two get the quality review this week while Ironbark at 3.0% is left alone.
Callum, brand owner. He filters to his own labels on the Brand Revenue Scorecard. Yellowstone Reserve turns $5.87M of revenue at 45.0% margin while Saltmarsh turns $2.87M at 28.9%, which tells him where the next marketing pound goes.
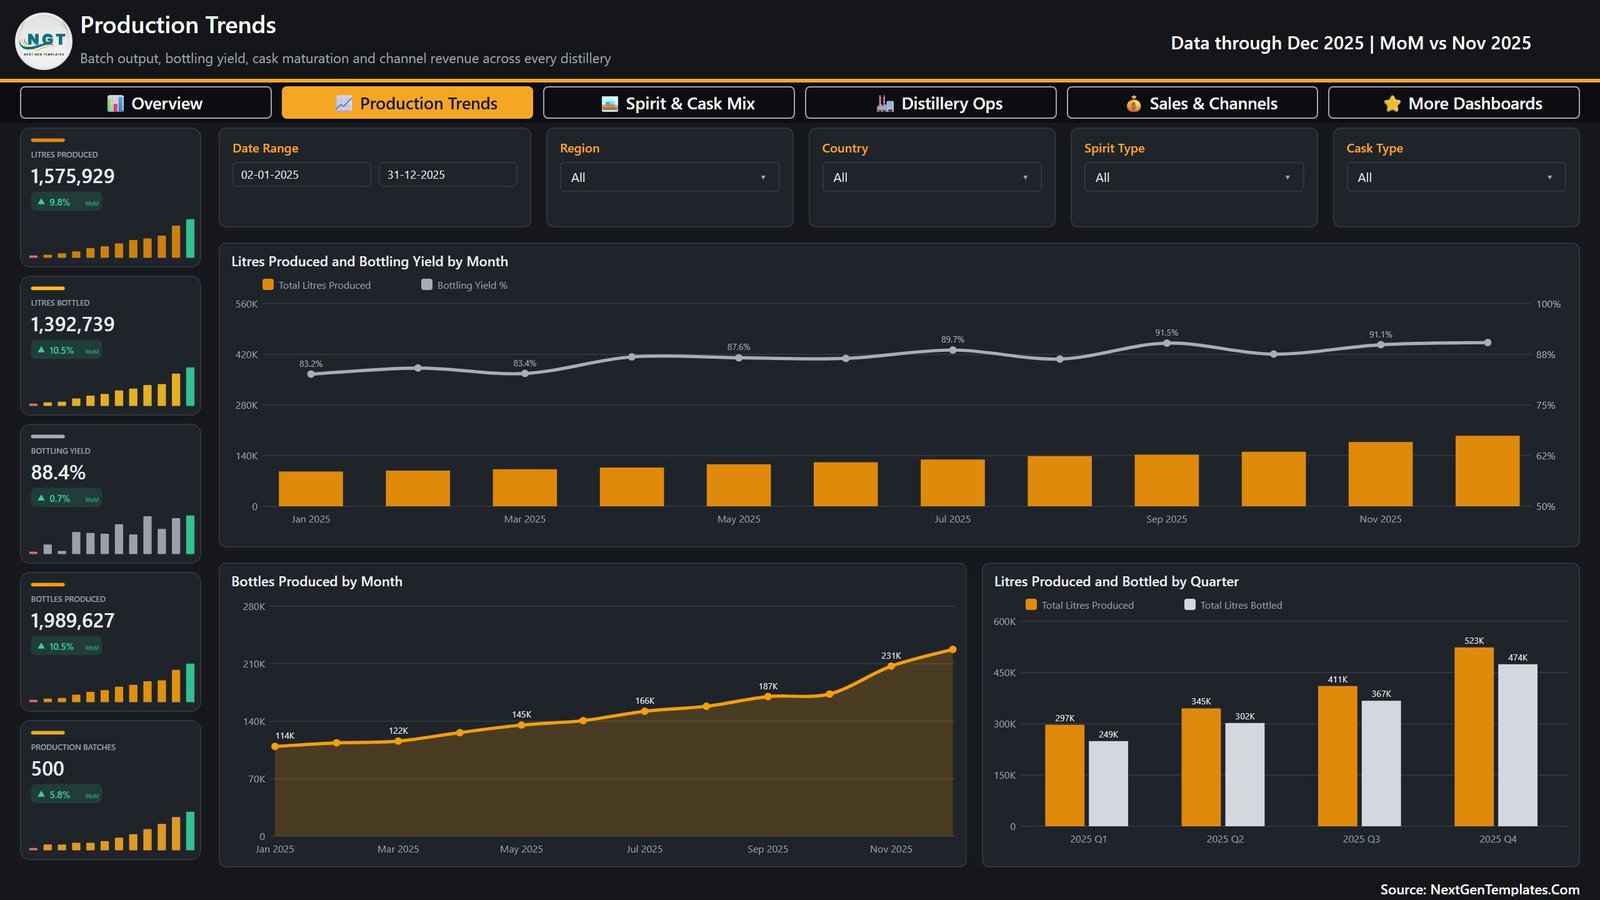
Anita, production planner. She watches Litres Produced and Bottling Yield by Month. Yield climbed from 83.2% in January to 91.5% in September, and the quarterly chart shows Q4 producing 523K litres against 474K bottled – the gap she has to close with bottling-line capacity.
Frequently Asked Questions
Do I need a paid Power BI licence?
No. Power BI Desktop is free from Microsoft and opens the file. You only need a Pro or Premium licence if you want to publish and share the report through the Power BI service.
Can I use my own distillery names, brands and cask types?
Yes. Every dimension in the report is driven by the Data.xlsx columns. Replace the sample values and the slicers, donuts, matrix and scorecards relabel themselves.
What if my data has more than 500 rows?
Add as many rows as you like. 500 is only the sample size; Power BI handles millions of rows on the same model.
Is the sample data real?
No. Distillery names, brands and figures are realistic but invented, so you can explore the report before loading anything of your own.
Can I add my own KPI or visual?
Yes. The .pbix is unlocked – add measures, change colours, drop pages, or reuse the theme in another report.
Does it handle multiple currencies?
Not out of the box. Sales Revenue, Production Cost and Excise Duty are single-currency columns. Convert to one reporting currency before you load the data.
Is there an Excel version?
Yes – the same report is available as the Distilleries Dashboard in Excel if your team does not use Power BI.
About the Author
Built by PK – Microsoft Certified Professional with 15+ years of Excel, Google Sheets, and Power BI experience. Founder of NextGenTemplates, reaching 300K+ subscribers across YouTube channels. Every template is hand-built and tested before release.
Explore Related Templates
- Distilleries Dashboard in Excel – the same five-page report for teams that live in Excel.
- Distilleries KPI Dashboard in Power BI – a target-versus-actual scorecard, a different family from this analytical dashboard.
- Micro Breweries and Pubs Dashboard in Power BI – for beer-side operations.
- Craft Winery and Vineyard Dashboard in Power BI – vineyard, harvest and cellar analytics.
- Distillery KPI Scorecard in Excel – a monthly traffic-light scorecard.
- Browse every Power BI dashboard or the wider Power BI category.
Buy once, own it forever. Instant download, no subscription, unlimited use inside your own business. Add it to your cart and you will be looking at your own batch data inside 15 minutes.
Last updated: 9 September 2026.














Reviews
There are no reviews yet.