



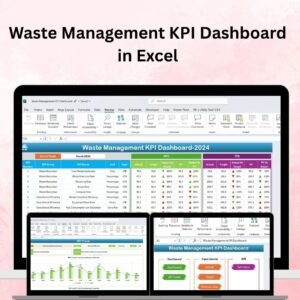
The Waste Management KPI Dashboard in Excel is an essential tool designed for businesses and organizations in the waste management industry to track, analyze, and optimize key performance indicators (KPIs). Whether you’re managing waste collection, recycling processes, disposal efficiency, or customer satisfaction, this dashboard provides a centralized view of your operations, helping you make data-driven decisions to reduce costs, improve sustainability, and ensure regulatory compliance.
With customizable features, real-time data updates, and visual charts, this Excel-based dashboard is perfect for waste management companies, municipal services, and environmental consultants who need to monitor their performance, track operational efficiency, and improve service quality.

Key Features of the Waste Management KPI Dashboard in Excel:
📊 Comprehensive KPI Tracking
Track essential waste management KPIs, such as collection efficiency, recycling rates, cost per ton, waste diversion, and customer satisfaction—all in one dashboard.
📈 Real-Time Performance Monitoring
Monitor your waste management operations in real time, allowing you to quickly identify bottlenecks, optimize processes, and maintain a smooth operation.
📅 Month-to-Date (MTD) and Year-to-Date (YTD) Tracking
Track your waste management performance over different time periods, comparing current data to historical performance to spot trends and areas for improvement.
🎯 Goal Setting and Performance Comparison
Set specific goals for each KPI and compare actual performance against those targets, ensuring that your waste management initiatives align with business and sustainability goals.
🛠 Customizable Inputs
Easily input data such as collection volumes, recycling rates, customer feedback, and operational costs, while customizing the dashboard to suit your specific waste management needs.
🔔 Conditional Formatting Alerts
Get real-time alerts with color-coded indicators to highlight underperforming areas, such as low recycling rates, high operational costs, or missed collection targets.
🌱 Sustainability and Waste Diversion Insights
Gain insights into your sustainability efforts by tracking metrics like recycling and waste diversion, ensuring your business meets environmental standards.
🚀 Why You’ll Love the Waste Management KPI Dashboard in Excel:
✅ Optimize Waste Collection – Track waste collection efficiency, ensuring timely pickups and optimized routing for cost-effective service delivery.
✅ Increase Recycling and Diversion – Measure recycling rates, waste diversion, and sustainability initiatives to reduce landfill waste and increase environmental responsibility.
✅ Improve Operational Efficiency – Monitor operational costs and resource utilization to streamline waste management processes and reduce unnecessary expenditures.
✅ Enhance Customer Satisfaction – Track customer satisfaction metrics and feedback to ensure high-quality service and identify areas for improvement.
✅ User-Friendly Interface – The dashboard is simple to use, even for non-technical staff, making it easy to input data and analyze performance.
✅ Fully Customizable – Tailor the dashboard to your specific waste management needs, whether you’re focusing on residential, commercial, or industrial waste services.
What’s Inside the Waste Management KPI Dashboard in Excel:
- Waste Collection Efficiency KPI: Track the efficiency of waste collection, including the number of bins collected, time taken per route, and missed pickups.
- Recycling Rate KPI: Monitor the percentage of waste diverted from landfills through recycling, composting, and other diversion methods.
- Cost per Ton KPI: Measure the operational cost per ton of waste collected and processed to ensure cost-effective waste management practices.
- Customer Satisfaction KPI: Measure customer satisfaction levels based on feedback, complaints, and service delivery quality.
- Waste Diversion KPI: Track the percentage of waste diverted from landfills, aiming for higher diversion rates in line with sustainability goals.
- Compliance and Regulatory KPI: Ensure that all waste management operations comply with local, state, and federal regulations.
- Employee Safety KPI: Track safety incidents, injuries, and compliance with health and safety standards to maintain a safe work environment.
How to Use the Waste Management KPI Dashboard in Excel:
1️⃣ Download the Template – Access your Excel file instantly upon purchase.
2️⃣ Input Your Waste Data – Enter your collection volumes, recycling rates, costs, customer feedback, and other relevant data into the provided fields.
3️⃣ Set Operational Targets – Define your KPIs for collection efficiency, recycling rates, and customer satisfaction to guide your waste management strategy.
4️⃣ Track Performance – Monitor your waste management performance in real-time, and make adjustments to improve efficiency and sustainability.
5️⃣ Generate Reports – Use the dashboard to generate reports for internal reviews, client presentations, or regulatory compliance documentation.
Who Can Benefit from the Waste Management KPI Dashboard in Excel:
- Waste Management Companies
- Municipal Services
- Recycling Facilities
- Environmental Consultants
- Operations Managers
- Sustainability Managers
- Business Owners
- Regulatory Affairs Teams
The Waste Management KPI Dashboard in Excel is the perfect solution for businesses in the waste management industry looking to track operational performance, optimize processes, and improve sustainability efforts.
Click here to read the Detailed blog post
https://www.pk-anexcelexpert.com/waste-management-kpi-dashboard-in-excel/
Visit our YouTube channel to learn step-by-step video tutorials
Youtube.com/@PKAnExcelExpert
Compatibility and Requirements
- Works in Microsoft Excel desktop (Excel 2016 or later, or Microsoft 365).
- Microsoft’s guide Create a chart from start to finish explains the Excel feature this file is built on.
Frequently Asked Questions
Which KPIs does the Waste Management KPI Dashboard cover?
Collection efficiency, recycling rate, cost per ton, customer satisfaction, waste diversion, compliance and employee safety.
Can I see MTD and YTD results?
Yes. The dashboard tracks Month-to-Date and Year-to-Date performance and compares it with past results.
Can I set targets?
Yes. Set a target for each KPI and the dashboard compares actual performance against it.
How are weak results flagged?
Conditional formatting color codes underperforming KPIs, such as a low recycling rate or high operating cost.
Related Waste and Environmental Templates
- Waste Management KPI Dashboard in Power BI: the same KPIs in Power BI
- Waste Management KPI Dashboard in Google Sheets: a browser version for shared use
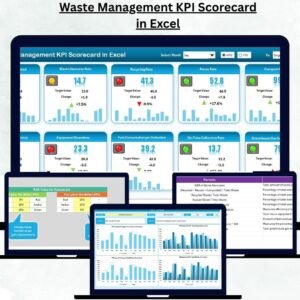
- Waste Management KPI Scorecard in Excel: a scorecard view of the same targets
- Recycling KPI Scorecard in Excel: focus on recycling
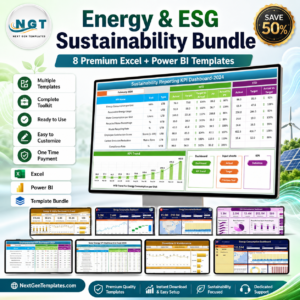
- Energy & ESG Sustainability Bundle: 8 sustainability templates in one download
Browse all Excel KPI dashboards or the Excel operations templates.





























Reviews
There are no reviews yet.