



The Waste Management KPI Dashboard in Power BI is an advanced and interactive tool designed to help waste management companies, municipalities, and environmental organizations track and manage key performance indicators (KPIs) related to waste collection, recycling, operational efficiency, financial health, and environmental impact. This Power BI dashboard offers a comprehensive view of waste management operations, enabling organizations to optimize their services, reduce operational costs, and improve sustainability.
With real-time reporting and highly customizable features, this dashboard allows waste management providers to make data-driven decisions, streamline operations, and ensure that their services are both effective and environmentally responsible.

Key Features of the Waste Management KPI Dashboard in Power BI:
♻️ Waste Collection Metrics
Track key metrics such as waste collected, recycling rates, and tonnage per material type to evaluate the effectiveness of waste collection efforts.
💰 Revenue and Cost Tracking
Monitor revenue from waste management services, government incentives, and recycling programs, while also tracking operational expenses to ensure financial sustainability.
📊 Recycling Efficiency
Monitor recycling performance by tracking the amount of recyclable materials processed, waste diversion rates, and the effectiveness of recycling initiatives.
🌍 Environmental Impact Monitoring
Track the environmental impact of your waste management efforts, including CO2 emissions reduction, energy savings, and landfill diversion rates.
📈 Operational Efficiency
Measure operational efficiency with KPIs such as collection time, fleet utilization, waste pickup frequency, and service delivery timeliness.
🚀 Why You’ll Love the Waste Management KPI Dashboard in Power BI:
✅ Track Waste Collection and Recycling – Monitor waste collection metrics, recycling rates, and tonnage per material type to assess program effectiveness.
✅ Monitor Financial Health – Track revenue, operational costs, and sustainability programs to ensure the financial stability of your waste management services.
✅ Evaluate Recycling Performance – Monitor the amount of recyclable materials processed and evaluate the success of your recycling initiatives.
✅ Measure Environmental Impact – Track reductions in CO2 emissions and energy savings to demonstrate the environmental benefits of your waste management efforts.
✅ Optimize Operational Efficiency – Track service delivery time, fleet utilization, and other operational metrics to improve the efficiency of your waste collection services.
✅ Fully Customizable and Interactive – Tailor the dashboard to your waste management program’s unique needs, with real-time data visualizations and interactive reports.
What’s Inside the Waste Management KPI Dashboard in Power BI:
Waste Collection Metrics: Track waste collection volumes, recycling rates, and tonnage of various materials to assess your program’s performance.
Revenue and Expenses: Monitor revenue from waste management services, recycling programs, and government incentives, and track operational costs to ensure financial sustainability.
Recycling Efficiency: Track the amount of recyclable materials processed and the efficiency of your recycling efforts, including diversion rates and material-specific performance.
Environmental Impact: Track reductions in CO2 emissions, energy savings, and landfill diversion rates to measure the environmental benefits of your waste management program.
Operational Efficiency: Track key operational metrics such as collection time, fleet utilization, waste pickup frequency, and timeliness of service delivery to improve operational performance.
Custom Reports: Generate detailed reports on waste collection, recycling performance, environmental impact, and financials for decision-making and performance optimization.
How to Use the Waste Management KPI Dashboard in Power BI:
1️⃣ Download the Power BI Template – Instantly access your Power BI file upon purchase.
2️⃣ Input Data – Add your waste collection, recycling rates, revenue, and operational metrics to start tracking key performance indicators.
3️⃣ Monitor Waste Collection and Recycling – Use the dashboard to monitor waste collection volumes, recycling performance, and diversion rates.
4️⃣ Track Financials – Monitor revenue from waste services, expenses, and sustainability programs to maintain financial health.
5️⃣ Evaluate Operational Efficiency – Measure key metrics such as service delivery time, fleet utilization, and waste collection frequency to optimize operations.
6️⃣ Generate Reports – Create detailed reports summarizing performance metrics, financials, environmental impact, and operational efficiency.
Who Can Benefit from the Waste Management KPI Dashboard in Power BI:
Waste Management Companies
Environmental Organizations
Municipalities and Government Agencies
Recycling Program Managers
Sustainability Consultants
Financial Analysts in Waste Management
Operations Managers in Environmental Services
Non-Profit Environmental Organizations
Corporations Focused on Sustainability
Fleet Managers in Waste Management
The Waste Management KPI Dashboard in Power BI is an indispensable tool for optimizing waste management operations, improving recycling efforts, and tracking environmental impacts. By monitoring key performance metrics such as waste collection, financial performance, recycling efficiency, and operational efficiency, this dashboard ensures that your services are sustainable, efficient, and aligned with environmental goals.
Click here to read the Detailed blog post
https://www.pk-anexcelexpert.com/waste-management-kpi-dashboard-in-power-bi/
Visit our YouTube channel to learn step-by-step video tutorials
Youtube.com/@PKAnExcelExpert
Compatibility and Requirements
- Opens in Power BI Desktop, which is free to download from Microsoft. See Get Power BI Desktop.
- You add your own waste collection, recycling, revenue and operational data.
Frequently Asked Questions
Which waste management KPIs are tracked?
Waste collected, recycling rates, tonnage per material type, diversion rates, revenue and costs, CO2 emissions reduction, energy savings, collection time and fleet utilization.
Can I track finances as well as operations?
Yes. It covers revenue from waste services, recycling programs and government incentives, plus operational expenses.
Can I create reports from it?
Yes. You can build reports on waste collection, recycling performance, environmental impact and financials.
Is there an Excel or Google Sheets version?
Yes. See the Waste Management KPI Dashboard in Excel and the Google Sheets edition.
Related Waste Management Templates
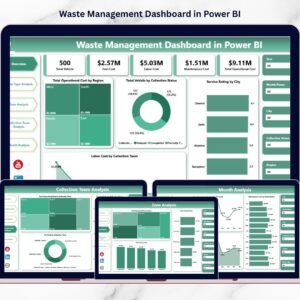
- Waste Management Dashboard in Power BI: a full waste dashboard in Power BI
- Waste Management KPI Dashboard in Excel: the same KPIs in Excel
- Waste Management KPI Dashboard in Google Sheets: a shared online version
- Waste Management KPI Scorecard in Excel: a scorecard view
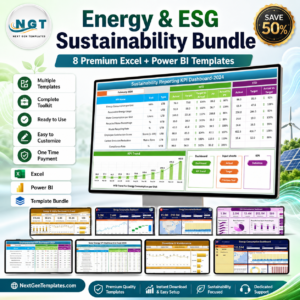
- Energy & ESG Sustainability Bundle: 8 energy and ESG templates in one download
Browse all Power BI KPI dashboards or the Excel KPI dashboards.

























Reviews
There are no reviews yet.