

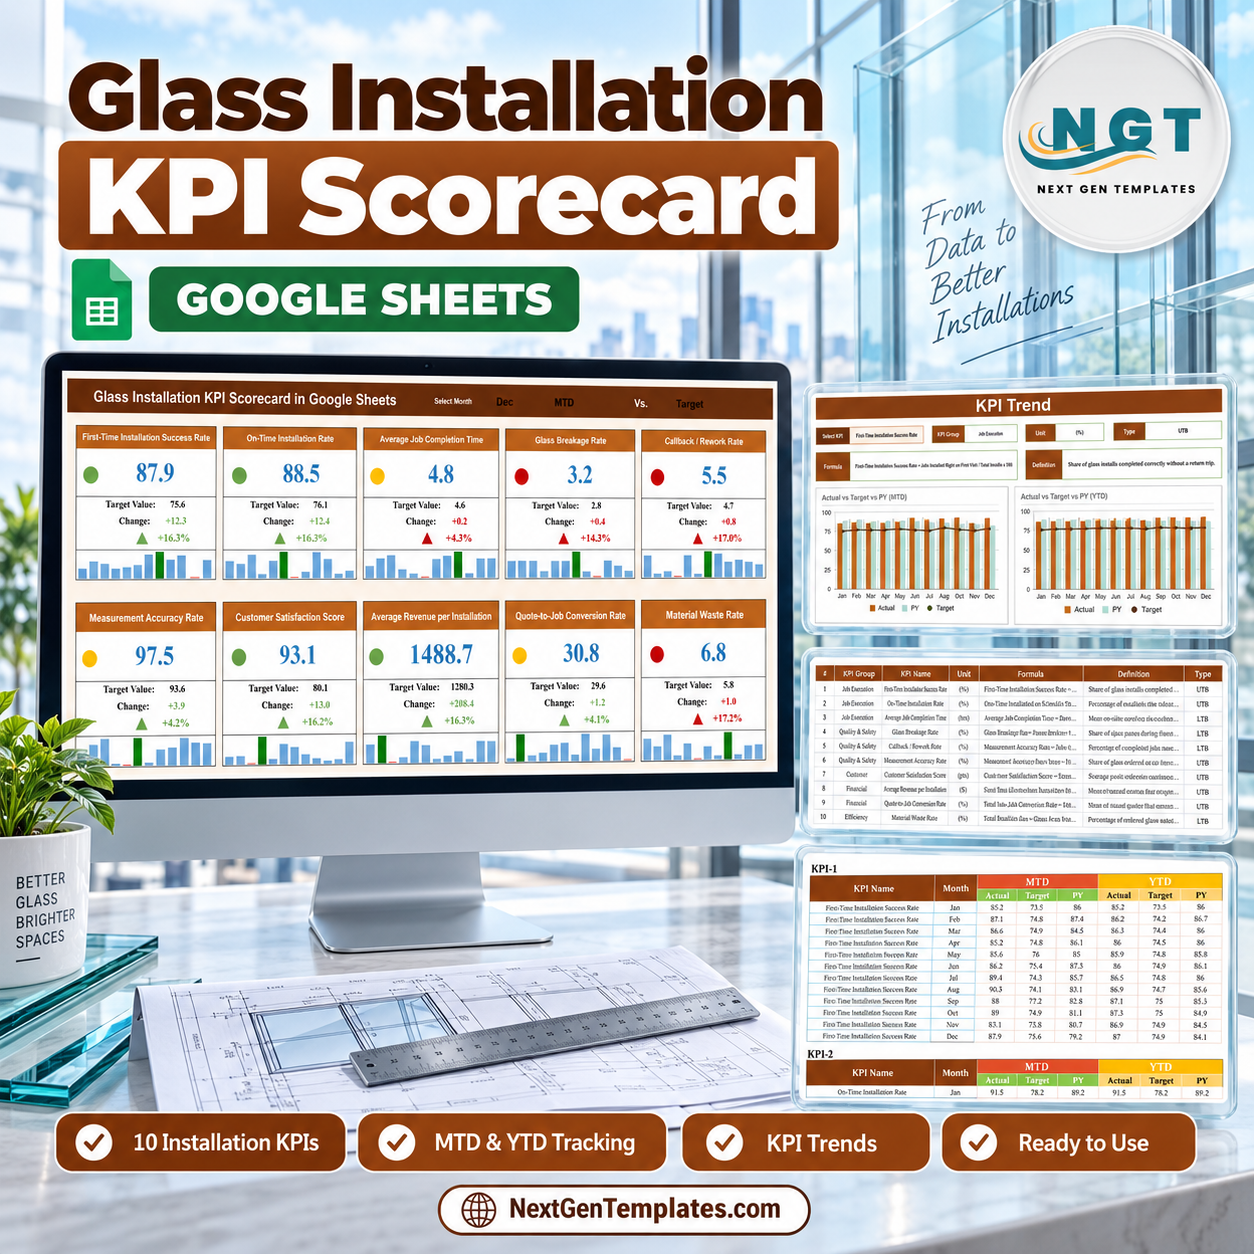

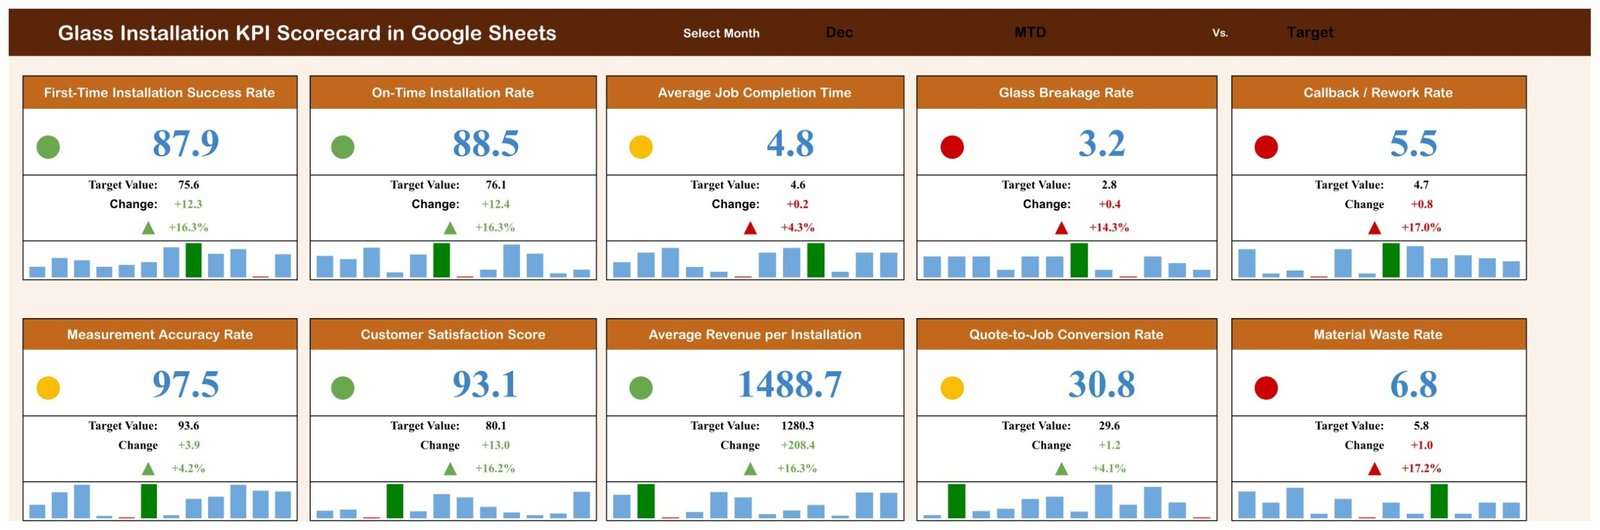
The Glass Installation KPI Scorecard in Google Sheets gives installers and glazing contractors ten monthly measures on one screen. The included December MTD sample has four green cards, three amber cards, and three red cards, so managers can see quality, timing, revenue, and waste exceptions before opening a detailed report. Choose the month, MTD or YTD basis, and Target or Prior Year comparison; the cards, change figures, directional arrows, and twelve-month mini trends follow. It is a one-time purchase with no add-on, macro, or recurring software fee. Make a private copy, replace the sample data, and keep the file in your own Google Drive.
Key Features of the Glass Installation KPI Scorecard in Google Sheets
- Ten glass-installation KPIs spanning job execution, quality and safety, customer, financial, and efficiency groups.
- Three scorecard controls for month, MTD/YTD basis, and Target/PY comparison.
- Red, amber, and green status dots to separate healthy results from watch items and exceptions.
- UTB and LTB scoring so higher success and satisfaction score positively while lower breakage, rework, time, and waste score positively.
- Change in units and percent with a directional arrow on every card.
- Twelve-month mini trend inside each KPI card for context beyond the selected month.
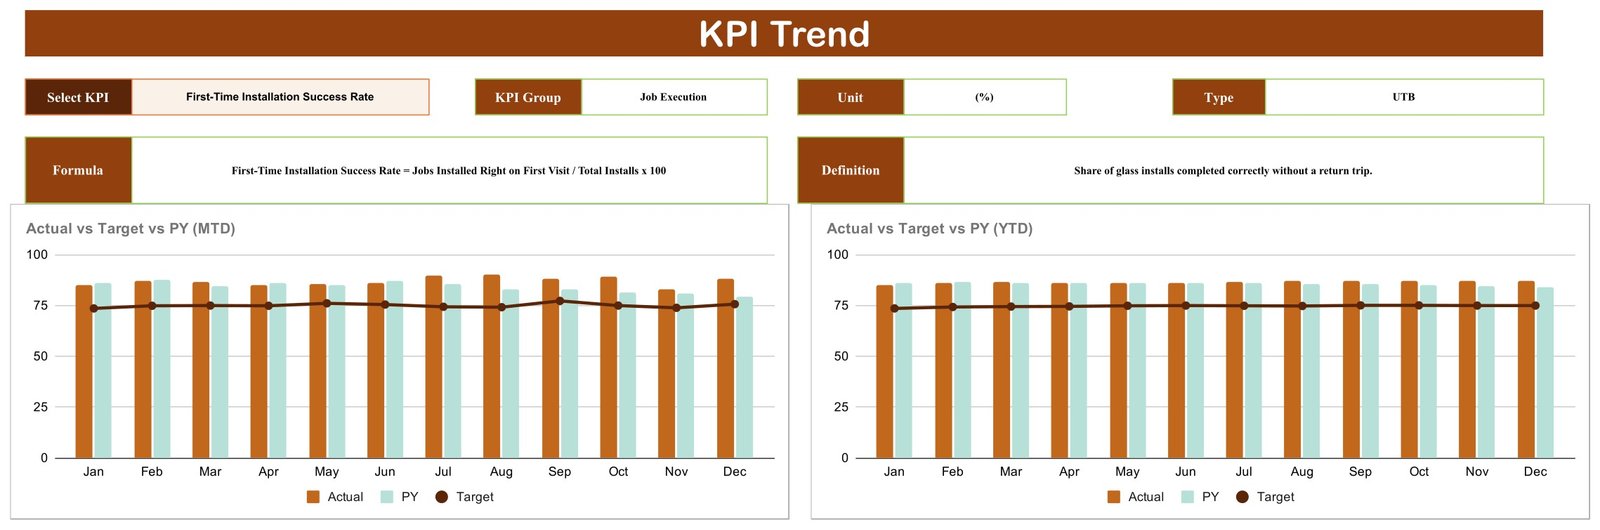
- KPI Trend page with separate MTD and YTD Actual vs Target vs PY charts.
- Editable definitions and inputs for transparent formulas and straightforward monthly maintenance.
- Google Sheets collaboration with no scripts, macros, or add-ons.
What’s Inside the Glass Installation KPI Scorecard in Google Sheets
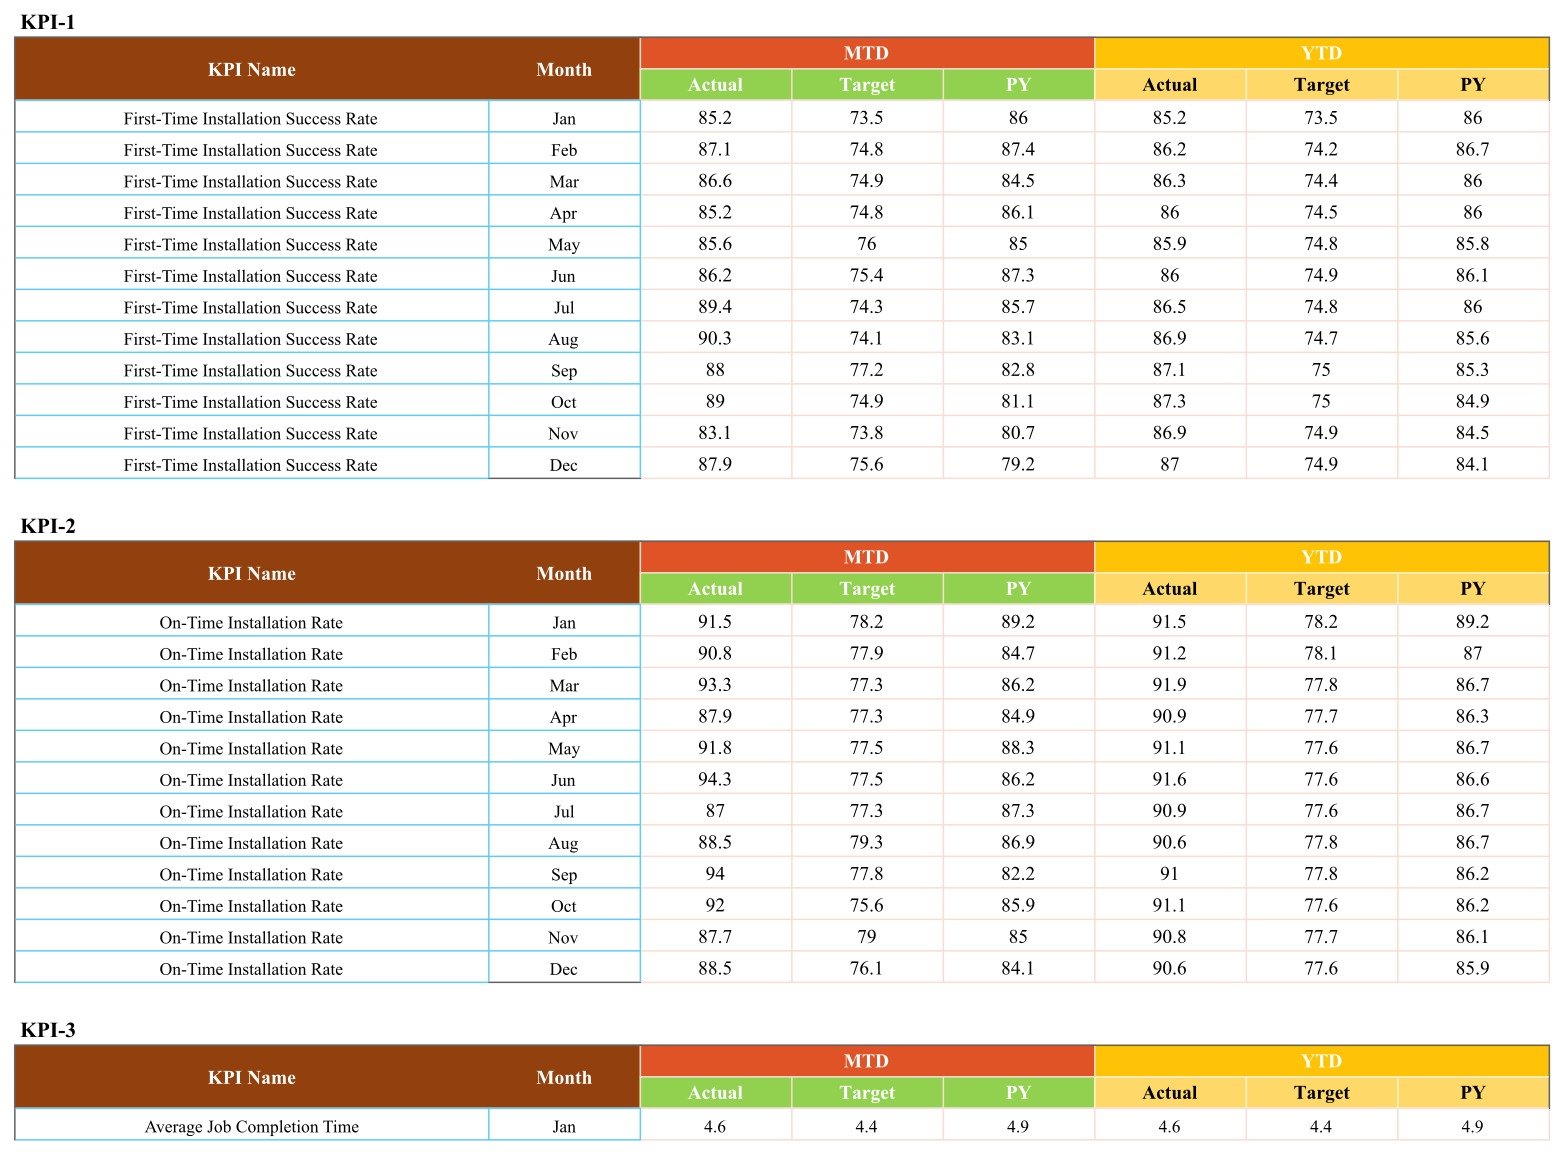
The template has four working pages. Scorecard holds ten KPI cards in two rows and the three selection controls. KPI Trend follows one selected metric and displays its group, unit, UTB/LTB type, formula, definition, and two twelve-month charts. KPI Definition is the ten-row master list. Input Data holds twelve months for each KPI with MTD Actual, Target, and PY plus YTD Actual, Target, and PY.
The supplied metrics are First-Time Installation Success Rate, On-Time Installation Rate, Average Job Completion Time, Glass Breakage Rate, Callback / Rework Rate, Measurement Accuracy Rate, Customer Satisfaction Score, Average Revenue per Installation, Quote-to-Job Conversion Rate, and Material Waste Rate.

Glass Installation KPI Scorecard in Google Sheets vs. Excel vs. Paid Field-Service SaaS – Where This Fits
| Decision point | This Google Sheets scorecard | Excel alternative | Paid field-service SaaS |
|---|---|---|---|
| Cost | One-time 13.99, 8.99 on sale | Template plus any Excel license | Recurring plan, often per user |
| Platform | Google Sheets in a browser | Excel desktop | Vendor web/mobile app |
| Setup | Copy and replace monthly values | Download and edit locally | Configuration and migration |
| Collaboration | Native link sharing | Depends on cloud co-authoring | Account-based access |
| Custom metrics | Editable definitions and inputs | Editable workbook | Limited by vendor plan |
| Scheduling, quoting, invoicing | No | No | Often yes |
| Best fit | Monthly KPI review | Offline reporting | Live job operations |
Who This Template Is For – and Who It’s Not For
It fits glazing contractors, storefront and curtain-wall installers, residential glass businesses, project managers, quality leads, estimators, and owners who summarize performance monthly. It is particularly useful when job and accounting systems already hold the detail but leadership needs one shared scorecard.
It is not estimating, scheduling, dispatch, CRM, safety-management, inspection, or accounting software. It does not store project drawings, dimensions, customer records, glass specifications, incidents, certificates, or regulatory documents. Keep operational and safety records in the systems required for your work.
How to Use the Glass Installation KPI Scorecard in Google Sheets
- Open the downloaded PDF and use its link to make your own editable Google Sheets copy.
- Review KPI Definition and adjust names, formulas, units, and UTB/LTB directions to match your process.
- Replace the sample values in each Input Data block for all twelve months.
- Select the month, MTD or YTD, and Target or PY at the top of Scorecard.
- Open KPI Trend for the metric that needs discussion.
- Share the private copy with appropriate Google Sheets permissions using Google’s sharing guidance.
Real-World Use Cases
Installation manager review
Neha sees strong first-time success and on-time results but a red breakage card, then checks whether the issue persists across recent months.
Quality meeting
David reviews measurement accuracy beside breakage and rework, preventing one good metric from hiding avoidable field returns.
Owner and estimator review
Sofia compares average revenue per installation, quote-to-job conversion, and material waste without treating the scorecard as the underlying accounting system.
Frequently Asked Questions
Do I need paid Google Workspace?
No. A standard Google account can make and edit a copy.
Can I change the ten KPIs?
Yes. Edit the master list and related input labels while preserving the expected row structure.
What are UTB and LTB?
Upper the Better and Lower the Better tell the scorecard which direction represents improved performance.
Does it import data automatically?
No. This edition uses manual monthly summary entry.
Can my team collaborate?
Yes. Use normal Google Sheets view, comment, and edit permissions.
What do I receive?
A PDF containing the link used to create your own editable Google Sheets copy.
About the Author
Built by PK – Microsoft Certified Professional with 15+ years of Excel, Google Sheets, and Power BI experience. Founder of NextGenTemplates, reaching 300K+ subscribers across YouTube channels. Every template is hand-built and tested before release.
Explore Related Templates
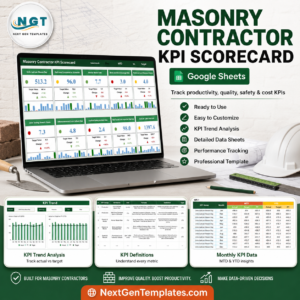
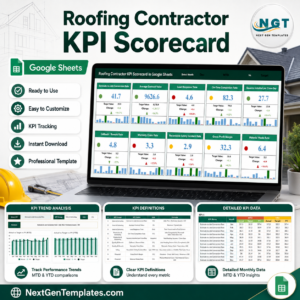
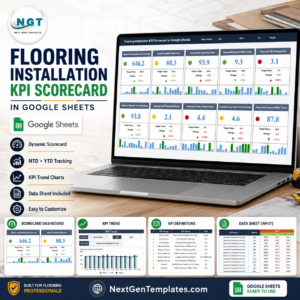
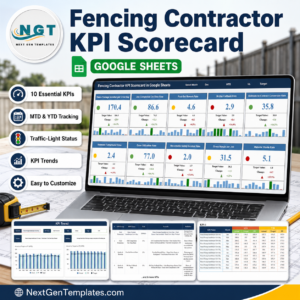
Compare the Flooring Installation KPI Scorecard, Fencing Contractor KPI Scorecard, Masonry Contractor KPI Scorecard, and Roofing Contractor KPI Scorecard. Browse the Google Sheets KPI collection and all Google Sheets templates.
Ready to make installation performance easier to review? Download the Glass Installation KPI Scorecard in Google Sheets, create your private copy, and replace the sample data with your monthly results.
Watch the step-by-step video Demo:
Last updated: September 2026.
Compatibility and Requirements
- Works in Google Sheets. You need a free Google account and a web browser.
- The scorecard has no scripts, macros or add-ons. You make your own copy from the link in the PDF. Google explains how to start in Get started with Google Sheets.
Related Glass Installation Templates
- Glass Installation KPI Scorecard in Excel: the same scorecard for Excel
- Glass Installation KPI Dashboard in Google Sheets: a dashboard view of the same topic
- Glass Installation KPI Dashboard in Excel: the dashboard edition for Excel
- Glass Installation KPI Dashboard in Power BI: the Power BI edition
- Window and Door Installation KPI Scorecard in Google Sheets: a related installation scorecard
Browse all Google Sheets KPI dashboards.


























Reviews
There are no reviews yet.