

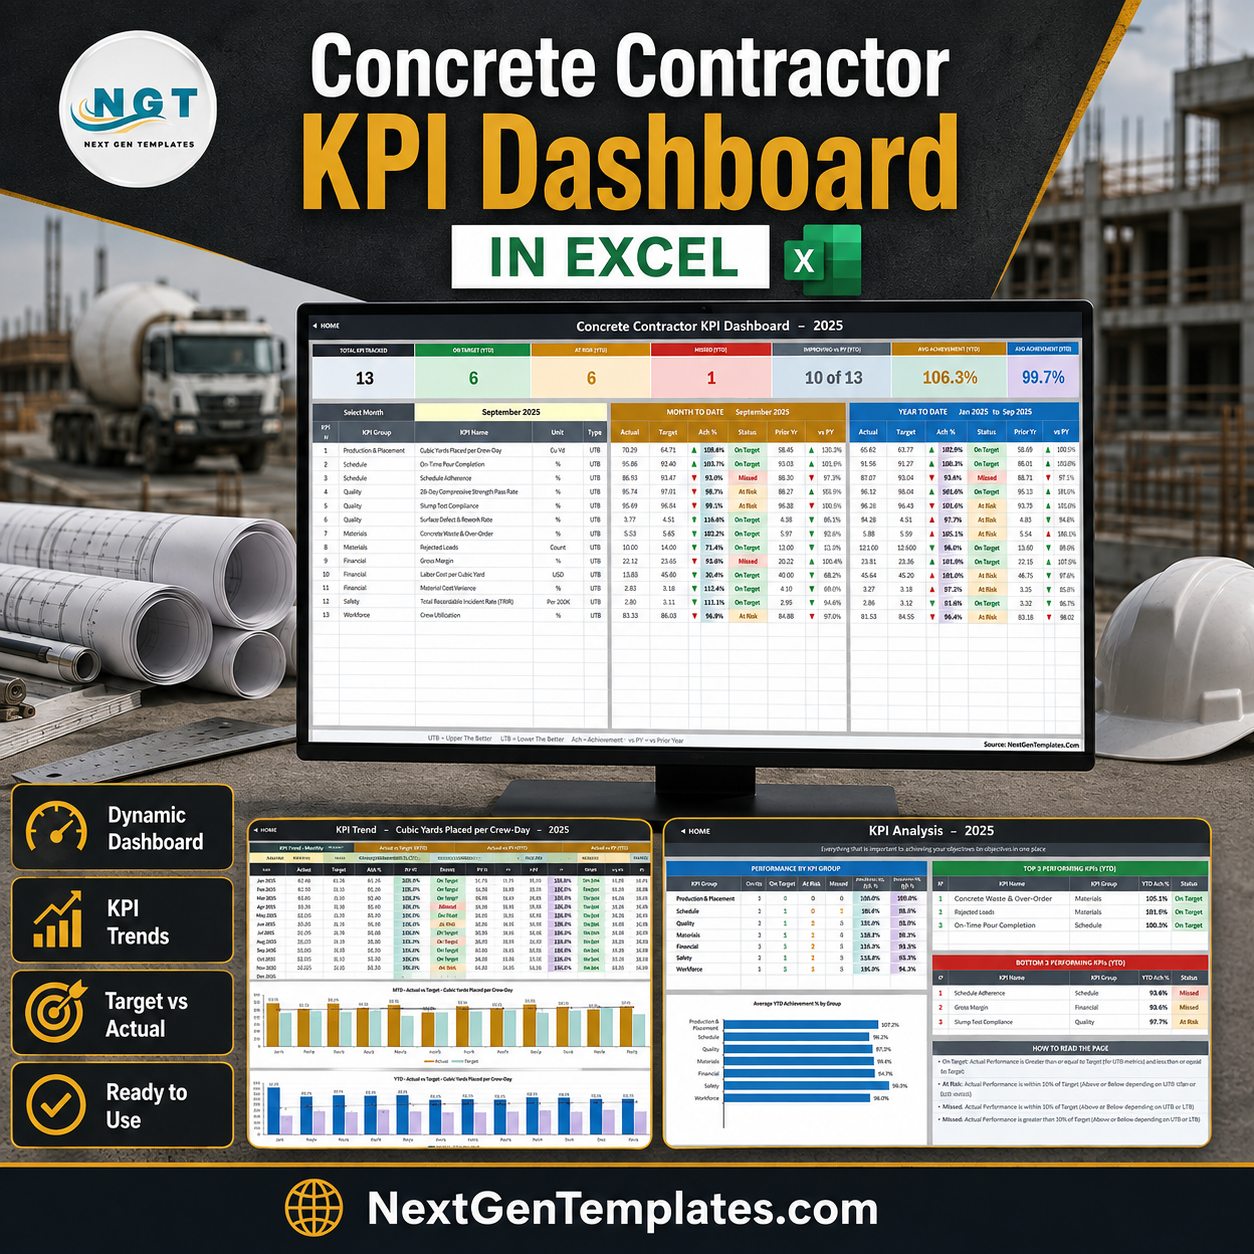

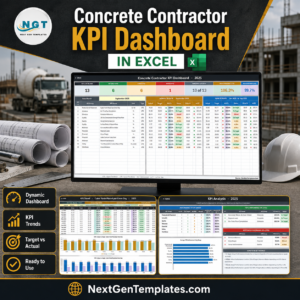
The Concrete Contractor KPI Dashboard in Excel tracks 13 concrete-specific KPIs across 7 KPI groups, on 11 worksheets, with a month picker that redraws month-to-date and year-to-date results side by side. Every number is a plain worksheet formula — there is no Power Query, no data model, no macro and no add-in, so setup is replacing sample numbers on three input sheets.
🌍 Join 8,400+ teams in 40+ countries using NextGenTemplates to replace paid SaaS reporting with one-time-purchase Excel, Google Sheets and Power BI templates.
✅ Instant download · One-time payment · No subscription · No per-user fees · Lifetime access
This is the KPI Dashboard line — a month-picker scorecard with traffic lights, a per-KPI trend page and a group roll-up page. It is a different template from the Concrete Contractor KPI Scorecard in Excel (a lighter ten-KPI scorecard) and from the analytical Construction Dashboard in Excel (slicer-driven charts over a record-level data table). All three are listed separately and none replaces the other.
🔑 Key Features of the Concrete Contractor KPI Dashboard in Excel
📊 13 KPIs, 7 groups, one scorecard. The dashboard tracks Cubic Yards Placed per Crew-Day, On-Time Pour Completion, Schedule Adherence, 28-Day Compressive Strength Pass Rate, Slump Test Compliance, Surface Defect & Rework Rate, Concrete Waste & Over-Order, Rejected Loads, Gross Margin, Labor Cost per Cubic Yard, Material Cost Variance, Total Recordable Incident Rate (TRIR) and Crew Utilization — grouped as Production & Placement, Schedule, Quality, Materials, Financial, Safety and Workforce.
🔄 Direction-aware scoring. Each KPI is flagged UTB (upper the better) or LTB (lower the better) in one column. Achievement is Actual ÷ Target for a UTB KPI and Target ÷ Actual for an LTB KPI, so beating a waste, cost, rework or incident-rate target scores above 100% instead of reading as a miss. Seven KPIs here are UTB and six are LTB.
🔴 Traffic lights with editable thresholds. Status is On Target from 100%, At Risk from 95% to 99% and Missed below 95%. The thresholds live in the visible formulas in columns L and U of the KPI Dashboard sheet, so you can move them to match your own governance.
📅 One dropdown drives everything. Pick a month in cell D6 and the seven summary cards, all 13 KPI rows in both the MTD and YTD blocks, and the whole KPI Analysis page recalculate. There is no refresh step and no query to run.
⚙️ Add or rename KPIs without touching a formula. The sheets are wired for 22 KPI rows. Type a new KPI on the KPI Definition sheet — number, group, name, unit, formula, definition, type, owner, priority, frequency — and it flows straight through to the three input sheets, the scorecard, the trend page and the analysis page.
📦 What’s Inside the Concrete Contractor KPI Dashboard in Excel
Eleven worksheets: Home, KPI Dashboard, KPI Trend, KPI Analysis, three input sheets (Actual, Target, Prior Year), KPI Definition, a hidden Support sheet holding the helper calculations, Read Me, and Get More Templates.
Page 1: Home
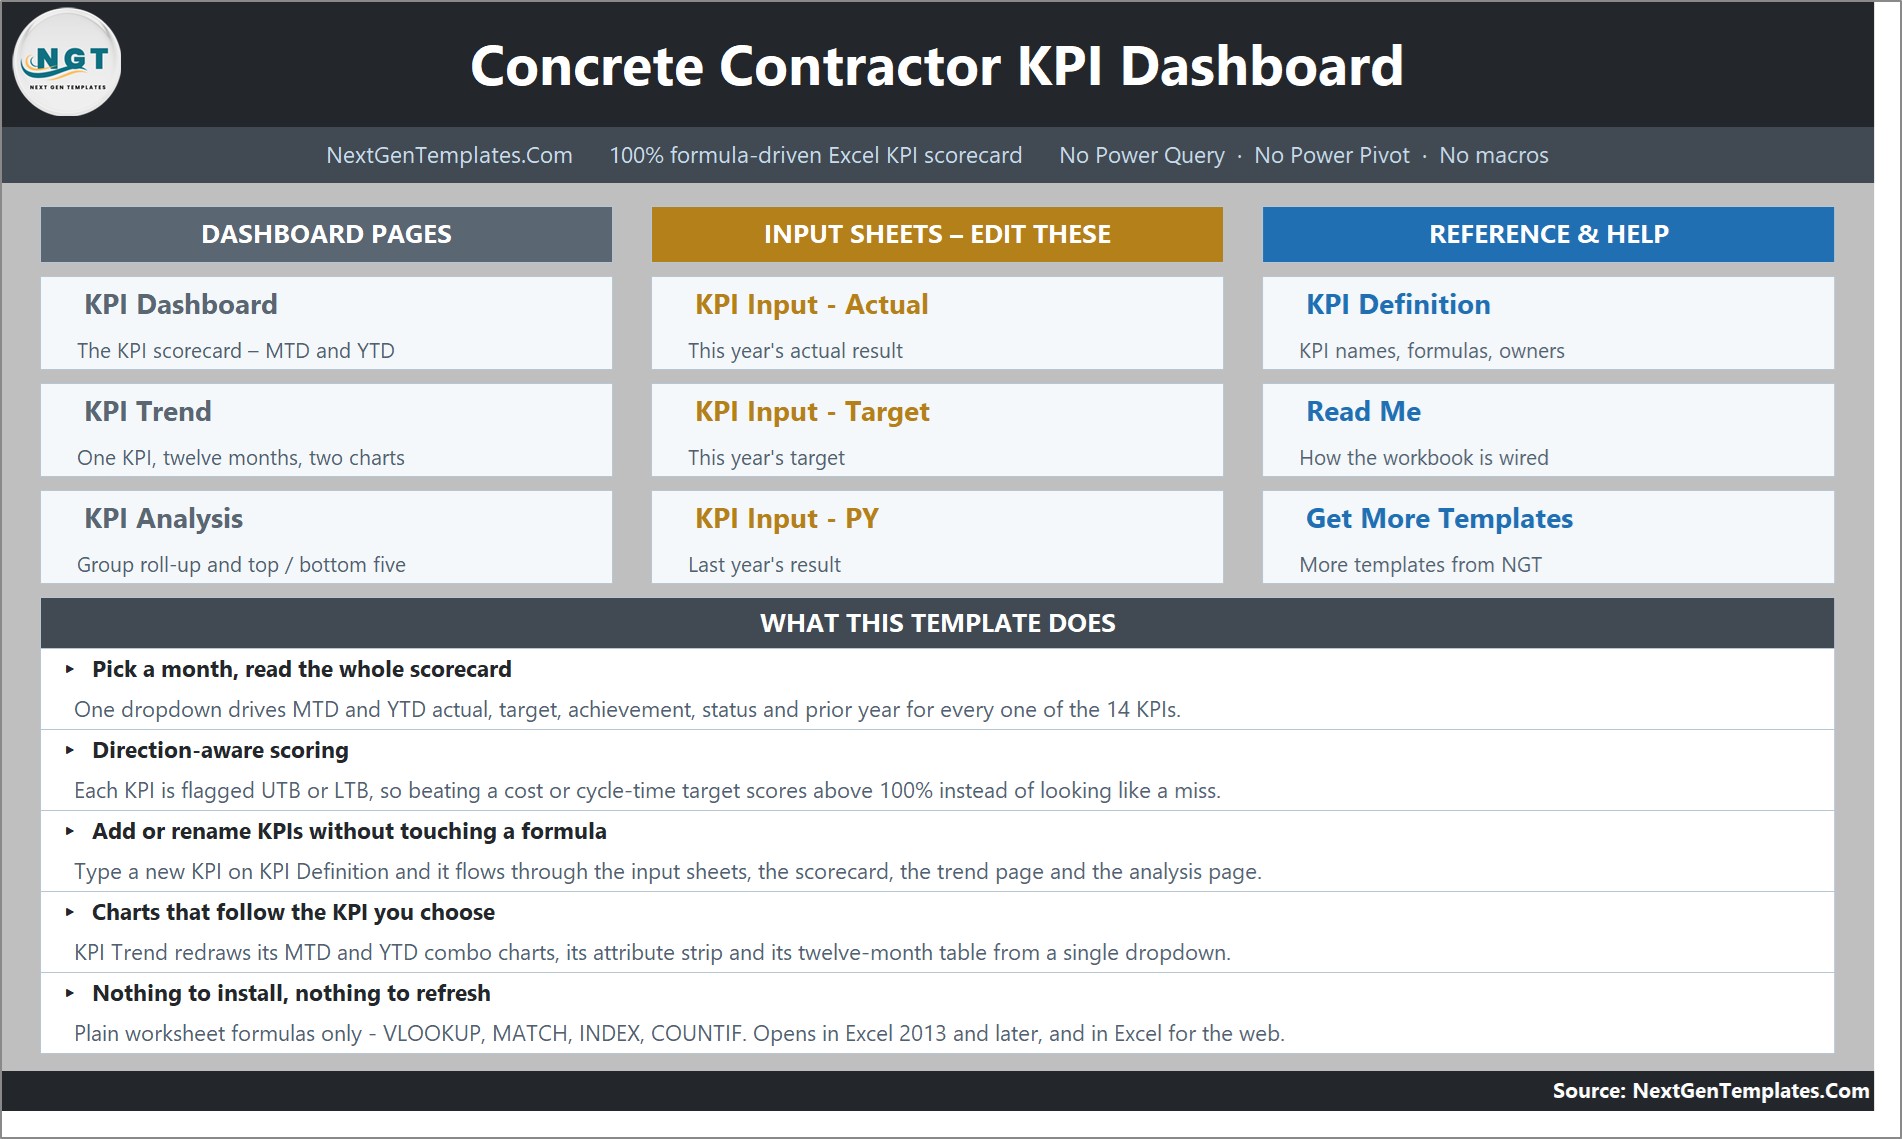
A navigation hub with three tiled columns — Dashboard Pages, Input Sheets and Reference & Help — plus a “What This Template Does” panel covering the month picker, direction-aware scoring, adding KPIs, the linked charts and the no-install promise.
Page 2: KPI Dashboard
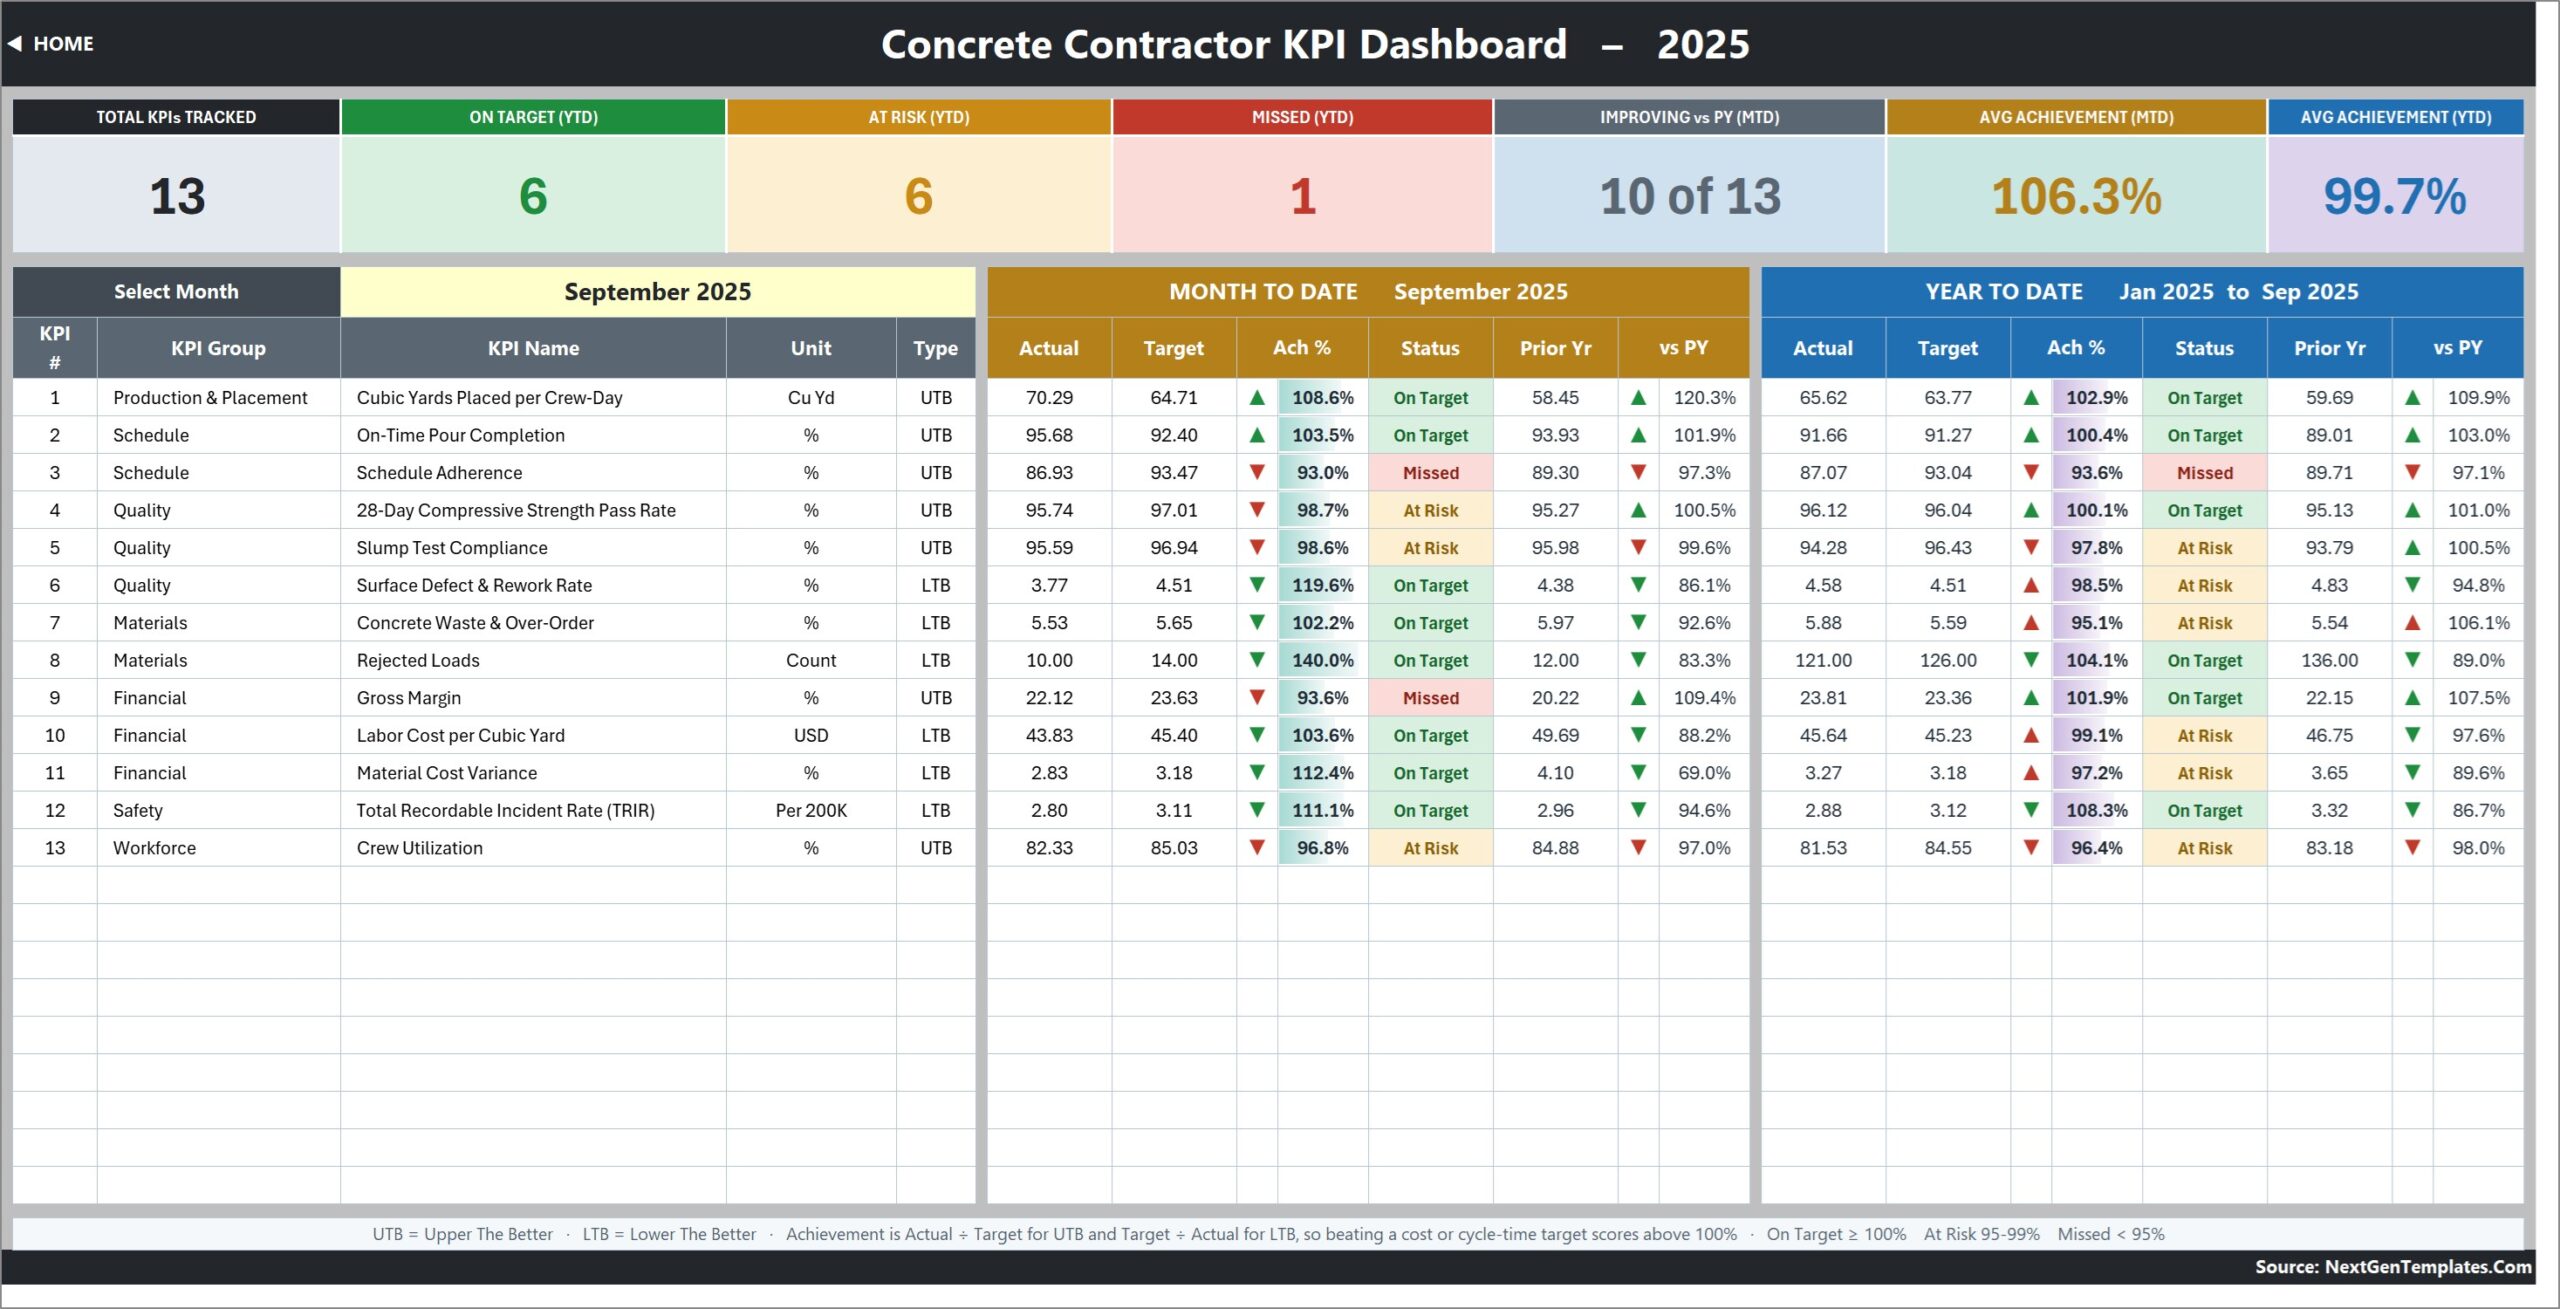
The scorecard. Seven summary cards read Total KPIs Tracked, On Target (YTD), At Risk (YTD), Missed (YTD), Improving vs PY (MTD), Avg Achievement (MTD) and Avg Achievement (YTD). Below them, one row per KPI carries group, name, unit, type, and then Actual, Target, Ach %, Status, Prior Yr and vs PY twice over — once for month to date and once for year to date. In the September 2025 sample the cards read 13 KPIs, 6 On Target, 6 At Risk, 1 Missed, 10 of 13 improving, 106.3% average MTD achievement and 99.7% YTD.
Page 3: KPI Trend
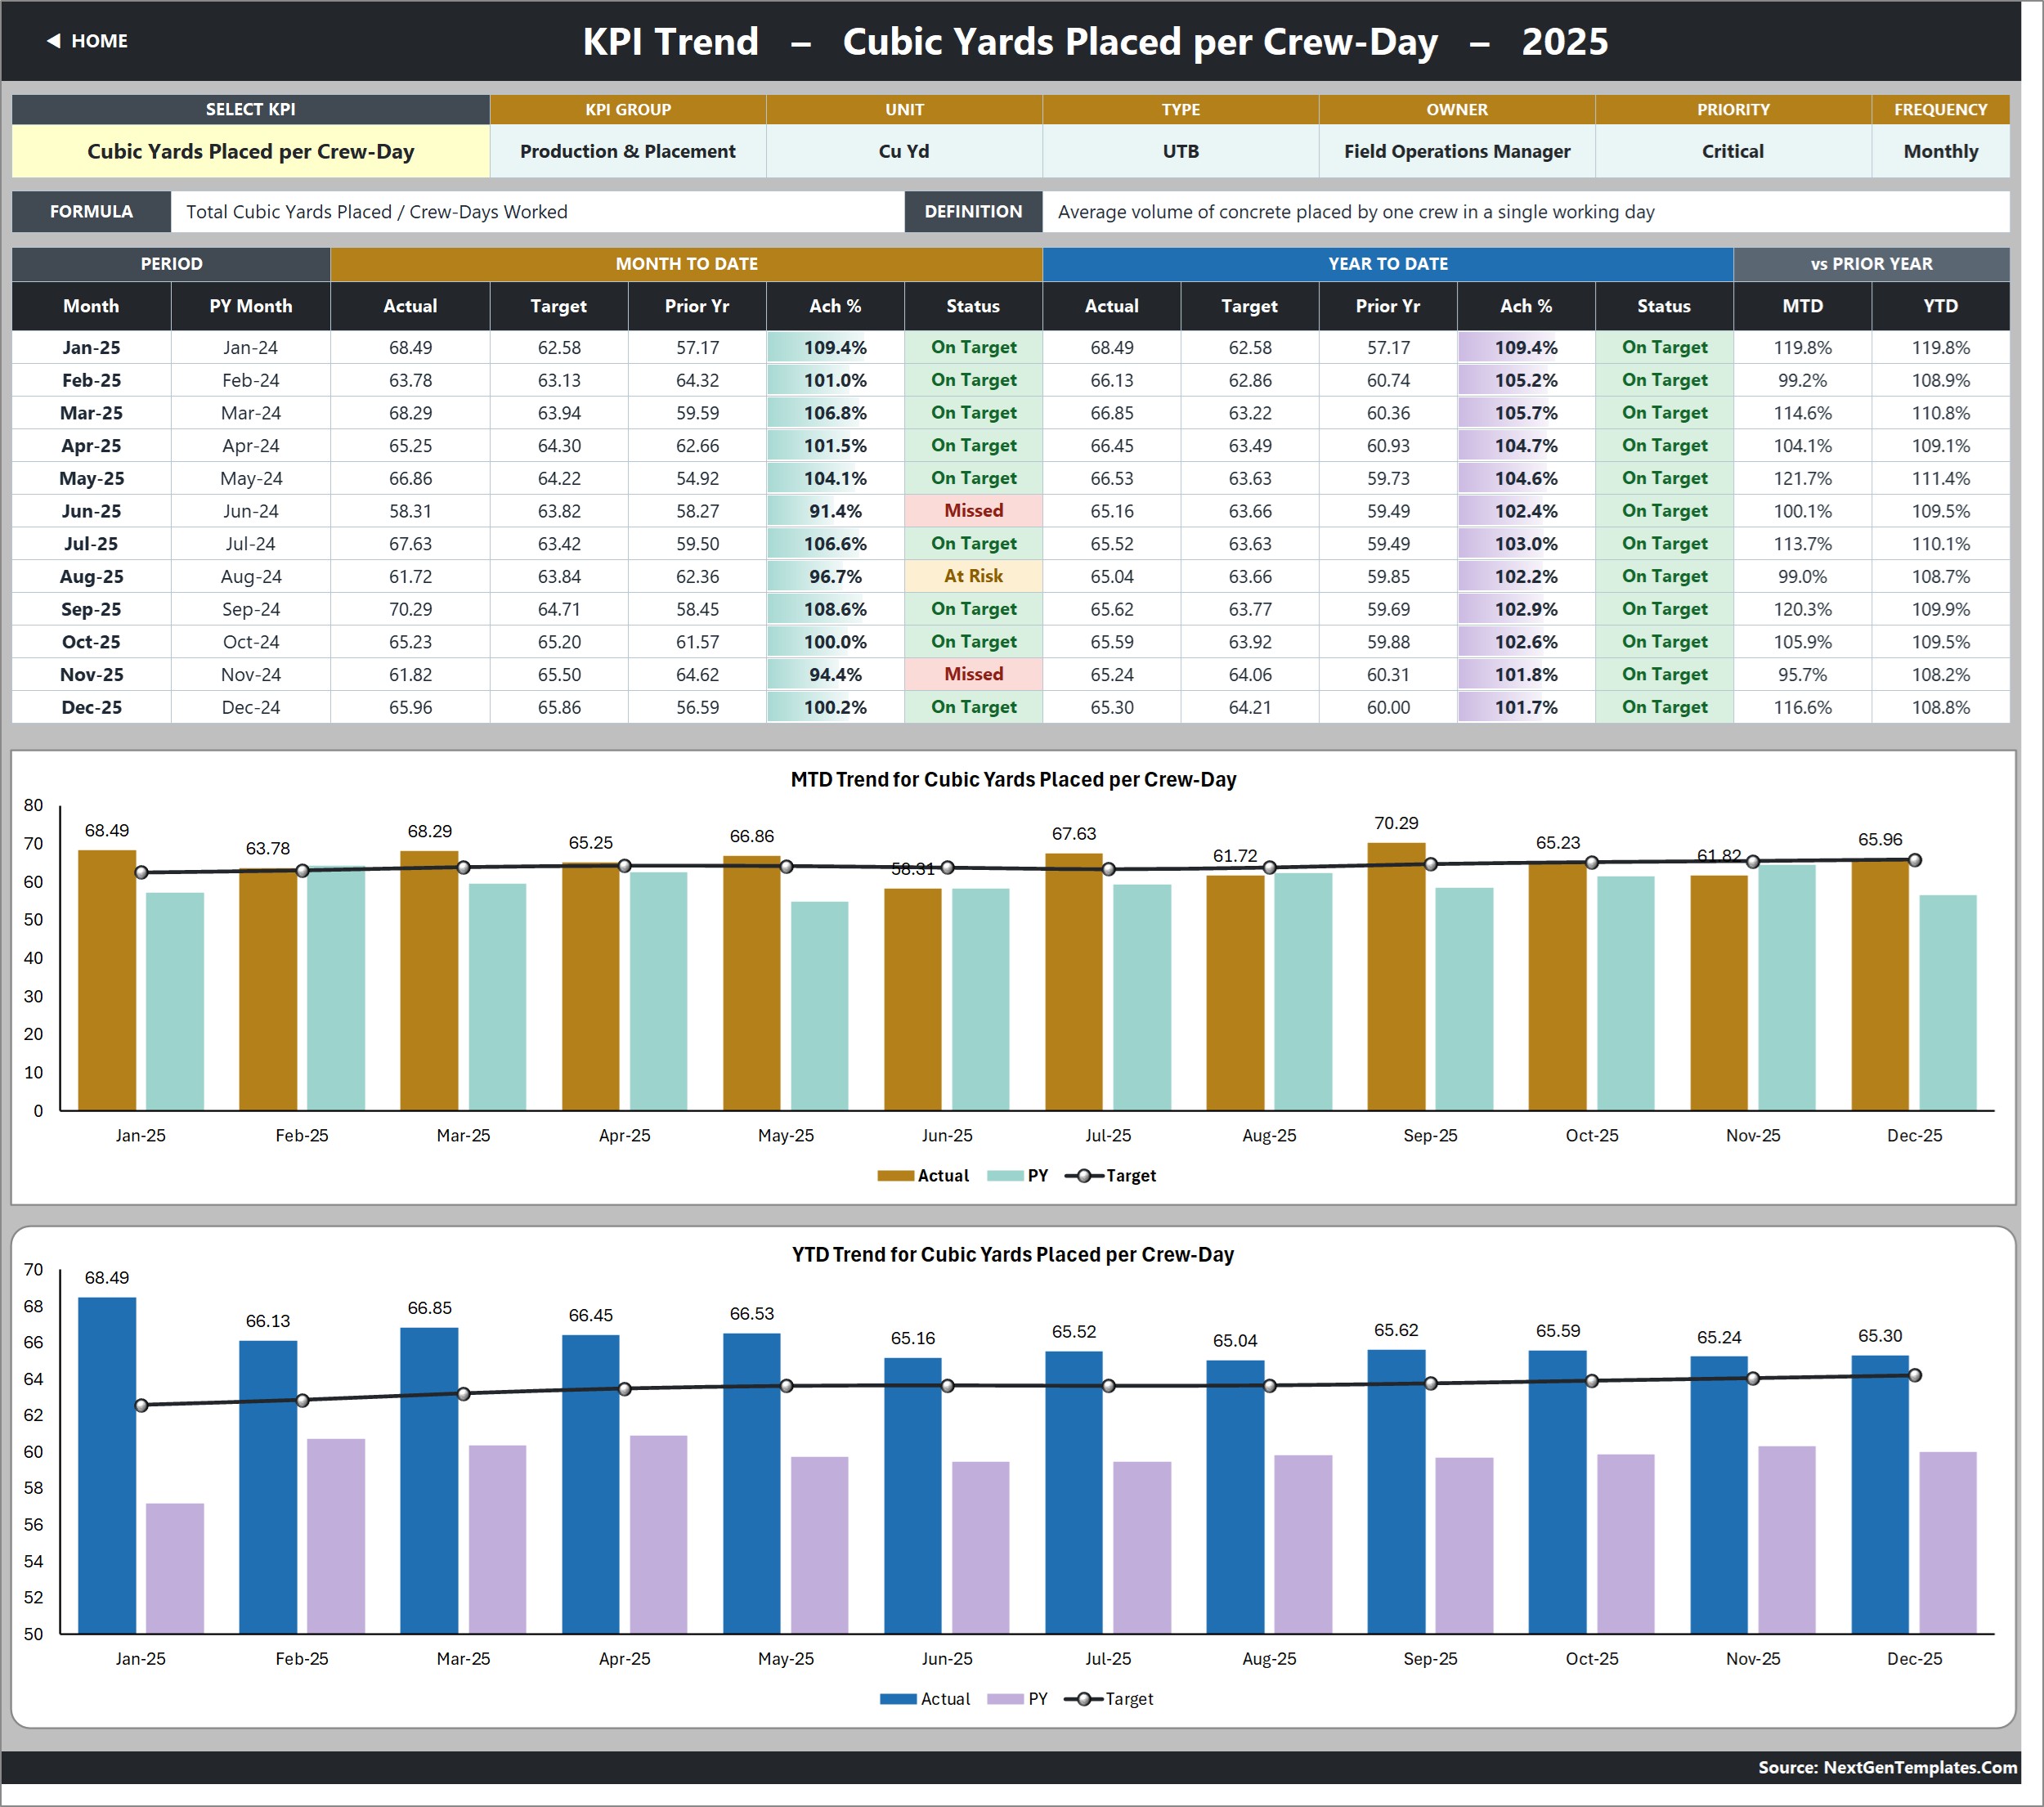
One KPI at a time. A dropdown in cell B4 picks the KPI; the attribute strip (group, unit, type, owner, priority, frequency), the formula and definition bar, a twelve-month table of MTD and YTD actual, target, prior year, achievement and status, and two combo charts all follow it. The charts are MTD Trend and YTD Trend — actual and prior-year columns with a target line.
Page 4: KPI Analysis
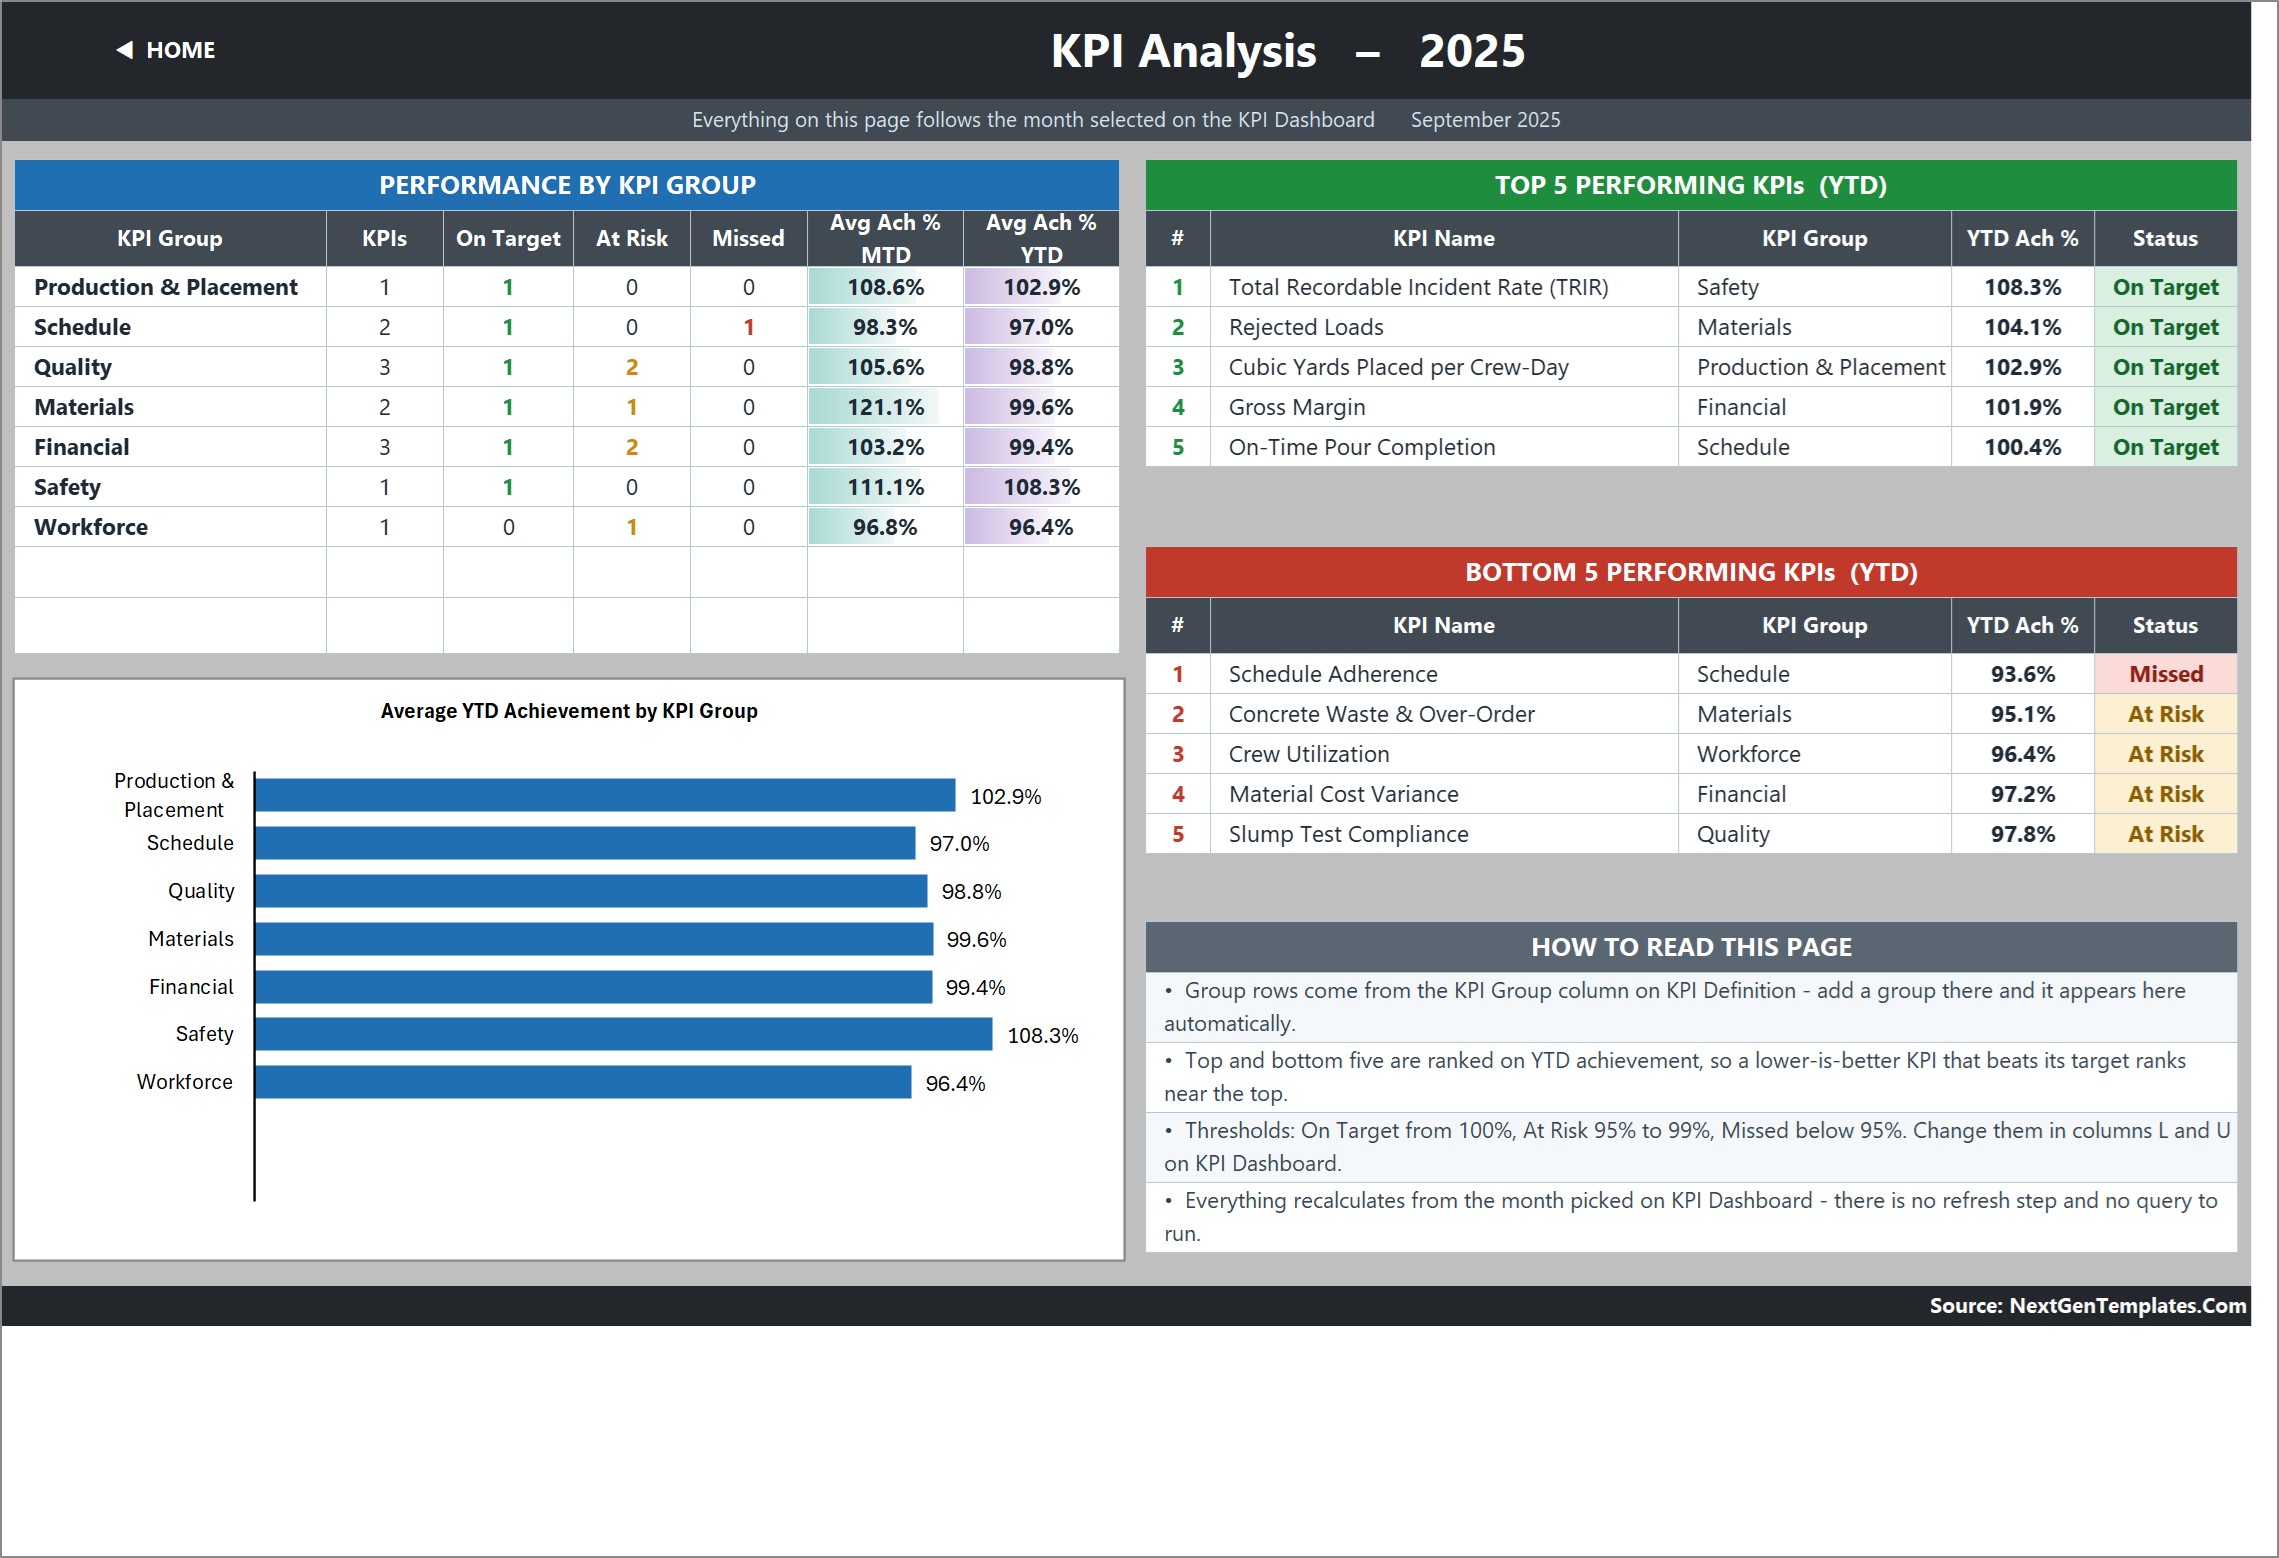
Achievement rolled up by KPI group, with KPI count and On Target / At Risk / Missed counts per group, average MTD and YTD achievement, and an Average YTD Achievement by KPI Group bar chart. Alongside it sit Top 5 Performing KPIs (YTD) and Bottom 5 Performing KPIs (YTD), ranked on achievement so a lower-is-better KPI that beats its target ranks near the top.
Pages 5-7: KPI Input — Actual, Target and Prior Year
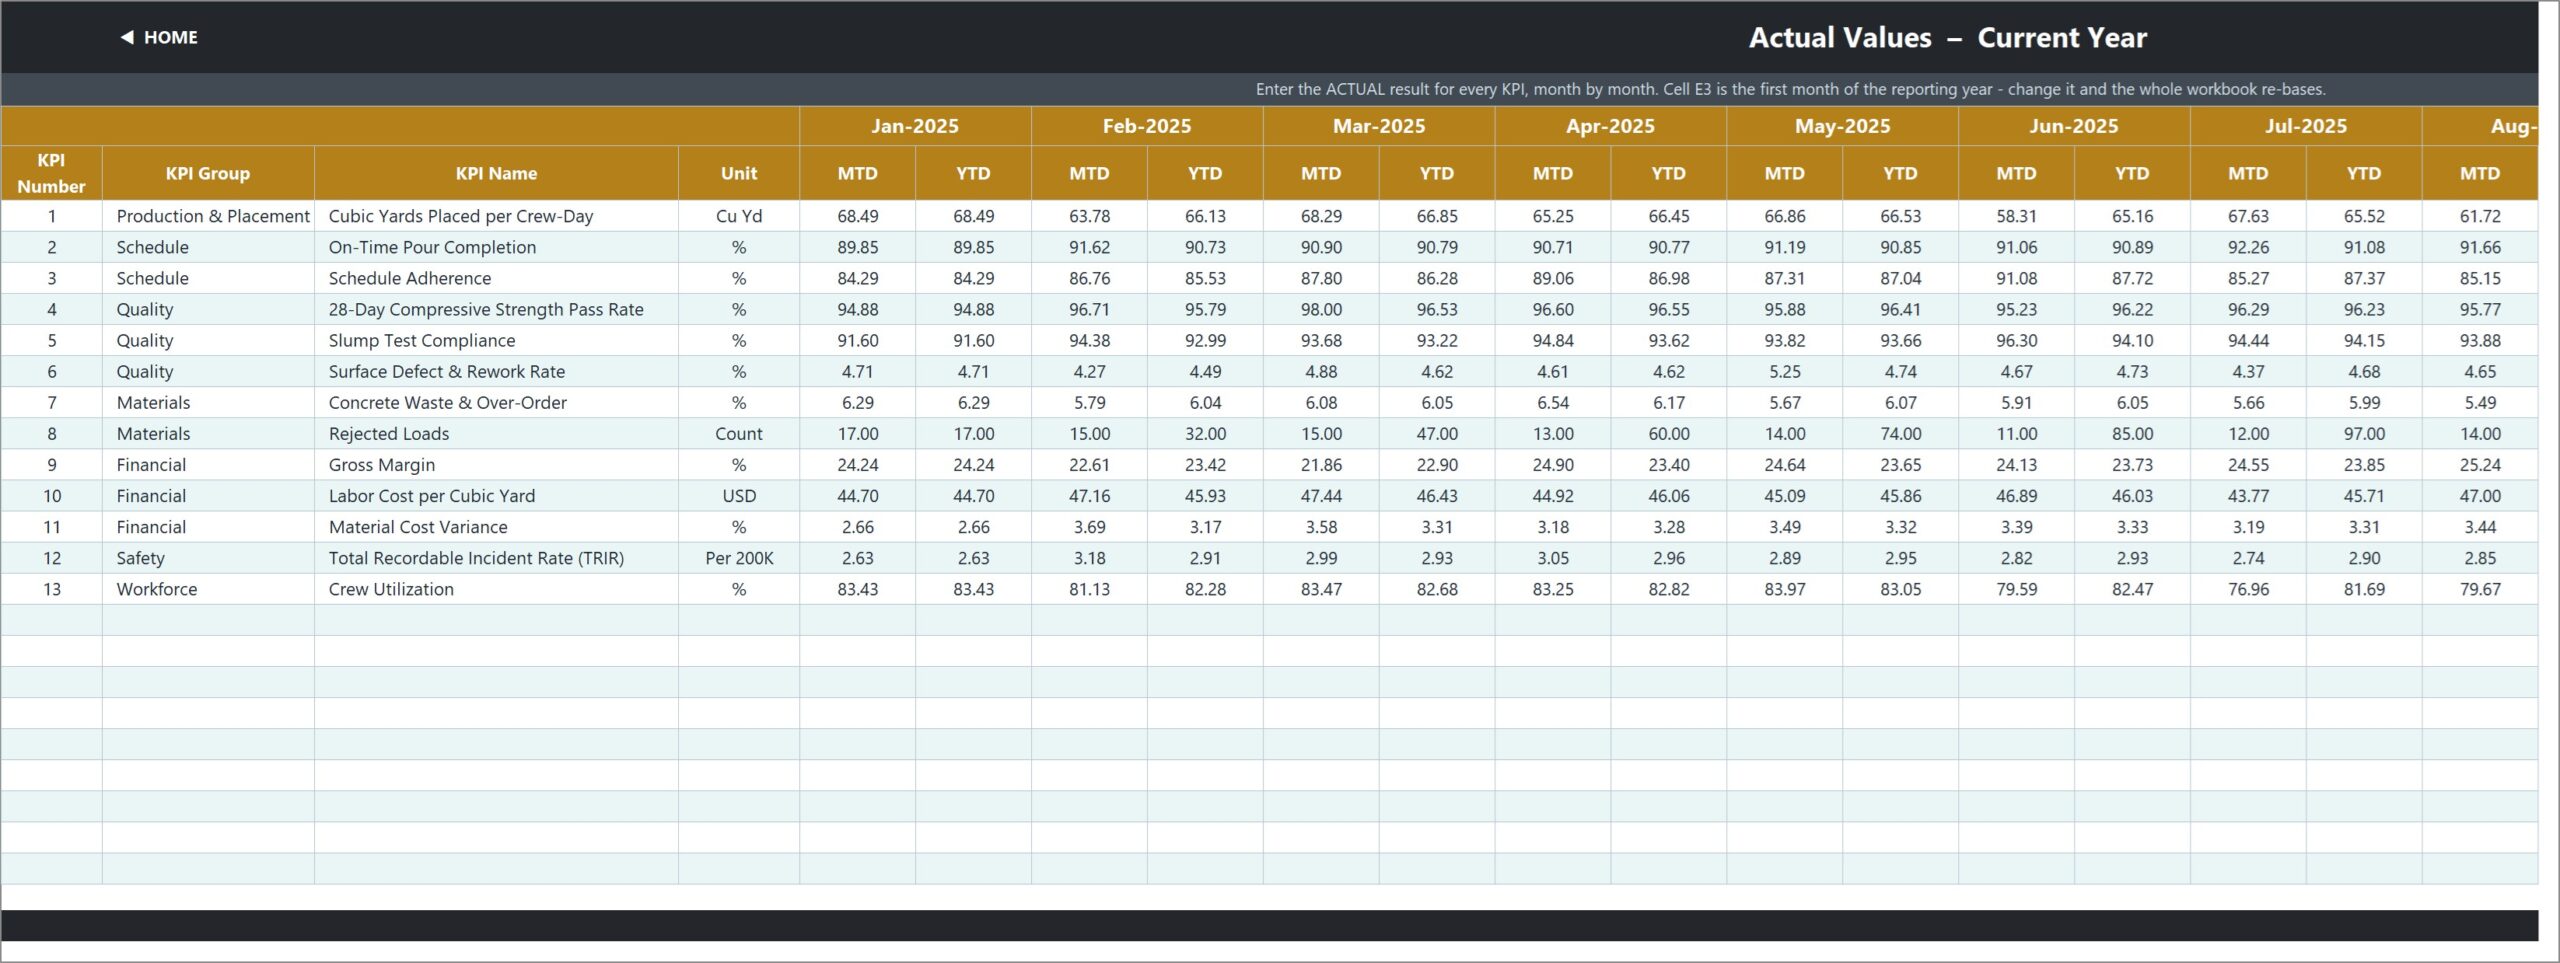
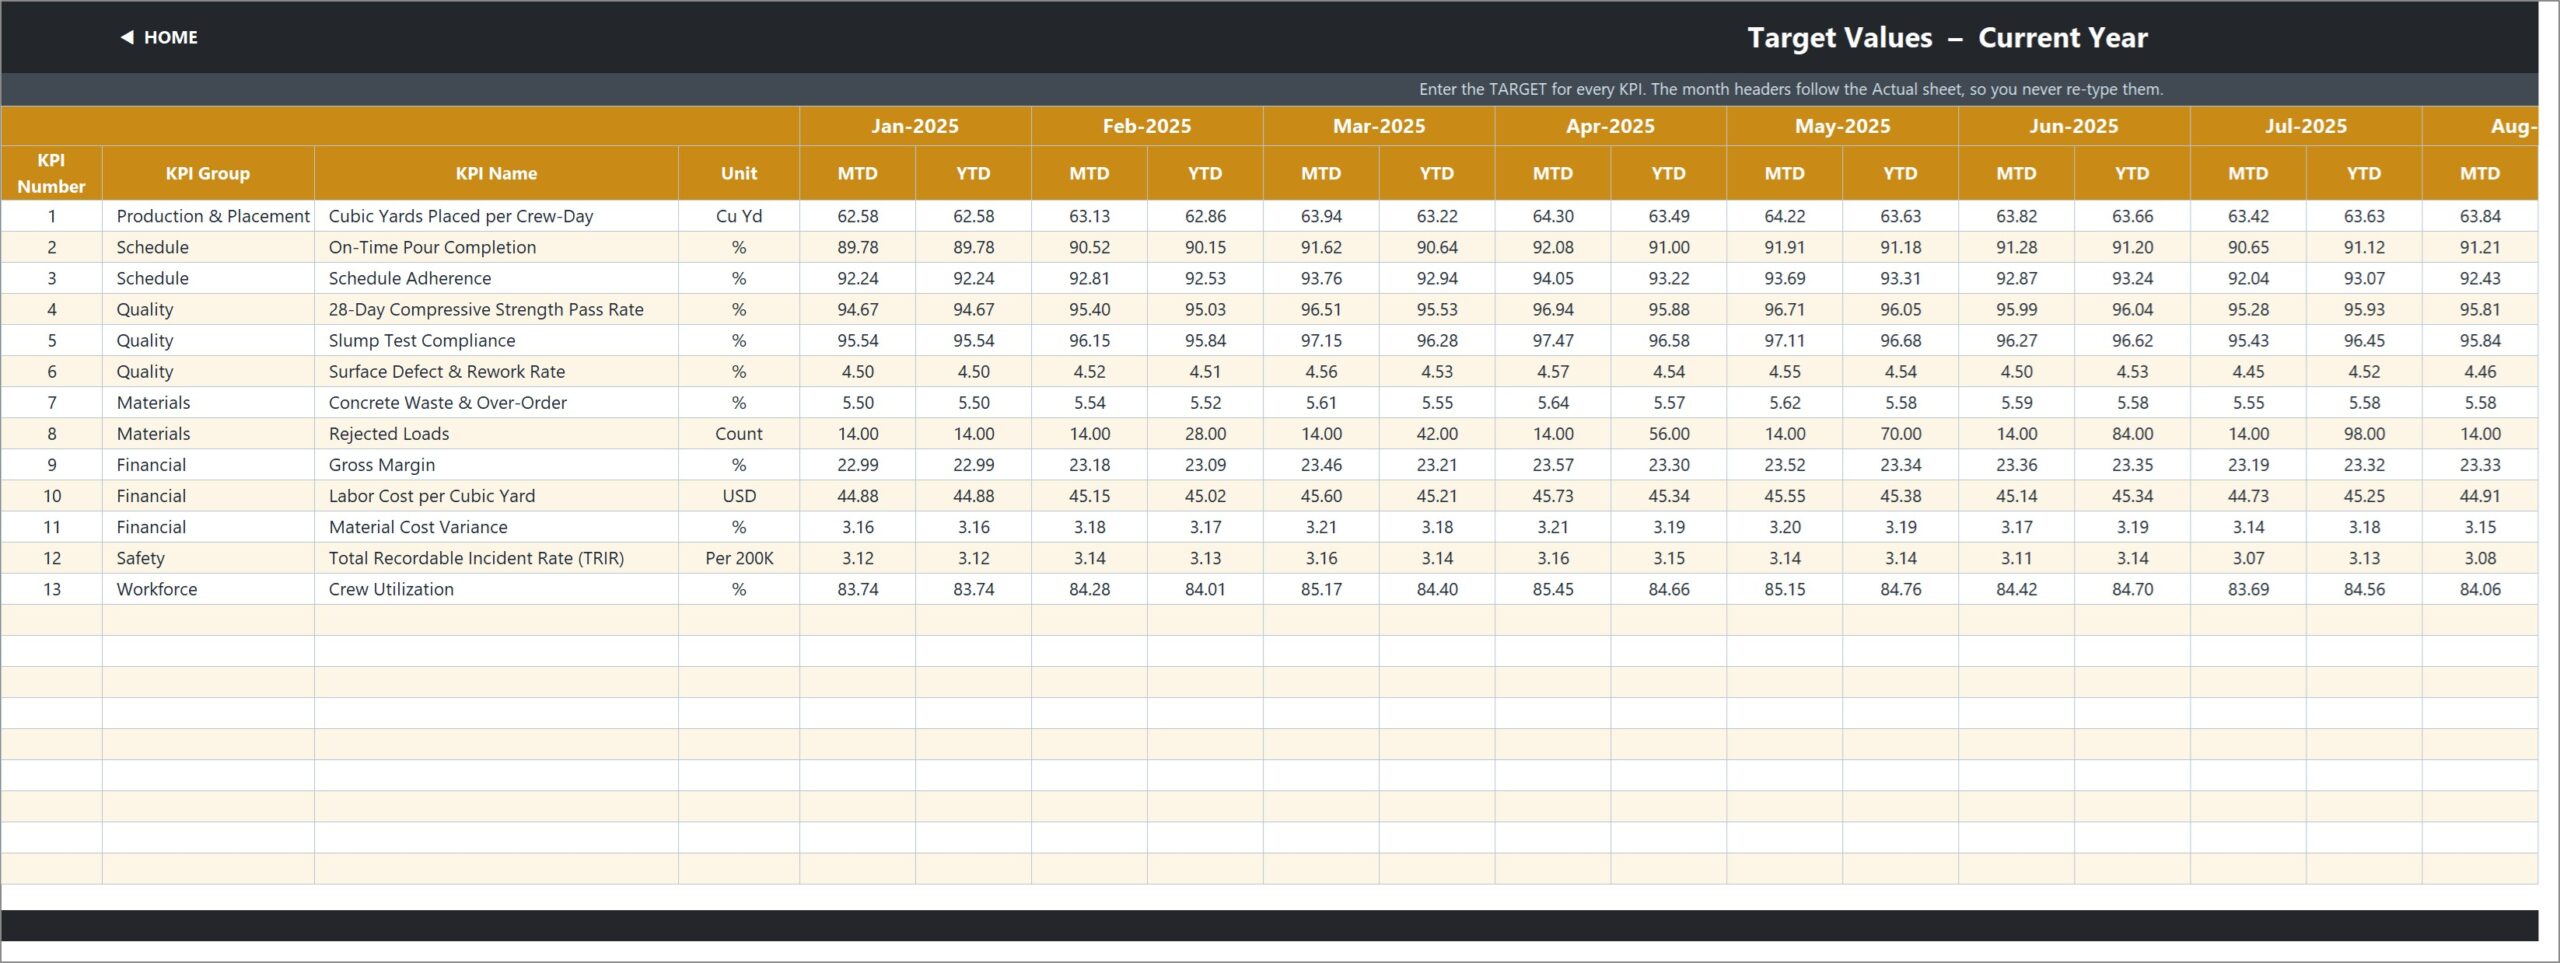
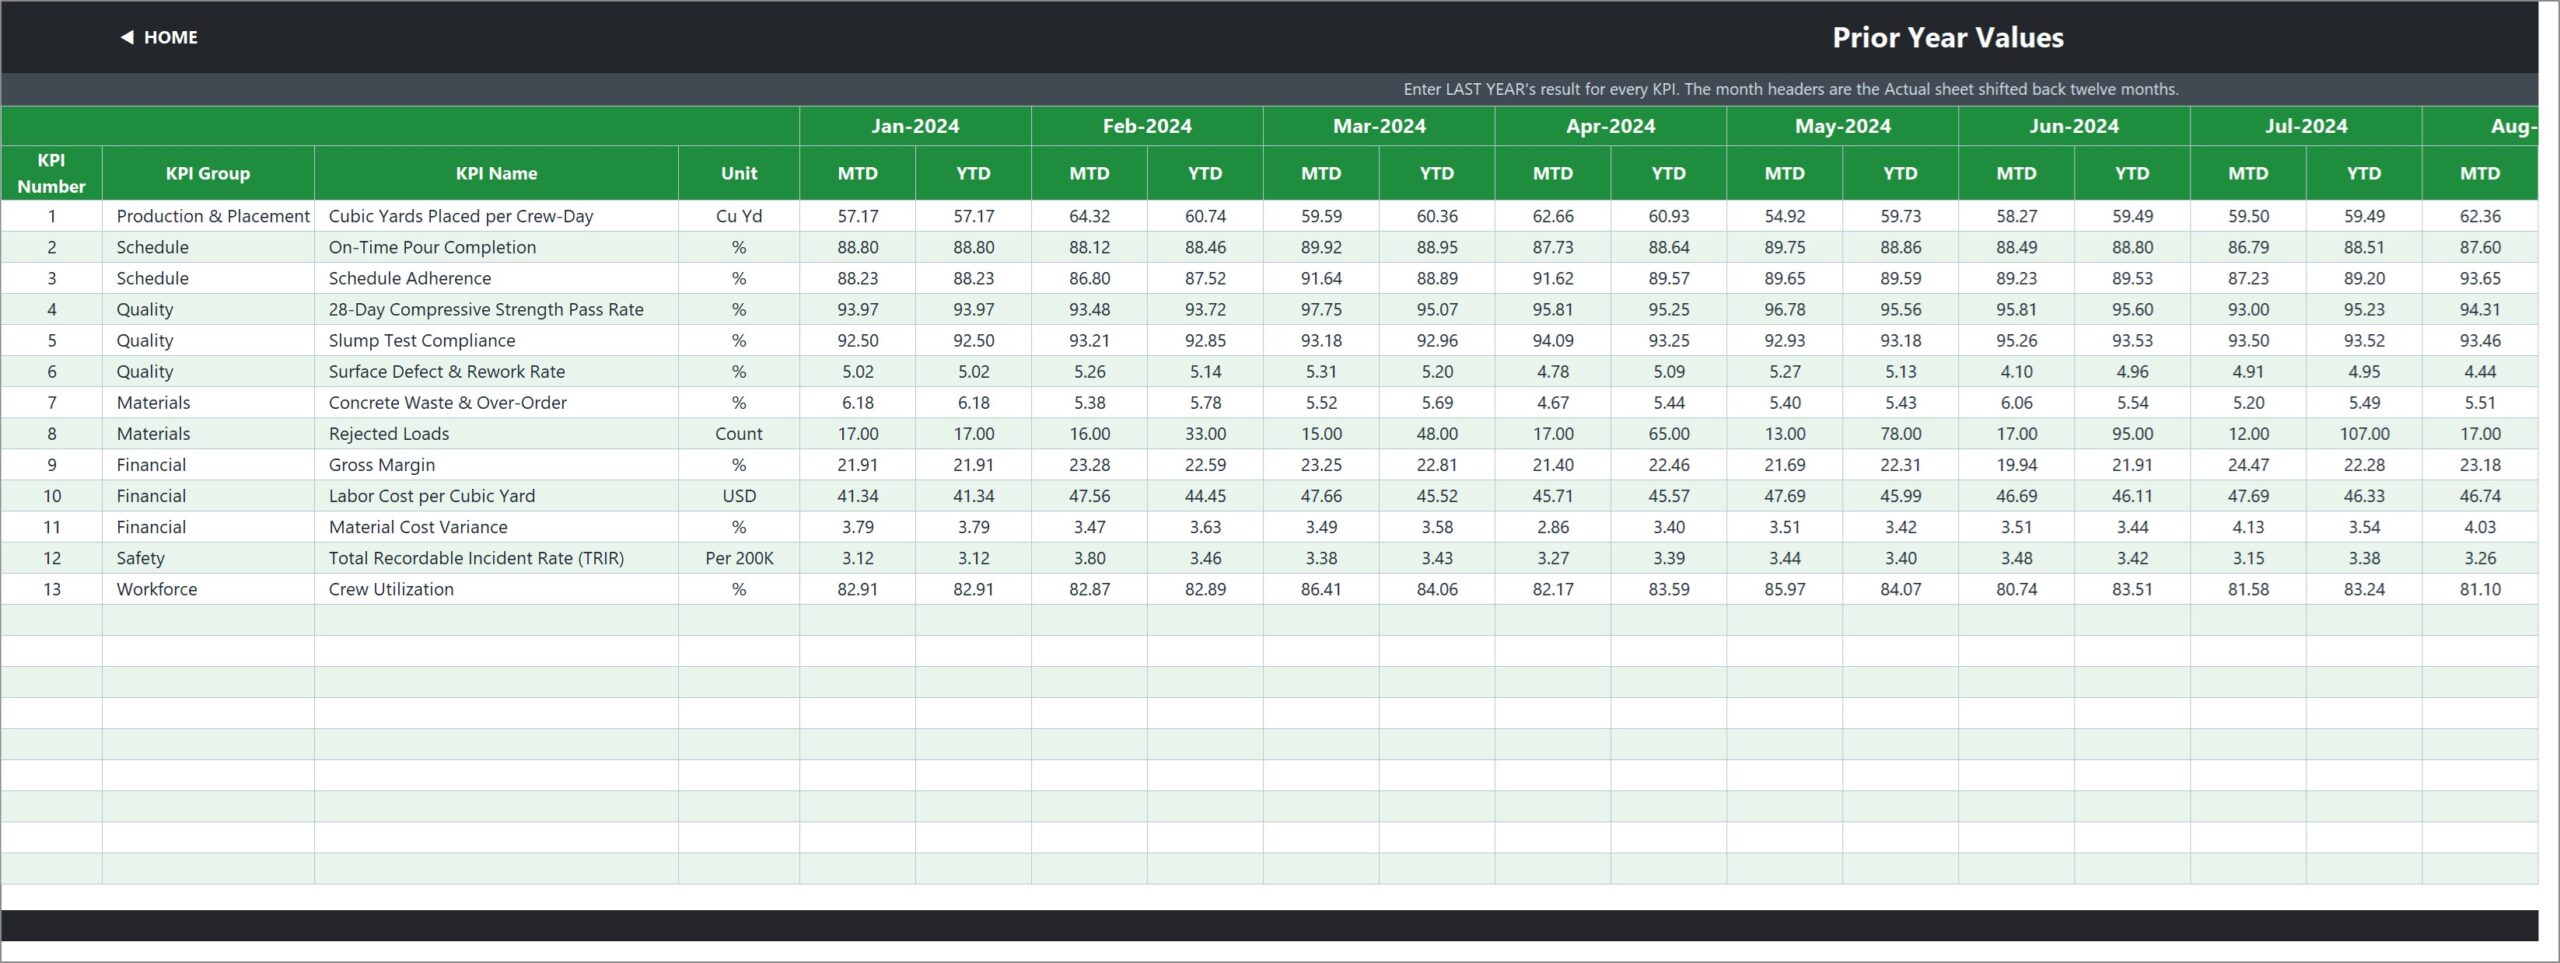
The three sheets you type in. Each holds an MTD and a YTD column for all twelve months, with the KPI rows driven by KPI Definition so the three sheets always line up. Cell E3 on the Actual sheet is the first month of the reporting year — change it and the Target sheet, the Prior Year sheet, the month dropdown and every sheet title re-base.
Page 8: KPI Definition
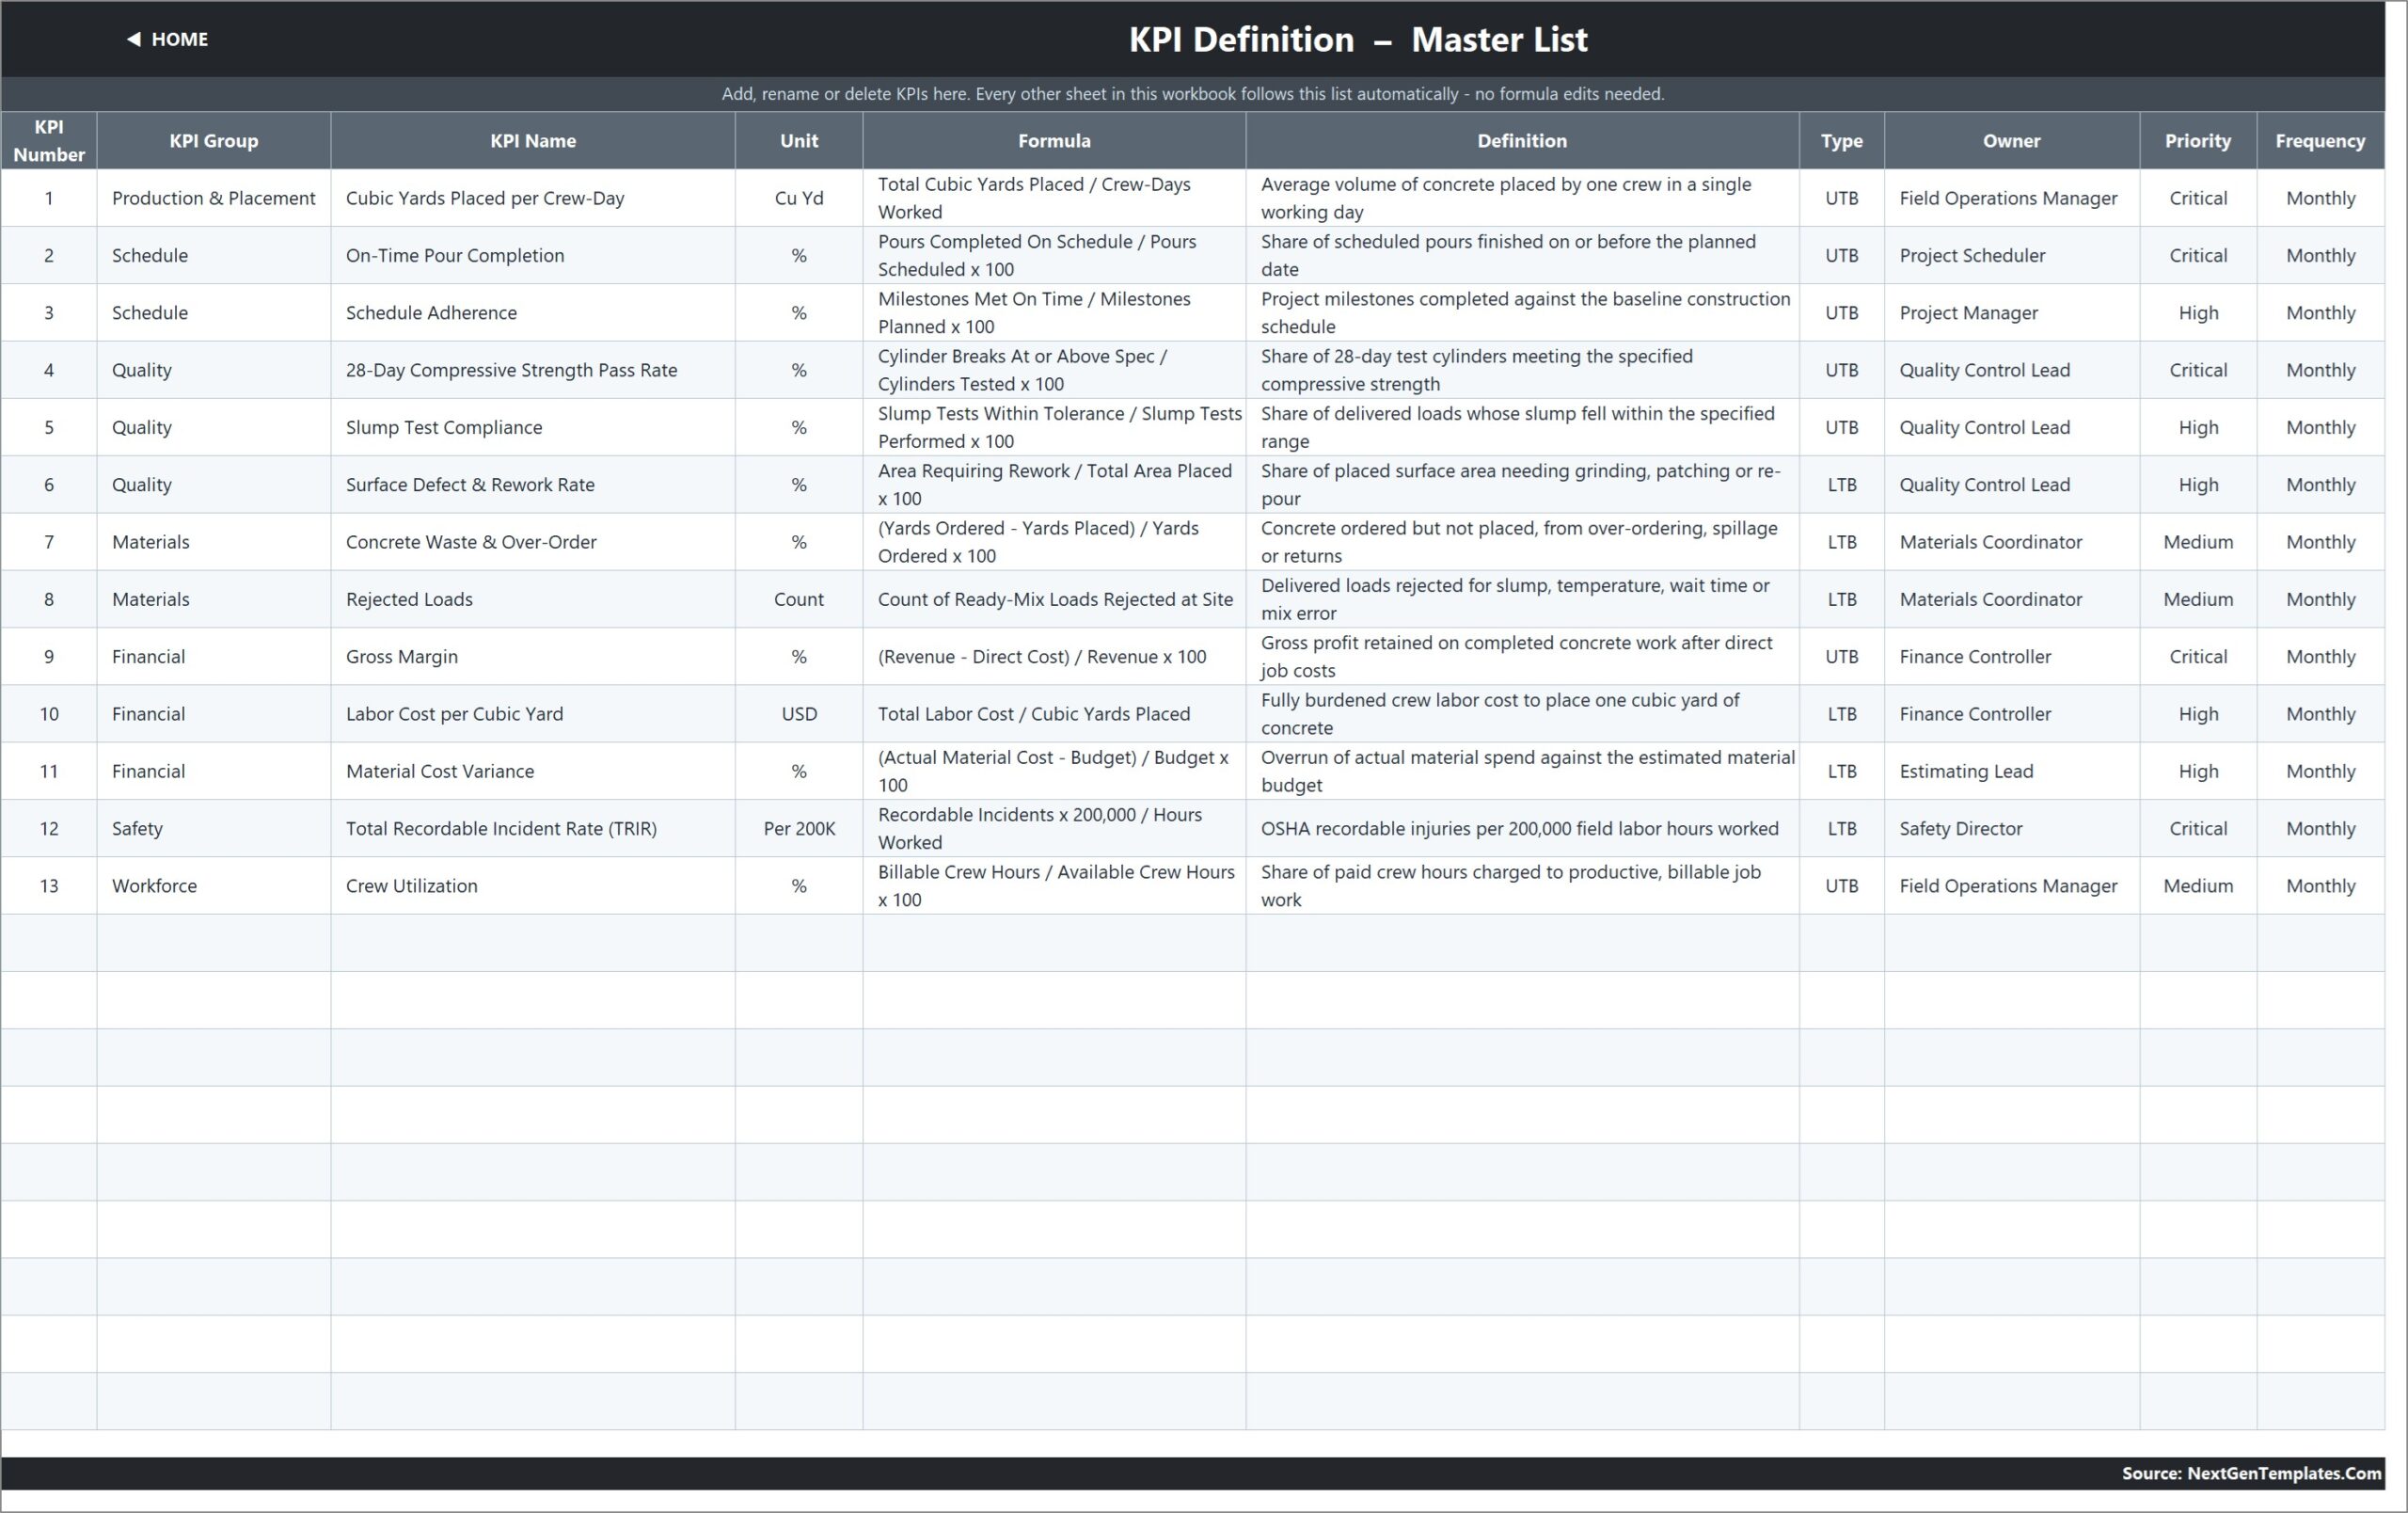
The master list. Ten columns per KPI — number, group, name, unit, formula, definition, type, owner, priority and frequency. Owners in the sample run from Field Operations Manager and Project Scheduler to Quality Control Lead, Materials Coordinator, Finance Controller, Estimating Lead and Safety Director. Every other sheet reads this list.
Page 9: Read Me
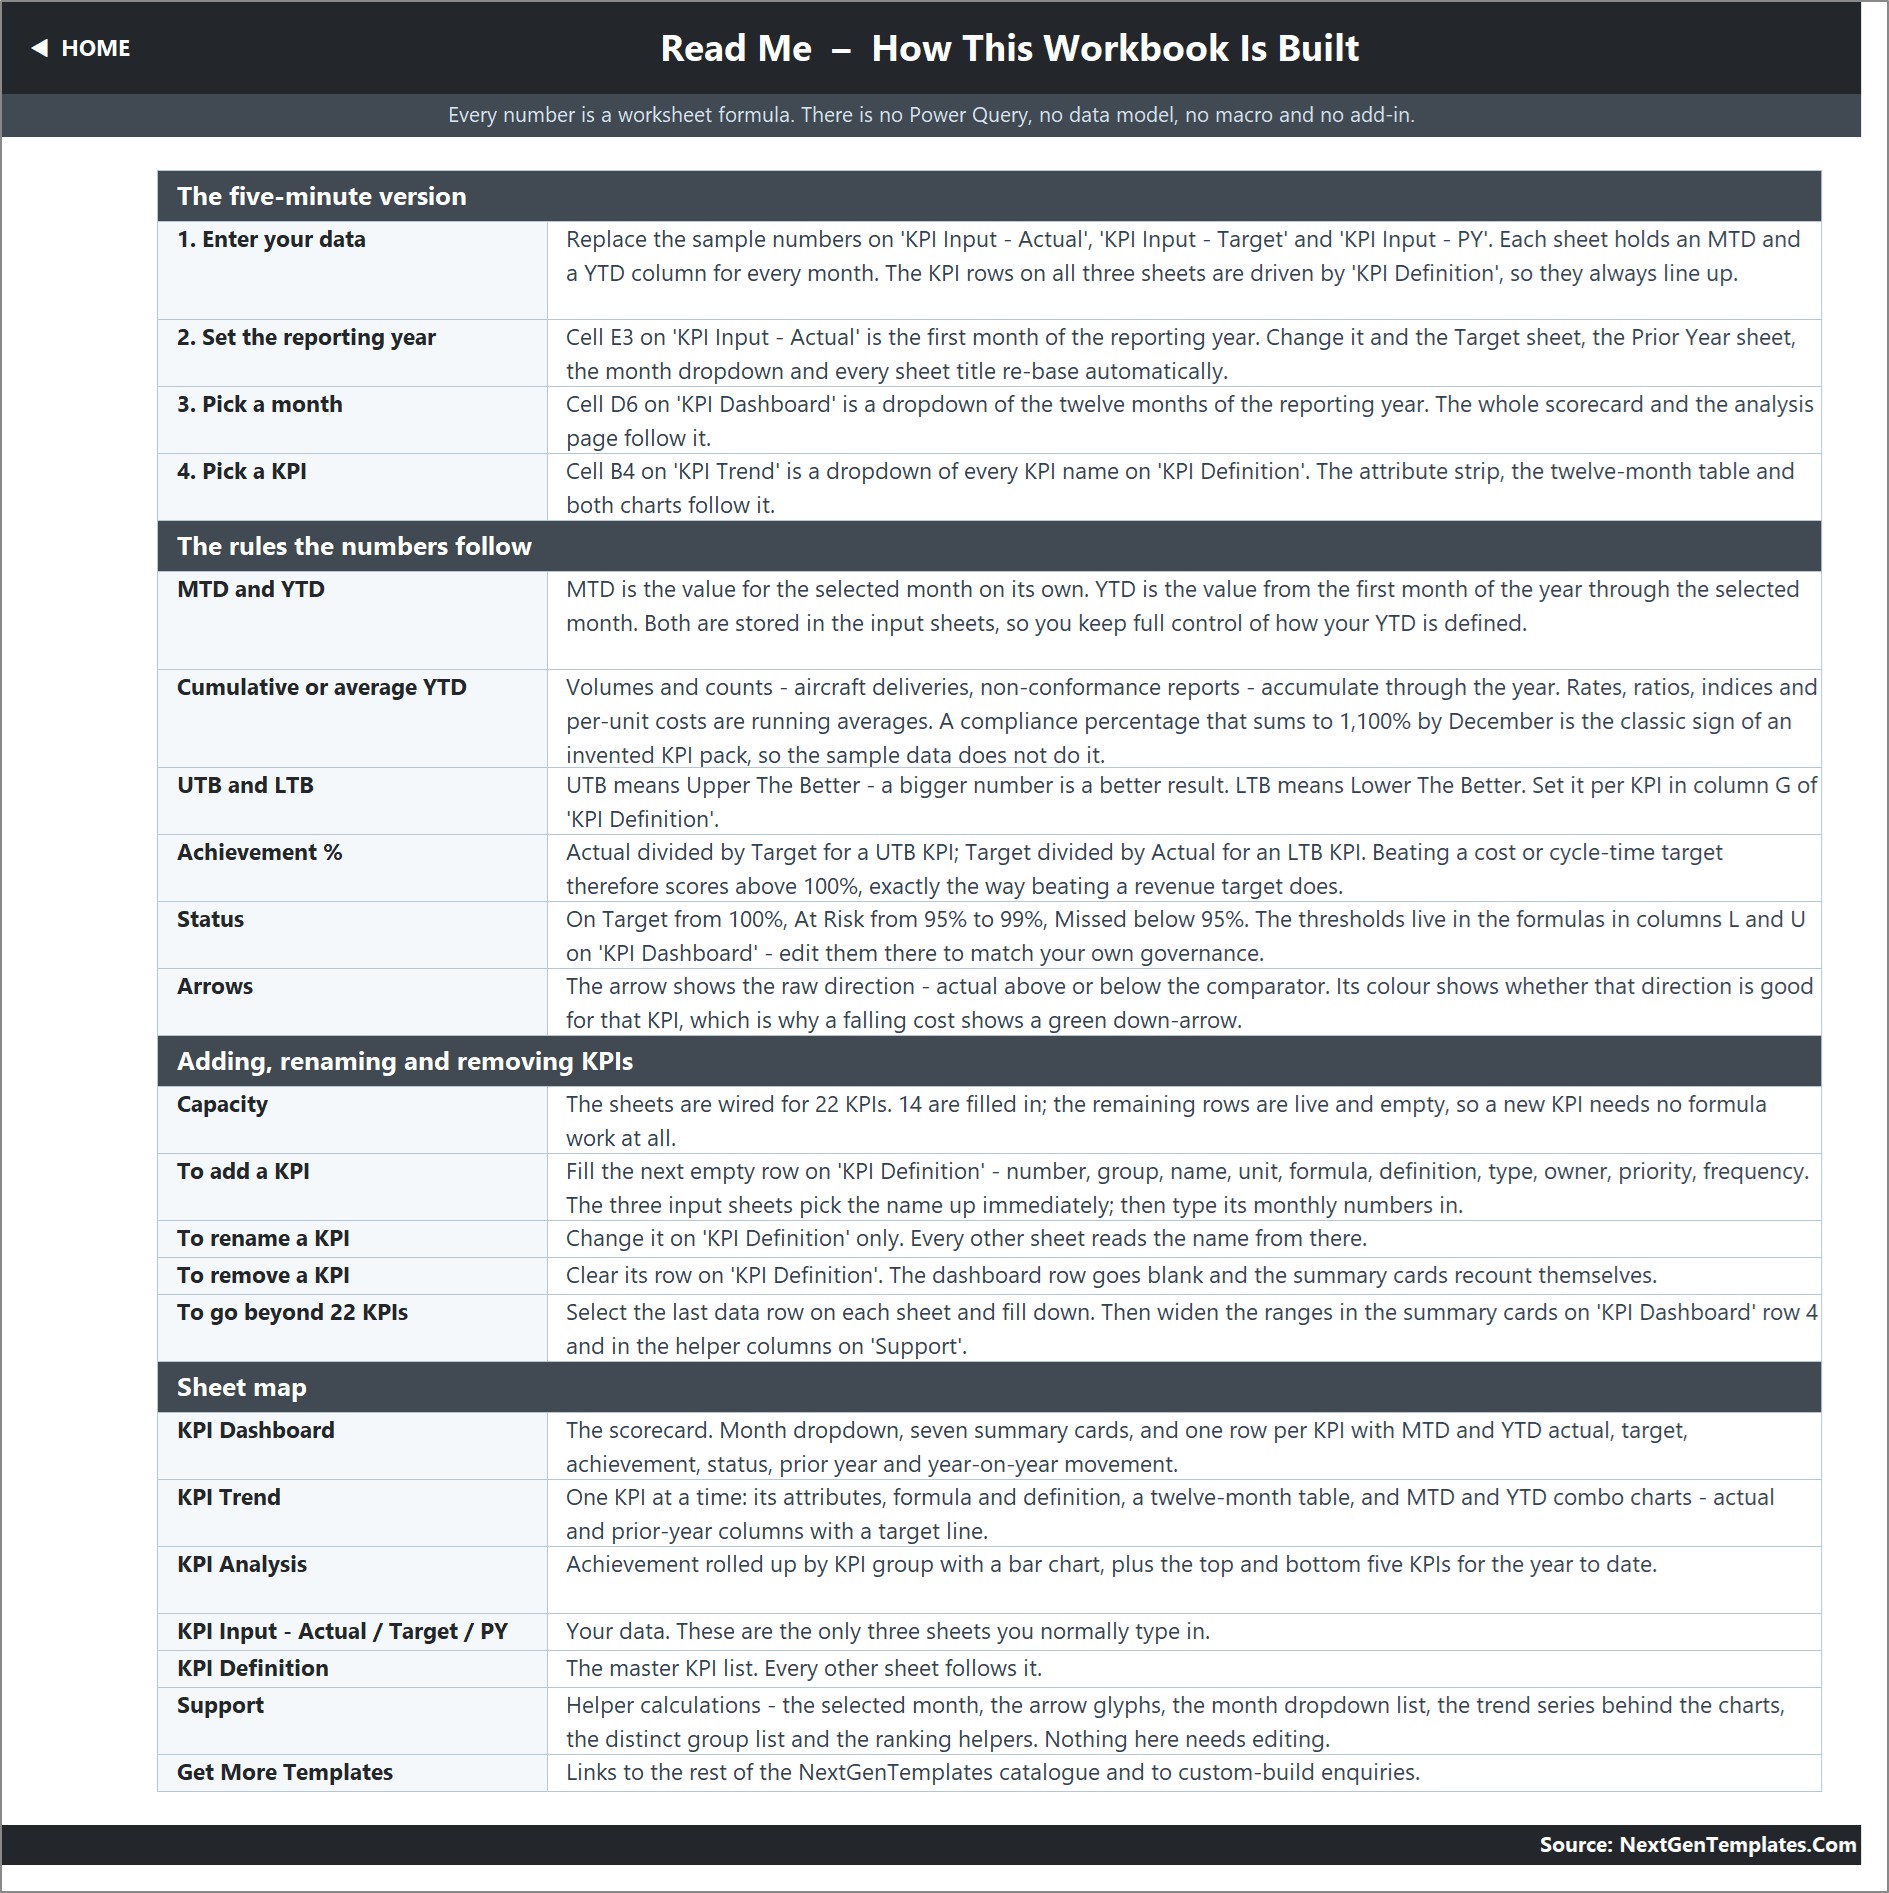
The build notes — a five-minute quick start, the rules the numbers follow (MTD and YTD, cumulative versus average YTD, UTB and LTB, achievement, status, arrow colouring), how to add, rename and remove KPIs, and a sheet-by-sheet map.
📊 Concrete Contractor KPI Dashboard in Excel vs. a Google Sheets Equivalent vs. Paid Construction SaaS — Where This Fits
| Feature | Concrete Contractor KPI Dashboard in Excel | Google Sheets equivalent | Procore / Buildertrend |
|---|---|---|---|
| Cost | $12.99 one-time ✅ | $9-15 one-time | $99-375 / user / month |
| Platform | Microsoft Excel 2013+ and Excel for the web | Browser, Google account required | Browser plus mobile app |
| Setup time | Under 15 minutes — replace three input sheets ✅ | Copy the sheet, then paste data | Days to weeks, plus onboarding |
| Works offline | Yes — it is a local .xlsx ✅ | No, needs a connection to edit | Partial, sync required |
| Real-time team collaboration | Via OneDrive / SharePoint co-authoring | Native, multi-user ✅ | Native, multi-user |
| Customisable KPIs | Yes — 22 KPI rows wired, add one by typing ✅ | Yes, within the sheet’s own limits | Restricted to the vendor’s field set |
| Direction-aware (UTB / LTB) scoring | Built in, per KPI ✅ | Usually manual | Varies by module |
| Macros / add-ins required | None — plain worksheet formulas ✅ | None | N/A, hosted |
| Year-1 cost at 5 users | $12.99 ✅ | About $15 | $5,940 – $22,500 |
For a concrete crew that wants a monthly KPI review pack without paying per-seat construction-management fees, the Concrete Contractor KPI Dashboard in Excel sits in the sweet spot.
👥 Who This Template Is For — and Who It’s Not For
✅ This template is built for:
- Owners and operations managers at concrete and flatwork contractors running 2-30 crews who report monthly.
- Project managers who need one page showing pour schedule, cylinder pass rate, waste and margin together.
- Quality and safety leads who already collect slump, break-test and incident numbers and want them scored against target.
- Estimators and finance controllers watching labour cost per cubic yard and material cost variance month over month.
❌ This template is NOT for:
- Anyone who needs a safety or OSHA recordkeeping system. TRIR appears here as a monthly KPI you type in; the workbook holds no incident register, no OSHA 300/300A forms and files nothing with any regulator.
- Teams wanting live job-costing, scheduling or field data capture — nothing connects to an ERP, a batch plant or a timesheet app.
- Anyone expecting the workbook to derive YTD for them. MTD and YTD are both typed on the input sheets, deliberately, so you keep control of how your YTD is defined.
- Daily or per-pour tracking. The grid is monthly, twelve columns per year.
⚙️ How to Use the Concrete Contractor KPI Dashboard in Excel
- Open the .xlsx in Excel 2013 or later. Nothing to install, no macros to enable.
- On KPI Definition, edit the 13 sample KPIs to your own — name, group, unit, formula text, owner and, critically, the UTB or LTB type.
- Set cell E3 on KPI Input – Actual to the first month of your reporting year. Every other sheet re-bases automatically.
- Replace the sample MTD and YTD numbers on KPI Input – Actual, KPI Input – Target and KPI Input – PY.
- Go to KPI Dashboard, pick a month in cell D6, and read the seven cards and both MTD and YTD blocks.
- Open KPI Trend and pick a KPI to see its twelve-month table and its two charts.
- Adjust the On Target / At Risk / Missed thresholds in columns L and U if your governance uses different bands.
💼 Real-World Use Cases
Miguel runs a 40-person flatwork contractor in Texas. On the first Monday of each month he pastes crew-day volumes, pour completions and rejected-load counts into the input sheets, picks the month, and walks his foremen through the six KPIs sitting At Risk — without buying seats in a construction-management platform.
Priya is quality lead at a structural concrete subcontractor. She owns the 28-Day Compressive Strength Pass Rate and Slump Test Compliance rows, uses KPI Trend to show that pass rate has held near target all year, and uses the Bottom 5 table on KPI Analysis to argue for a change in mix supplier.
Daniel is finance controller for a three-branch ready-mix and placing business. Labor Cost per Cubic Yard and Material Cost Variance are LTB in his copy, so a month where costs fall scores above 100% and shows a green down-arrow — which is exactly how he wants his board pack to read.
❓ Frequently Asked Questions
What KPIs does the Concrete Contractor KPI Dashboard in Excel track?
The Concrete Contractor KPI Dashboard in Excel ships 13 KPIs: Cubic Yards Placed per Crew-Day, On-Time Pour Completion, Schedule Adherence, 28-Day Compressive Strength Pass Rate, Slump Test Compliance, Surface Defect & Rework Rate, Concrete Waste & Over-Order, Rejected Loads, Gross Margin, Labor Cost per Cubic Yard, Material Cost Variance, TRIR and Crew Utilization.
How long does setup take?
Under 15 minutes for most users. Set the reporting year in one cell, replace the sample MTD and YTD numbers on the three input sheets, and the Concrete Contractor KPI Dashboard in Excel recalculates. There is no query to refresh, no data model to load and no macro to enable.
Can I add my own KPIs or change the ones supplied?
Yes. The Concrete Contractor KPI Dashboard in Excel is wired for 22 KPI rows, of which 13 are filled. Type a new KPI on the KPI Definition sheet and it appears on the three input sheets, the scorecard, the trend page and the analysis page with no formula editing.
Does it handle lower-is-better metrics like waste and incident rate correctly?
Yes. Flag the KPI as LTB and the Concrete Contractor KPI Dashboard in Excel computes achievement as Target ÷ Actual, so beating a waste, rework, cost or TRIR target scores above 100%. Six of the 13 supplied KPIs are LTB and score this way.
Is this a safety or OSHA compliance system?
No. Total Recordable Incident Rate is one monthly KPI you enter yourself. The Concrete Contractor KPI Dashboard in Excel holds no incident register, generates no OSHA 300 or 300A log and submits nothing to any authority. Use it for management reporting alongside your compliance system, not instead of it.
How does this compare to Procore or Buildertrend?
Those are full construction-management platforms at roughly $99-375 per user per month. The Concrete Contractor KPI Dashboard in Excel is a $12.99 one-time monthly reporting layer — it does not schedule work, cost jobs live or capture field data, but it gives you a director-ready KPI pack you own outright.
What exactly do I download?
A single ZIP containing the Concrete Contractor KPI Dashboard .xlsx workbook plus the Excel KPI Dashboard user manual PDF. The workbook opens in Excel 2013 and later and in Excel for the web, and every figure in it is a visible worksheet formula.
👤 About the Author
Built by PK — Microsoft Certified Professional with 15+ years of Excel, Google Sheets and Power BI experience. Founder of NextGenTemplates, reaching 300K+ subscribers across YouTube channels (@PK-AnExcelExpert, @NextGenTemplates, @NeoTechNavigators). Every template is hand-built and tested before release.
🔗 Explore Related Templates
- Concrete Contractor KPI Scorecard in Excel — the lighter ten-KPI scorecard from the KPI Scorecard line, same trade, different template.
- Concrete Contractor KPI Scorecard in Google Sheets — the browser-based version of that scorecard.
- Masonry Contractor KPI Dashboard in Excel — the same month-picker dashboard built for masonry crews.
- Construction Dashboard in Excel — the analytical, slicer-driven line rather than a KPI scorecard.
- Browse the full KPI Dashboard Templates range and the wider Microsoft Excel Templates catalogue.
📖 Click here to read the Detailed Blog Post
🎥 Visit our YouTube channel for step-by-step video tutorials
👉 YouTube.com/@NextGenTemplates
📅 Last updated: September 2026
Watch the demo video:
Compatibility and Requirements
- Works in Microsoft Excel desktop (Excel 2016 or later, or Microsoft 365). Every figure is a plain worksheet formula, and the page lists no macros.
- The Trend sheet shows its KPI results in combo charts. Microsoft explains how to build them in Create a chart from start to finish.
Related Concrete and Contractor Templates
- Concrete Contractor KPI Dashboard in Google Sheets: the same dashboard for Google Sheets
- Concrete Contractor KPI Dashboard in Power BI: the Power BI edition
- Roofing Contractor KPI Dashboard in Excel: a month-picker KPI dashboard for roofing crews
- HVAC Contractor KPI Dashboard in Excel: a month-picker KPI dashboard for HVAC contractors
- Construction Project Intelligence Kit: 6 construction templates in one bundle
Browse all Excel KPI dashboards.
































Reviews
There are no reviews yet.