

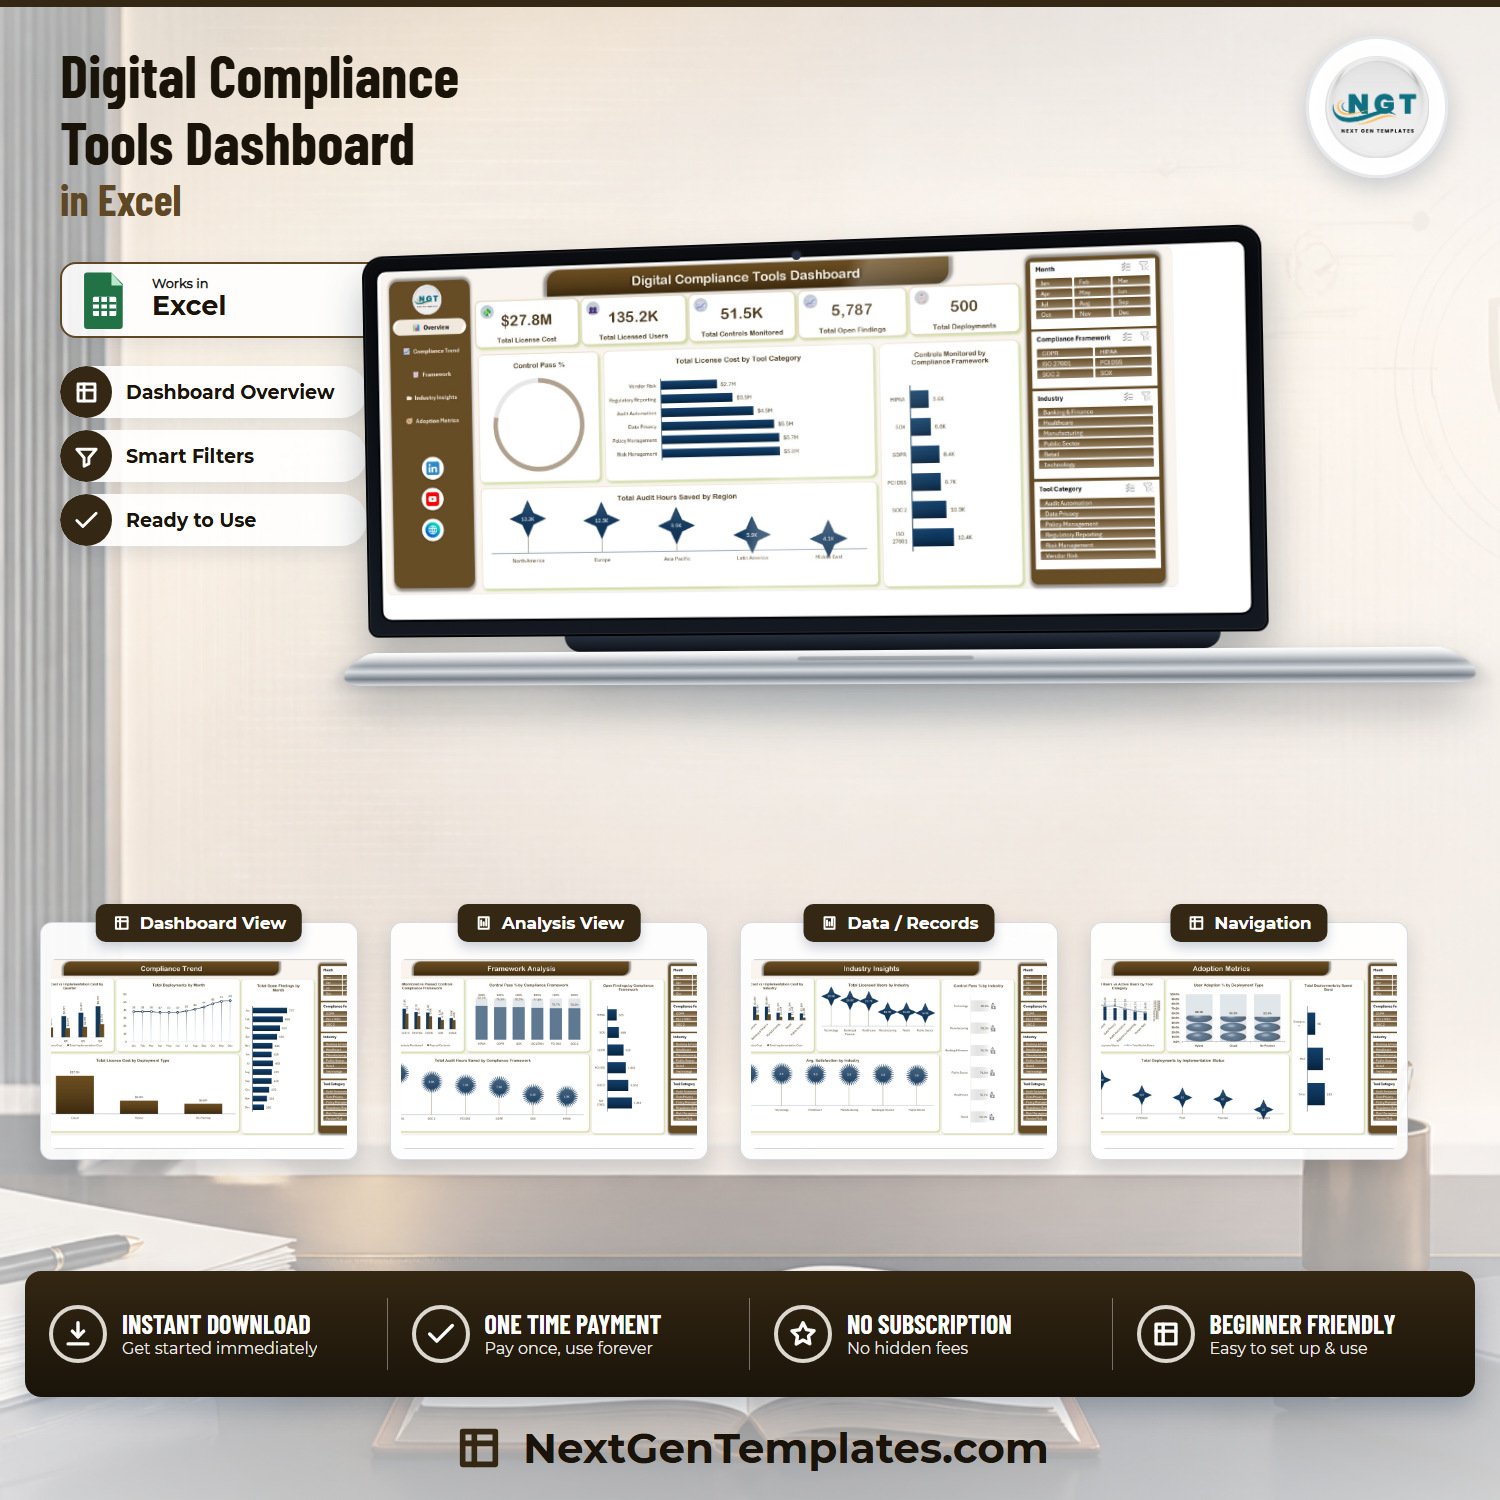

The Digital Compliance Tools Dashboard in Excel turns a flat register of GRC-tool deployments into five linked report pages driven by 500 sample deployment records across 28 columns, 20 charts, 25 background pivot tables and 4 shared slicers. Every visual recalculates from one table, so filtering to a single framework or one industry reshapes all five pages at once. Built by PK, a Microsoft Certified Professional with 15+ years in Excel, and used by teams across a 300K+ subscriber audience. One-time payment, instant download, no subscription, and help within 72 hours if anything does not work as described.
Read this before you buy: this is an offline Excel analytics workbook shipped with fictional sample data. It is not a GRC platform, not an audit system of record, and it does not connect to any compliance tool, ticketing system, evidence repository or regulator feed. Using it does not make an organisation compliant with SOC 2, ISO 27001, GDPR, HIPAA, PCI DSS, SOX or any other framework – those names appear only as sample category labels in the dataset. It is a reporting layer for numbers you already own.
Key Features of the Digital Compliance Tools Dashboard in Excel
- Five report pages, one dataset – Overview, Compliance Trend, Framework Analysis, Industry Insights and Adoption Metrics, all reading the same 500-row table.
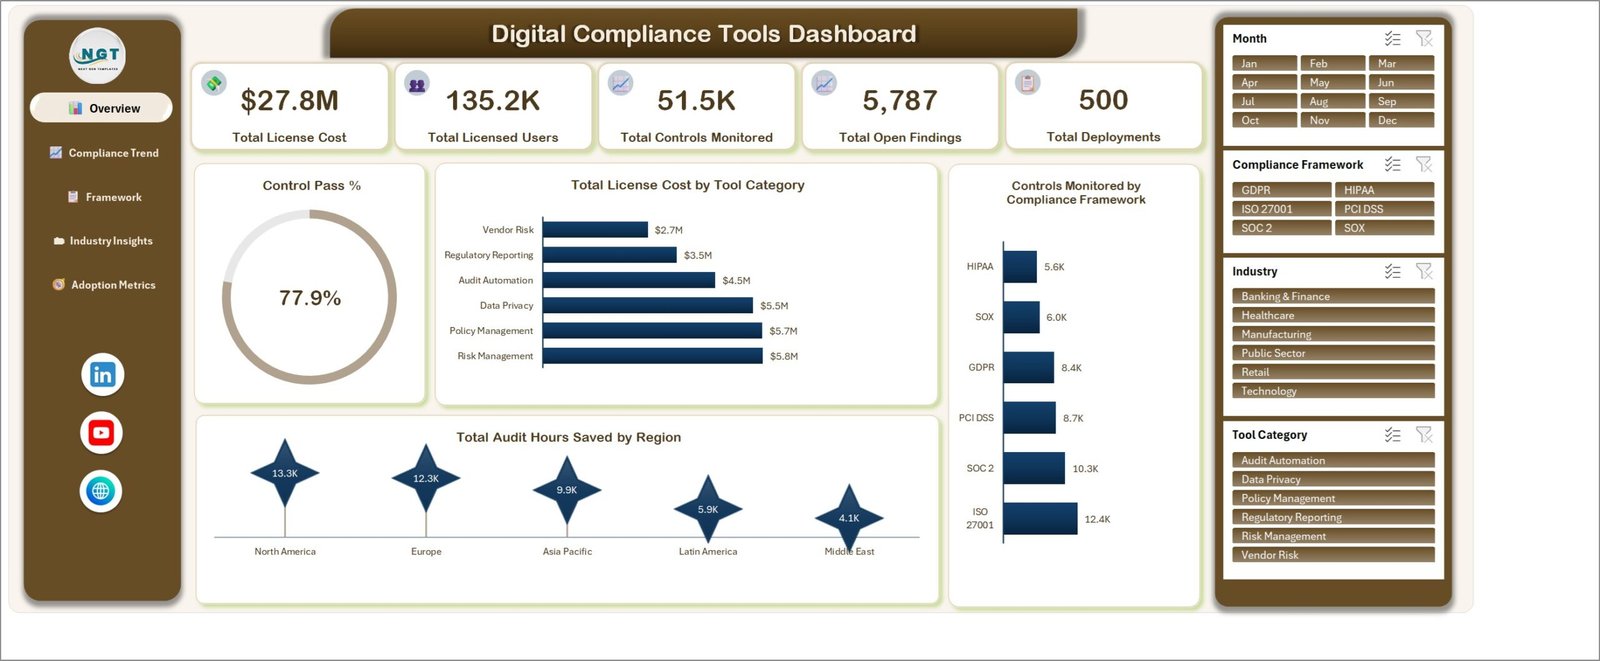
- Five KPI cards on the Overview – Total License Cost ($27.8M in the sample), Total Licensed Users (135.2K), Total Controls Monitored (51.5K), Total Open Findings (5,787) and Total Deployments (500).
- Four slicers wired across every page – Month, Compliance Framework, Industry and Tool Category. Click ISO 27001 and all 20 charts follow.
- 20 charts, four per page – each titled by metric and dimension, for example Total License Cost by Tool Category and Control Pass % by Compliance Framework.
- A Control Pass % measure that is calculated, not typed – Controls Passed over Controls Monitored, shown as a 77.9% donut on the Overview and broken out by framework and by industry elsewhere.
- Spend split into license versus implementation – paired columns by quarter and by industry, so the one-off cost of rolling a tool out is never hidden inside the licence line.
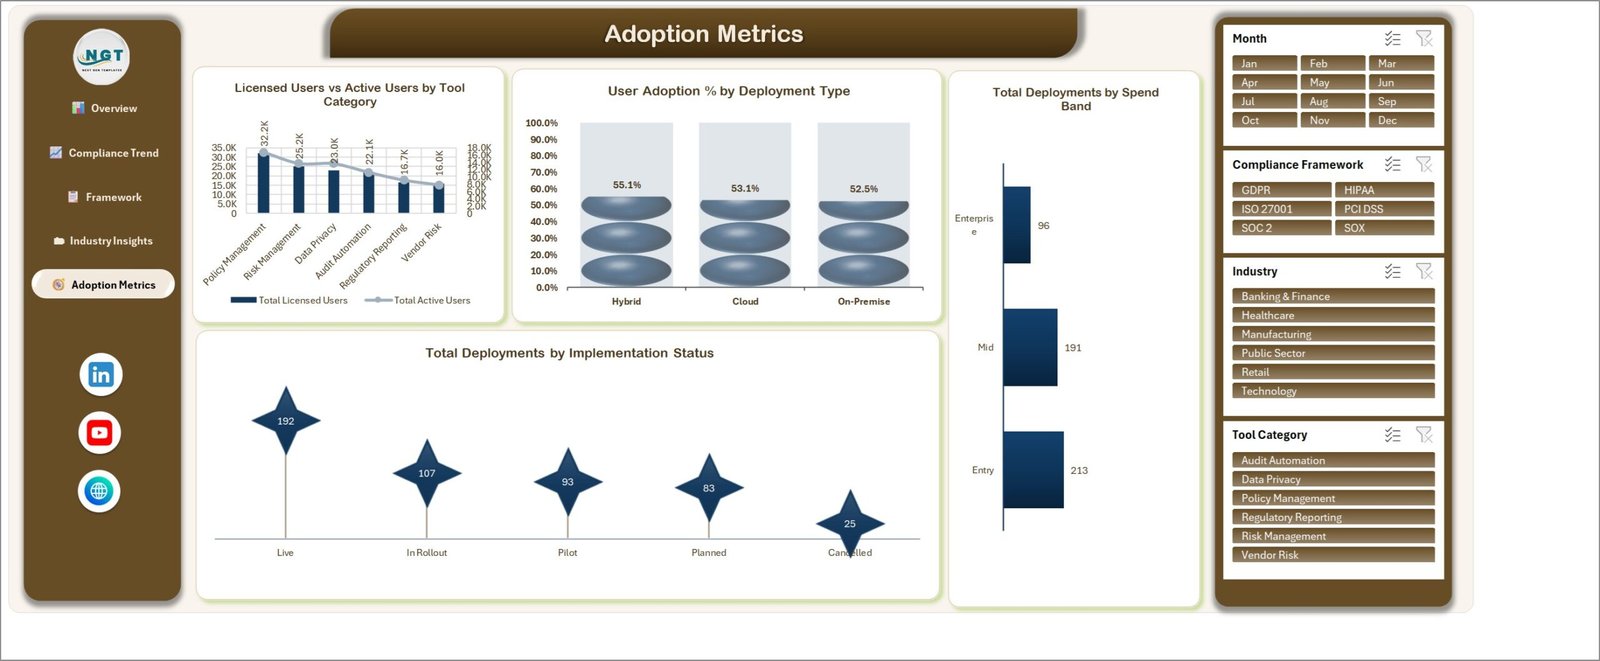
- Adoption measured, not assumed – Licensed Users against Active Users by tool category, plus a User Adoption % view by deployment type (Hybrid 55.1%, Cloud 53.1%, On-Premise 52.5% in the sample).
- Left-hand page navigation – five buttons, no tab hunting, and the Data and Support sheets stay out of the way.
- Plain .xlsx, no macros – nothing to enable, no security prompt, and it opens on Excel for Windows or Mac.
What’s Inside the Digital Compliance Tools Dashboard in Excel
The download is a single ZIP holding the workbook and a PDF user manual. The workbook has seven sheets: five dashboard pages, a Data sheet and a Support sheet.
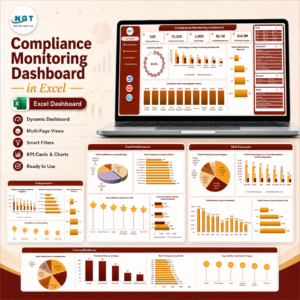
- Overview – the five KPI cards, the Control Pass % donut, Total License Cost by Tool Category, Controls Monitored by Compliance Framework and Total Audit Hours Saved by Region.
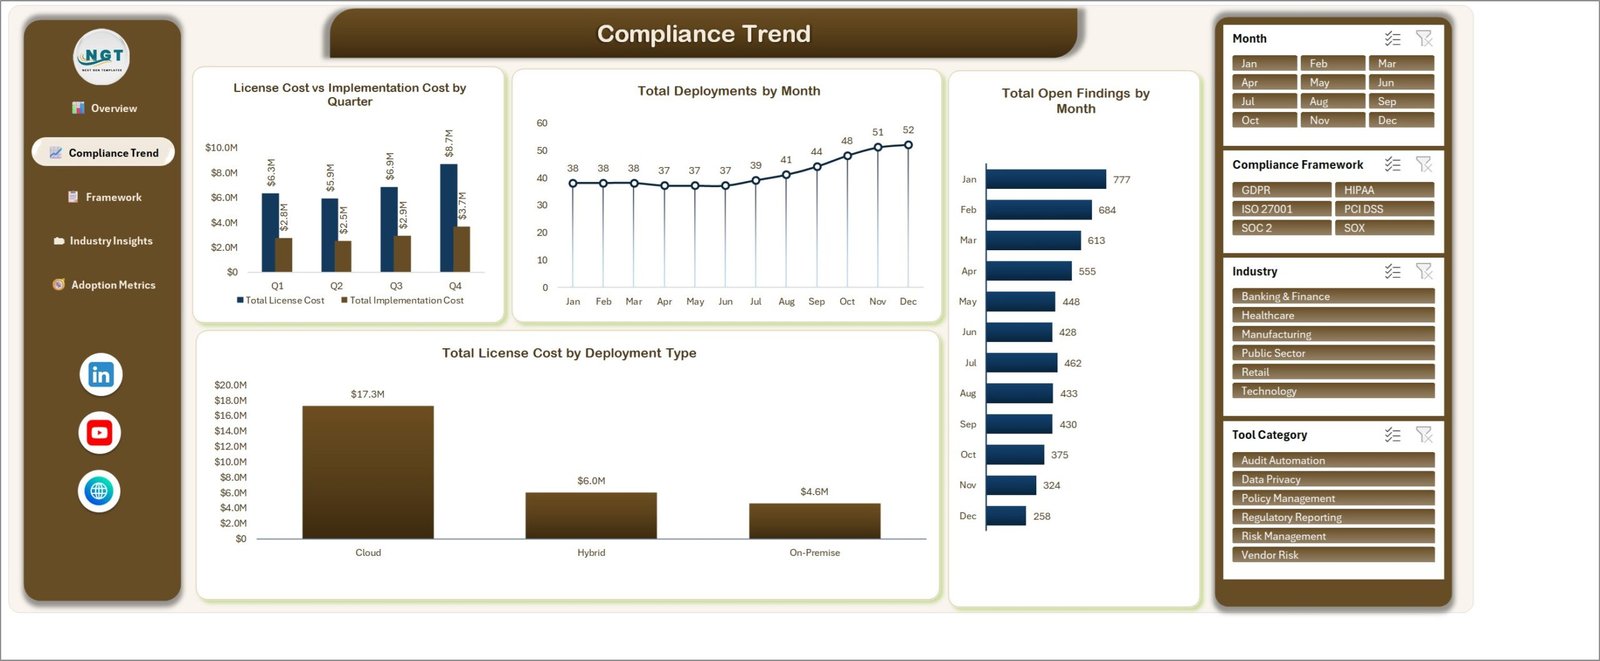
- Compliance Trend – License Cost vs Implementation Cost by Quarter, Total Deployments by Month (38 in January climbing to 52 in December), Total Open Findings by Month (777 down to 258) and Total License Cost by Deployment Type.
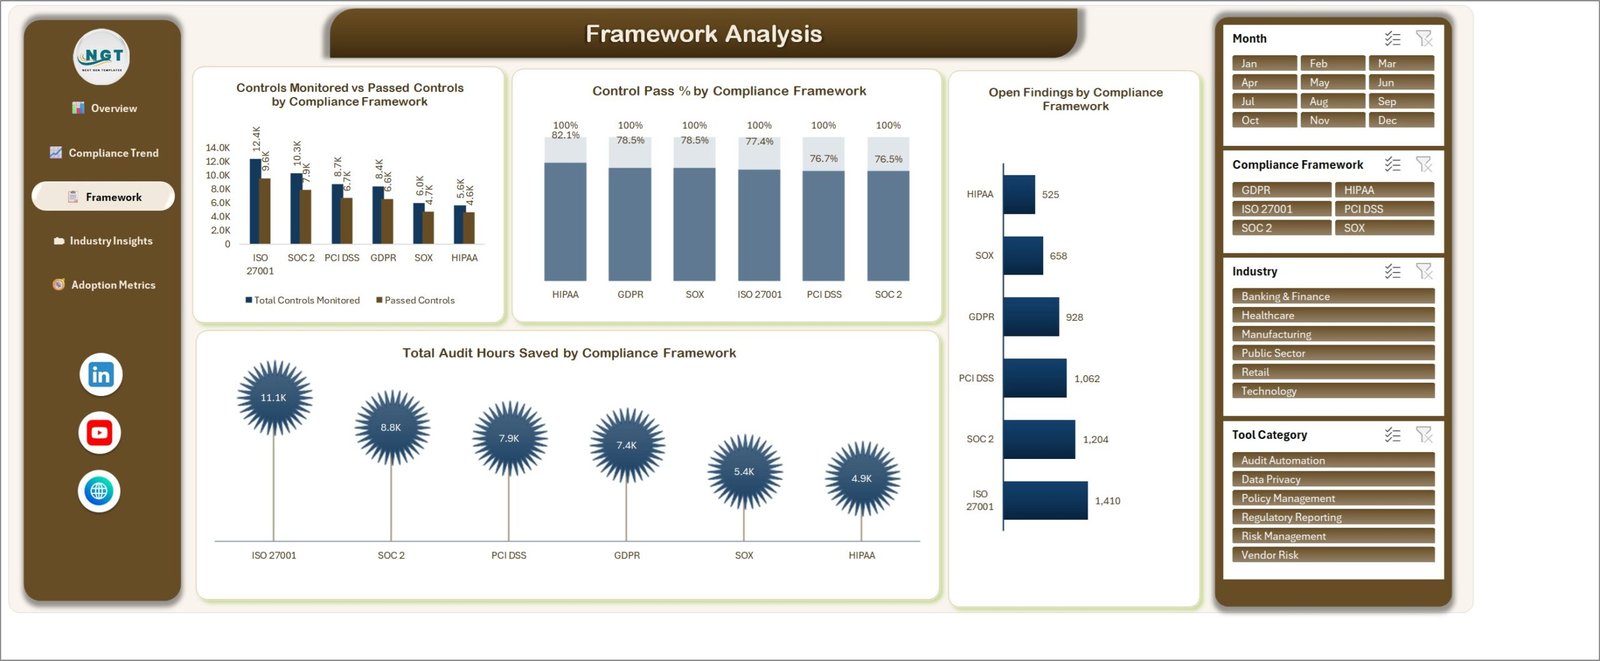
- Framework Analysis – Controls Monitored vs Passed Controls by Compliance Framework, Control Pass % by Compliance Framework, Open Findings by Compliance Framework and Total Audit Hours Saved by Compliance Framework.
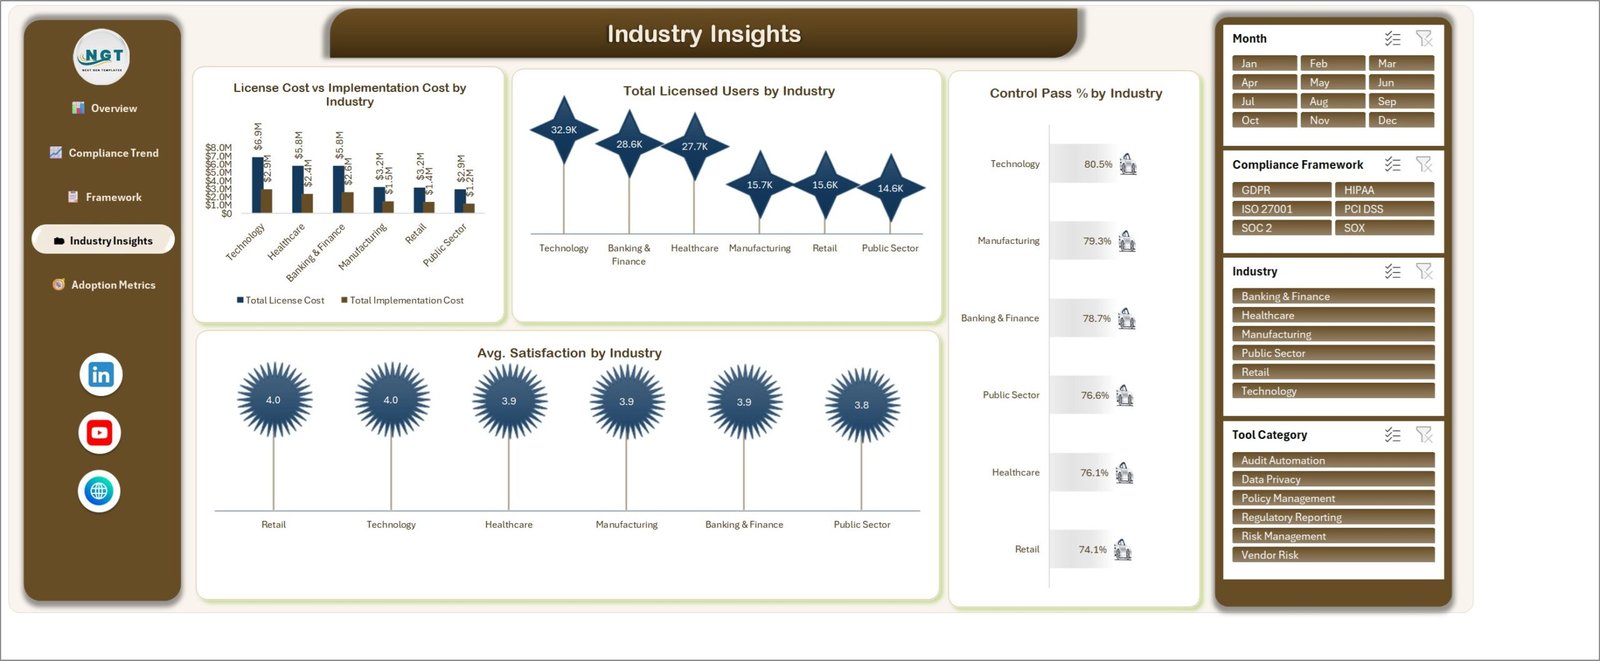
- Industry Insights – License Cost vs Implementation Cost by Industry, Total Licensed Users by Industry, Control Pass % by Industry and Avg. Satisfaction by Industry.
- Adoption Metrics – Licensed Users vs Active Users by Tool Category, User Adoption % by Deployment Type, Total Deployments by Spend Band and Total Deployments by Implementation Status (Live 192, In Rollout 107, Pilot 93, Planned 83, Cancelled 25).
- Data – the
TblDataExcel Table, columns B to AC, holding 500 records. Fields include Deployment ID, Date, Tool Name, Tool Category, Compliance Framework, Industry, Region, Deployment Type, Implementation Status, License Cost, Implementation Cost, Licensed Users, Active Users, Controls Monitored, Controls Passed, Open Findings, Audit Hours Saved and Satisfaction Score, plus derived Month, Year, Quarter, Spend Band, Control Pass Rate and User Adoption columns. - Support – the 25 pivot tables the charts read from. You never need to open it, but it is unlocked if you want to add a sixth page.
Sample dimension values: 6 tool categories (Audit Automation, Data Privacy, Policy Management, Regulatory Reporting, Risk Management, Vendor Risk), 6 framework labels, 6 industries, 5 regions, 3 deployment types, 5 implementation statuses and 3 spend bands.
Digital Compliance Tools Dashboard in Excel vs. Google Sheets vs. Paid GRC SaaS – Where This Fits
| This Excel dashboard | A Google Sheets build | Paid GRC SaaS | |
|---|---|---|---|
| Cost | $17.99 once | Free tool, your build time | Typically four to five figures per year |
| Platform | Excel for Windows or Mac | Browser | Vendor cloud |
| Setup time | Paste your data, hit Refresh All – about 10 minutes | Days to weeks to build the same 20 charts | Weeks of onboarding and integration work |
| Real-time team collaboration | No – file sharing or OneDrive co-authoring | Yes | Yes |
| Mobile access | Read-only via the Excel mobile app | Yes | Yes |
| Customisable fields | Yes – the table and pivots are unlocked | Yes | Limited to the vendor schema |
| Share with a link | Only through OneDrive or SharePoint | Yes | Yes |
| Year-1 cost at 5 users | $17.99 | $0 plus your build time | Thousands of dollars |
| Automated evidence collection | No – you supply the numbers | No | Yes, via integrations |
| Control pass rate by framework | Yes, calculated from your columns | Only if you build it | Yes |
| Works with no internet | Yes | No | No |
The honest summary: a GRC platform collects evidence and runs your programme. This workbook reports on the tools and controls you are already tracking, at a fraction of the annual cost, and it is the wrong choice if you need continuous monitoring or an auditor-facing system of record.
Who This Template Is For – and Who It’s Not For
A good fit if you are: a compliance or GRC manager who reports tool spend and control health to a steering committee each month; an IT procurement lead comparing licence cost against actual seat usage before a renewal; an internal audit lead who wants open findings and audit hours saved trended by framework; a consultant who benchmarks client compliance tooling and needs a clean five-page deck from a spreadsheet.
Not a good fit if you need: automated evidence collection or continuous control monitoring; a system of record an external auditor will accept; per-user permissions, approval workflow or an audit trail on edits; live sync with Jira, ServiceNow, a cloud security posture tool or a regulator portal; more than roughly 50,000 rows, where Excel pivots start to feel slow; or storage of personal or regulated data – an unencrypted local workbook is not the right home for that.
How to Use the Digital Compliance Tools Dashboard in Excel
- Unzip and open the workbook in Excel for Windows or Mac. It is a plain .xlsx, so there is no macro prompt.
- Walk the five pages with the sample data first using the left-hand navigation, so you can see what each chart is meant to answer before you change anything.
- Open the Data sheet and replace the sample rows inside
TblData. Keep the column headers exactly as they are – the pivots are bound to those names. The Excel Table extends automatically as you add rows. - Leave the derived columns alone. Month, Year, Quarter, Spend Band, Control Pass Rate and User Adoption are formula columns and will fill down on their own.
- Press Refresh All (Data > Refresh All, or Ctrl+Alt+F5). The workbook does not refresh its pivot cache on open, so this step is mandatory after every data change or your charts will still show the old numbers.
- Filter with the slicers down the right-hand side. All four are shared, so a click on Month, Compliance Framework, Industry or Tool Category redraws every page.
- Export what you need – each page prints to a single landscape page, or copy a chart straight into a slide deck.
Real-World Use Cases
Priya, GRC Manager at a 900-person fintech. Nine compliance tools, three renewal dates and a board that keeps asking what the stack costs. She loads a row per tool per month, filters the Tool Category slicer to Vendor Risk and Policy Management, and shows the committee where the licence spend actually sits against how heavily each category is used. The renewal conversation stops being a guess.
Marcus, IT Procurement Lead in manufacturing. He runs the Adoption Metrics page before every renewal. The Licensed Users vs Active Users by Tool Category chart is his only agenda item: any category where active users trail licensed seats badly becomes a seat-count negotiation rather than an automatic renewal.
Dana, an independent compliance consultant. One workbook per client. She swaps the data, refreshes, filters Industry to the client’s sector, and the five pages become the appendix of her assessment report – without rebuilding a single chart.
Frequently Asked Questions
Does this dashboard make my organisation SOC 2, ISO 27001 or GDPR compliant?
No. It makes no certification or compliance claim for any framework. Those names appear in the sample data only as category labels you can filter by. Compliance comes from your controls, your evidence and your auditor – this workbook only reports figures you enter yourself.
Does it connect to my compliance platform, cloud accounts or a regulator feed?
No. There is no integration, API call or live connection of any kind. It is a fully offline Excel file, and every number in it is one you paste in.
Are the numbers in the screenshots real?
No. All 500 rows are fictional sample data generated to demonstrate the layout. Figures like $27.8M in licence cost or a 77.9% control pass rate are illustrative, not benchmarks.
Do I need macros, Power Query or a Microsoft 365 subscription?
None of them. It is a standard .xlsx built on Excel Tables, pivot tables and slicers, and it works in any Excel version that supports slicers – Excel 2013 and later on Windows, Excel 2016 and later on Mac.
My charts did not change after I pasted new data. What went wrong?
The workbook does not refresh its pivot cache automatically when it opens. Go to Data > Refresh All (Ctrl+Alt+F5) and the 20 charts will redraw. This is the single most common support question on pivot-driven dashboards.
Can I add my own frameworks, tool categories or a sixth page?
Yes. The category values are plain text in the Data sheet, so new frameworks or tool categories appear in the slicers after a refresh. The Support sheet holding the 25 pivots is unlocked if you want to build another page from the same cache.
How many rows can it handle?
It ships with 500. A few thousand rows refresh comfortably on a normal laptop. Past roughly 50,000 rows you will feel the refresh, and a database-backed tool becomes the better answer.
About the Author
Built by PK – Microsoft Certified Professional with 15+ years of Excel, Google Sheets, and Power BI experience. Founder of NextGenTemplates, reaching 300K+ subscribers across YouTube channels. Every template is hand-built and tested before release.
Explore Related Templates
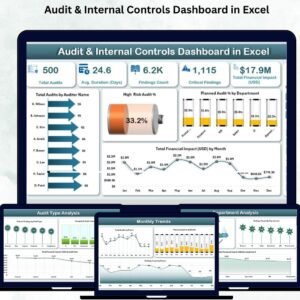
If you are building out a wider risk and security reporting stack, these pair well: the Cyber Risk Management Dashboard in Excel for threat and mitigation reporting, the Data Protection Office Dashboard in Excel for privacy-request and DPO workload reporting, and the Audit & Internal Controls Dashboard in Excel for control testing and findings. On the lighter side, the Compliance Audit KPI Dashboard in Google Sheets is a browser-based scorecard, and the IT Manager & CISO Toolkit bundles ten IT and security templates at a discount. Browse the full Excel Dashboard category or the Excel IT templates category for more.
A Power BI edition is also available: Digital Compliance Tools Dashboard in Power BI. There is currently no Google Sheets edition of this exact dashboard.
Get the Digital Compliance Tools Dashboard in Excel for $17.99 (regular $29.99). Instant download, one-time payment, lifetime access to the file, and free bug fixes for this template. If it does not match its description, email [email protected] with your order number within 48 hours of purchase.
Last updated: 31 August 2026.
Watch the demo video:
Compatibility and Requirements
- Works in Microsoft Excel desktop (Excel 2016 or later, or Microsoft 365). It is a plain .xlsx file, so there is no macro prompt.
- The four shared slicers filter all five pages at once. Microsoft explains them in Use slicers to filter data.



























Reviews
There are no reviews yet.