

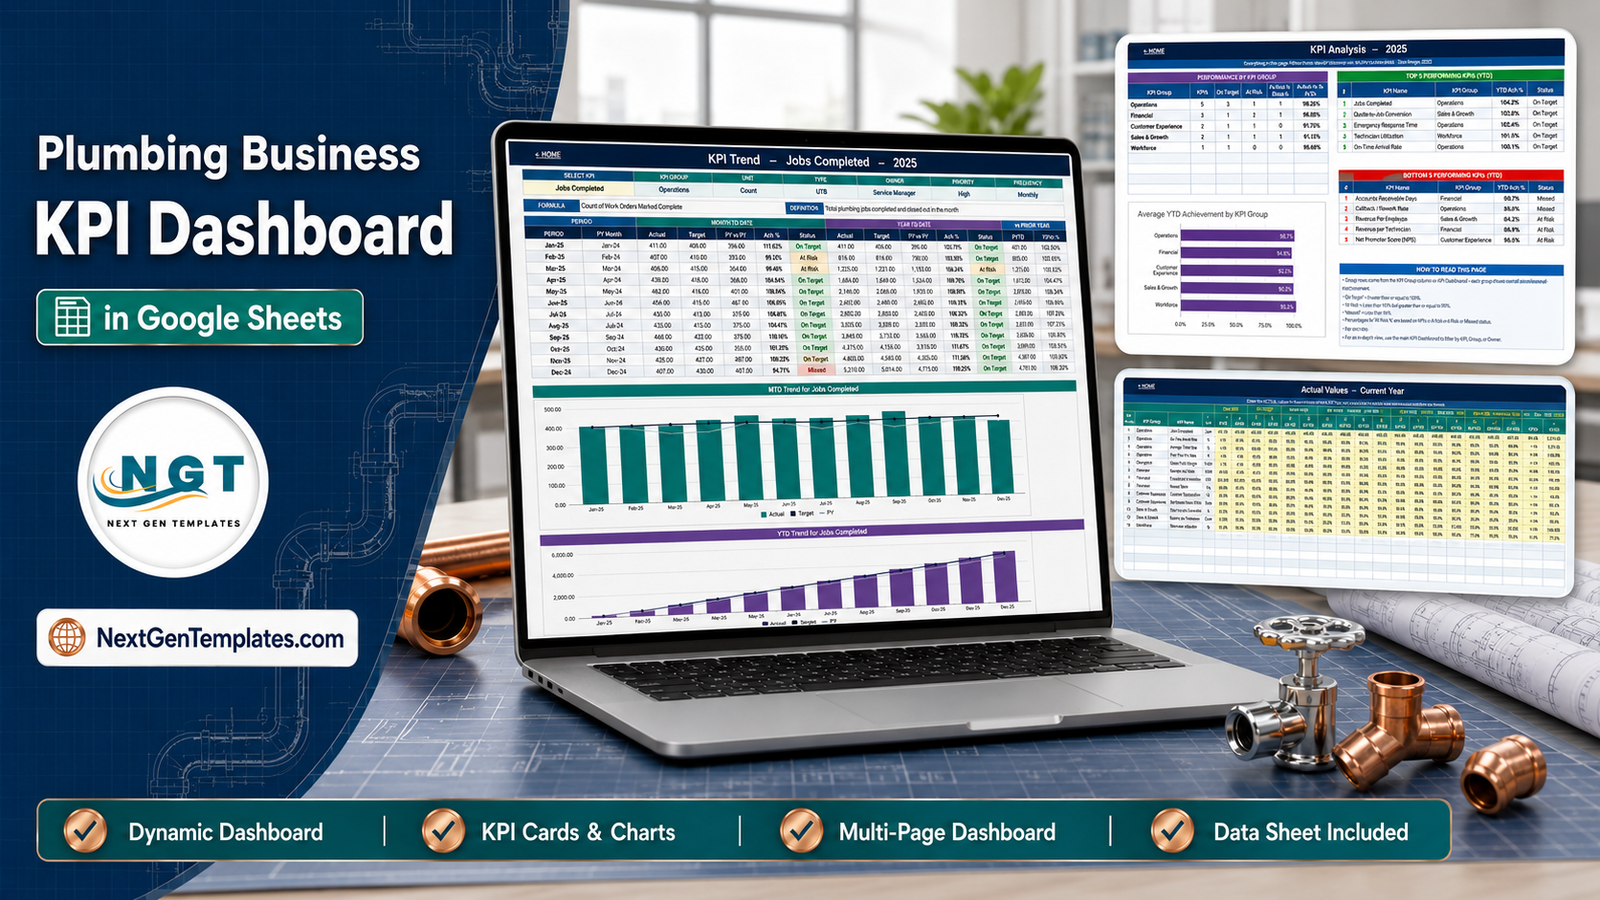

The Plumbing Business KPI Dashboard in Google Sheets is a formula-driven monthly scorecard for a plumbing service company. It tracks 14 KPIs across 5 groups – Operations, Financial, Customer Experience, Sales & Growth and Workforce – and reports every one of them Month-to-Date and Year-to-Date side by side, with Actual, Target, Achievement %, a traffic-light status and a vs-Prior-Year comparison. Pick a month from one dropdown and the whole workbook follows it. There is nothing to install: no add-on, no script, no Apps Script authorisation prompt, no external connector. Nine tabs, three of which are yellow input grids you type into. Instant download, lifetime access, and free bug fixes for this file.
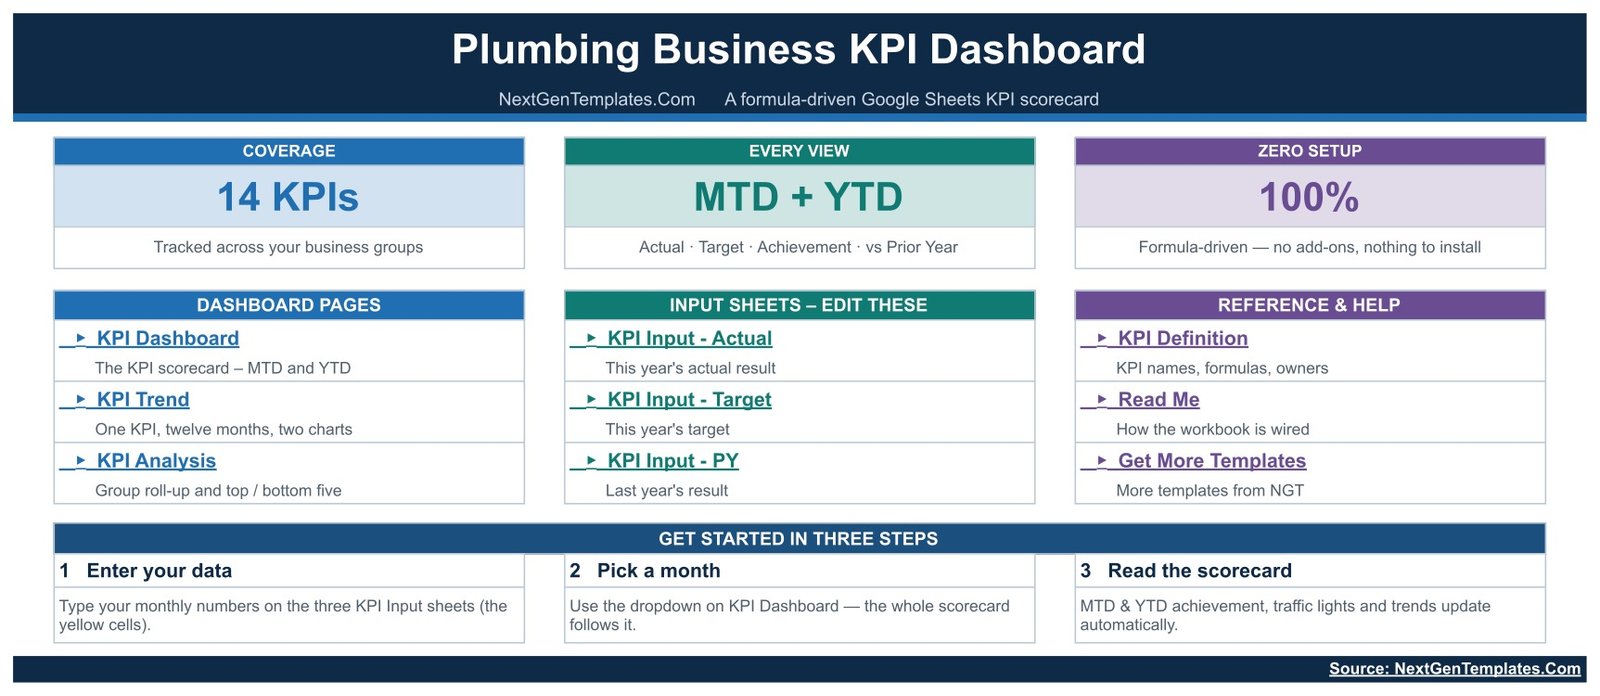
Key Features of the Plumbing Business KPI Dashboard in Google Sheets
- 14 plumbing KPIs, already defined – Jobs Completed, First-Time Fix Rate, On-Time Arrival Rate, Callback / Rework Rate, Emergency Response Time, Average Job Value, Revenue per Technician, Gross Margin, Accounts Receivable Days, Customer Satisfaction (CSAT), Net Promoter Score (NPS), Quote-to-Job Conversion, Service Plan Sign-ups and Technician Utilization.
- One month picker drives everything – choose the month on the KPI Dashboard tab and the scorecard, the KPI Analysis page and every traffic light recalculate. No refresh button, no query to re-run.
- MTD and YTD in the same row – each KPI shows Actual, Target, Achievement %, Status and Prior Year for the month, then the same five figures for the year to date.
- Direction-aware achievement – each KPI is typed UTB (upper the better) or LTB (lower the better). Achievement is Actual / Target for UTB and Target / Actual for LTB, so beating a cost or cycle-time target scores above 100% instead of below it.
- Traffic lights you can change – On Target at 100% and above, At Risk 95-99%, Missed below 95%. The thresholds live in the Status formulas on the KPI Dashboard tab, not in conditional-formatting rules you have to hunt for.
- A 12-month trend page per KPI – select any KPI and the KPI Trend tab redraws its full year, MTD and YTD, with two charts.
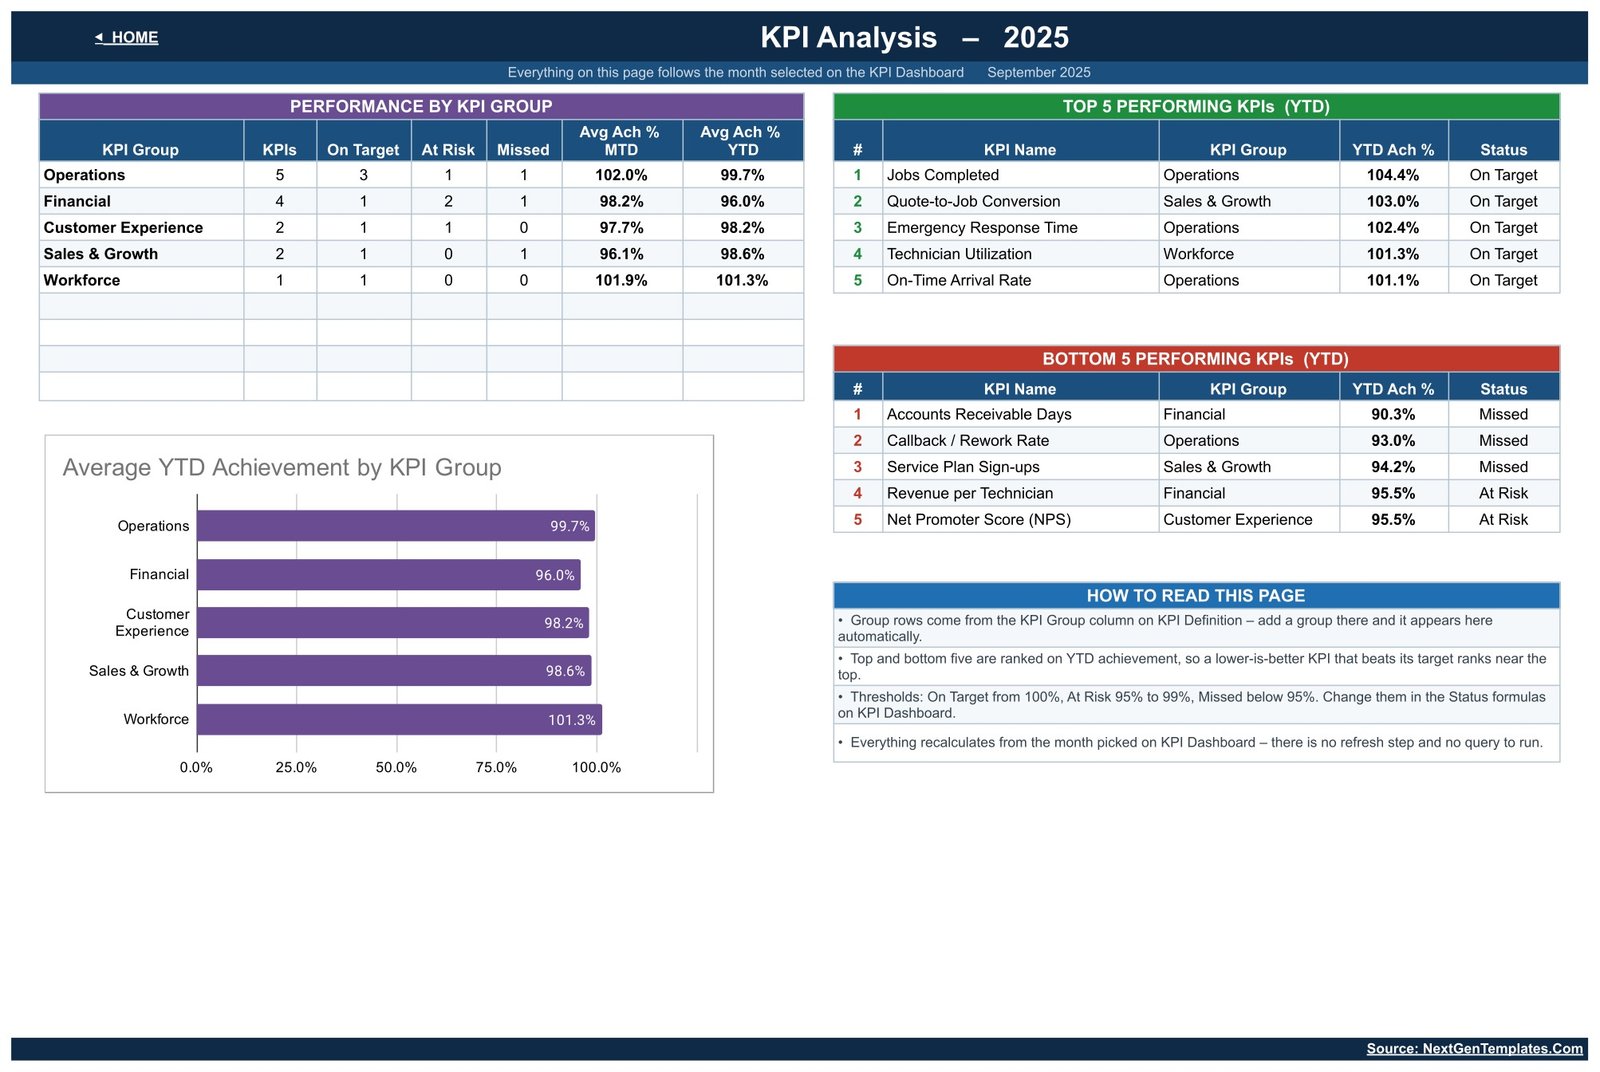
- Group roll-up and ranking – the KPI Analysis tab totals On Target / At Risk / Missed per group and ranks the top five and bottom five KPIs on YTD achievement.
- The KPI list is the master list – add, rename or delete a KPI on the KPI Definition tab and every other sheet follows it automatically. No formula edits.
- Owner, priority and frequency per KPI – so a review meeting can point at a name, not a number.
What’s Inside the Plumbing Business KPI Dashboard in Google Sheets
Nine tabs, grouped on a home page into three columns: dashboard pages, input sheets you edit, and reference.
KPI Dashboard – the scorecard
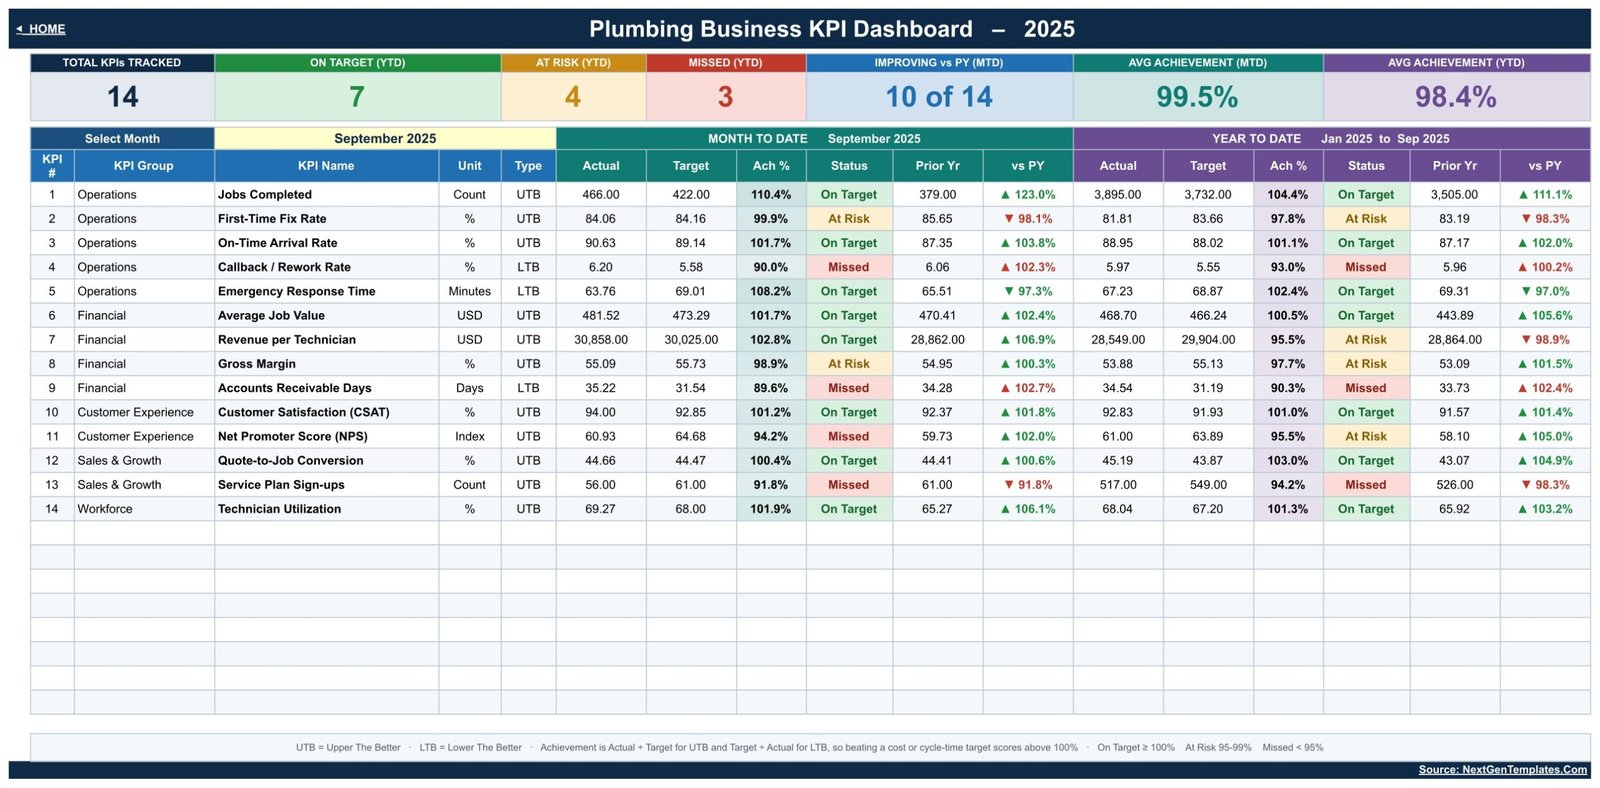
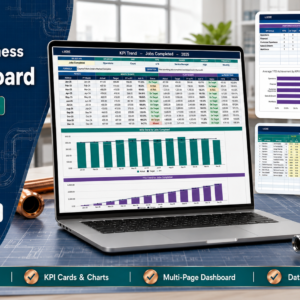
The main page. Seven header cards run across the top – Total KPIs Tracked, On Target (YTD), At Risk (YTD), Missed (YTD), Improving vs PY (MTD), Avg Achievement (MTD) and Avg Achievement (YTD). Below them, one row per KPI: KPI #, KPI Group, KPI Name, Unit, Type, then the Month-to-Date block (Actual, Target, Ach %, Status, Prior Yr, vs PY) and the Year-to-Date block with the same six columns. In the shipped sample – September 2025 – the header reads 14 KPIs, 7 On Target, 4 At Risk, 3 Missed, 10 of 14 improving against prior year, 99.5% average MTD achievement and 98.4% YTD.
KPI Trend – one KPI, twelve months
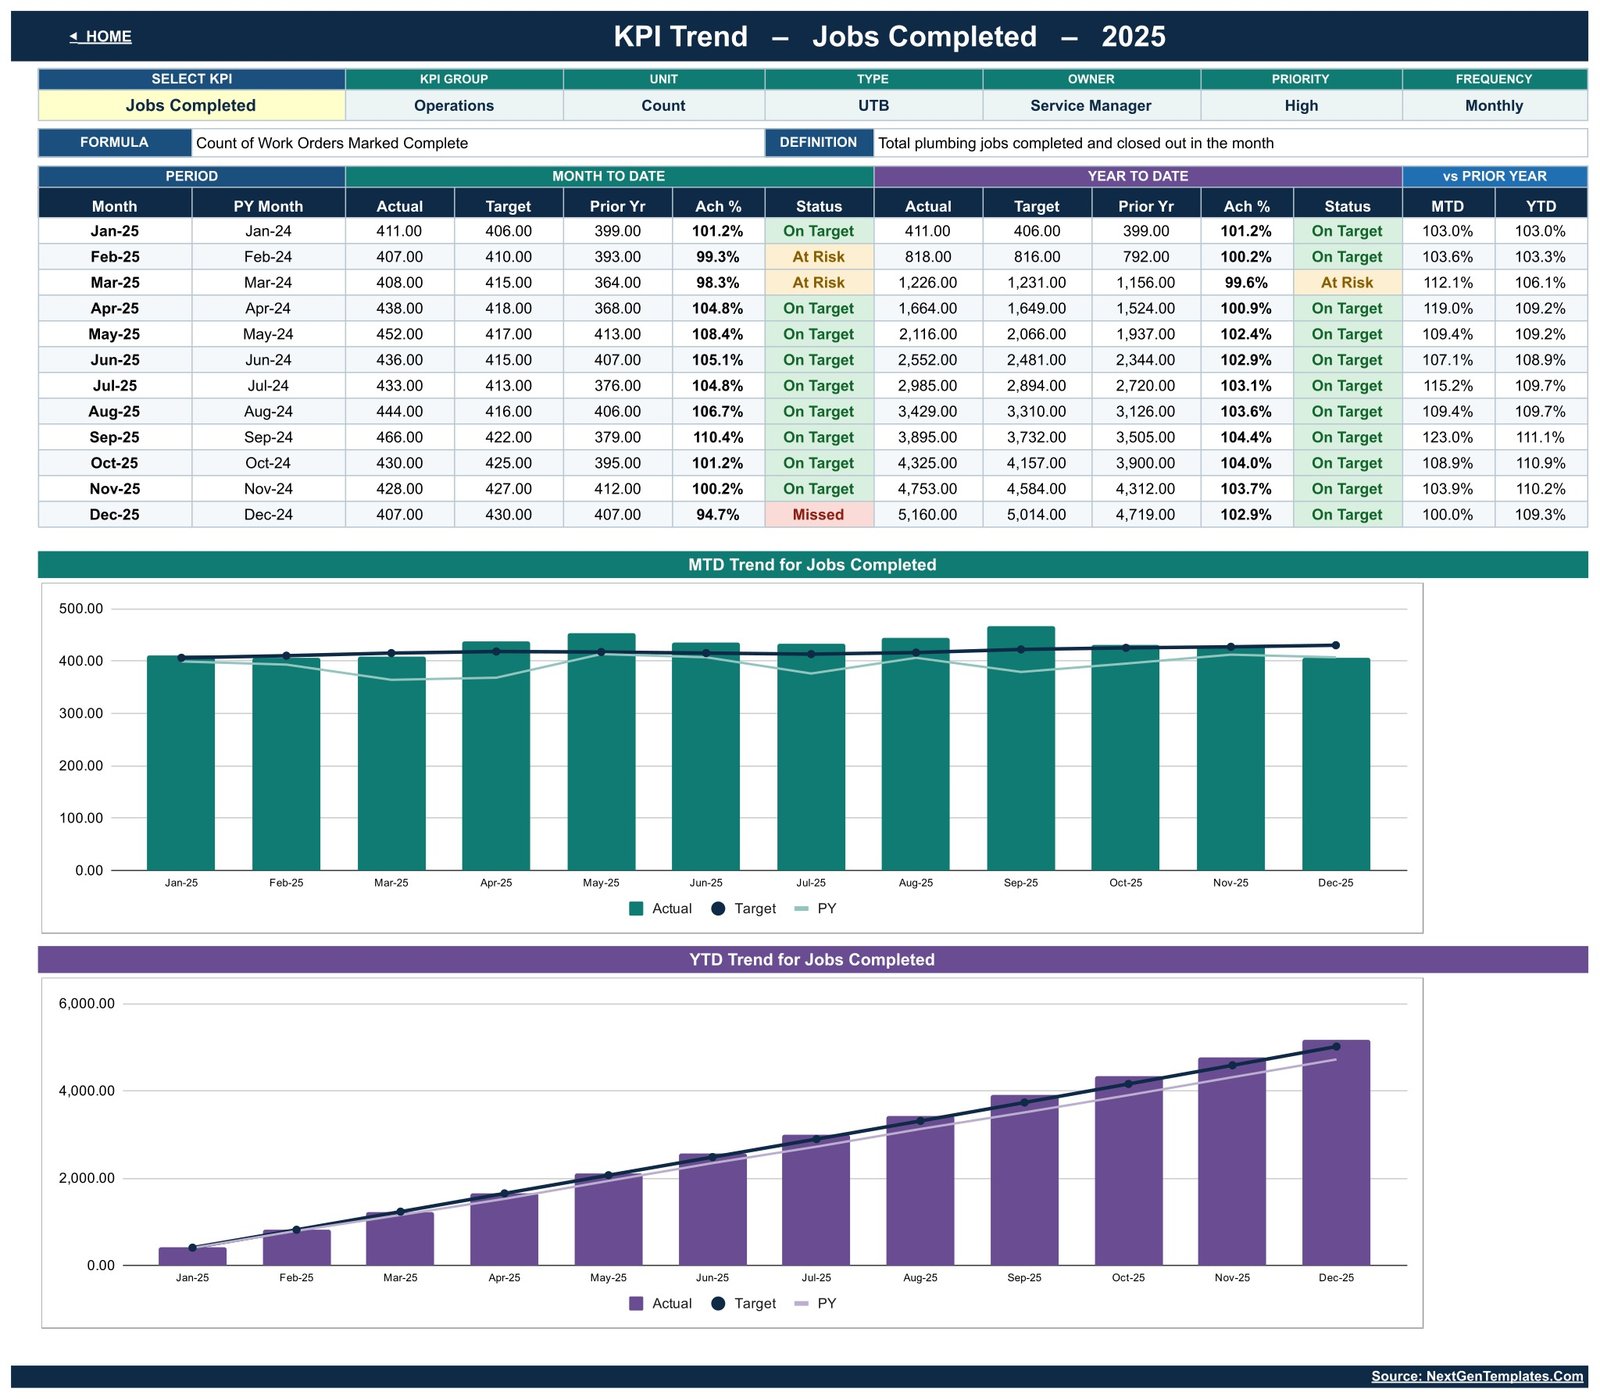
Pick a KPI from the yellow dropdown and this page shows its group, unit, type, owner, priority, frequency, formula and definition, then a twelve-row table of Jan through Dec with MTD and YTD actual, target, prior year, achievement and status, plus vs-prior-year columns. Two charts sit underneath: MTD Trend for Jobs Completed (monthly actual bars with target and prior-year lines) and YTD Trend for Jobs Completed (cumulative actual bars against target and prior-year lines). The chart titles follow whichever KPI you select.
KPI Analysis – where the problems are
Performance by KPI Group counts KPIs, On Target, At Risk and Missed per group and averages MTD and YTD achievement. Top 5 and Bottom 5 Performing KPIs (YTD) rank every KPI by achievement with its group and status. A bar chart shows Average YTD Achievement by KPI Group. A How to Read This Page box explains the ranking and the thresholds. Everything follows the month selected on the KPI Dashboard.
KPI Input – Actual, Target and PY
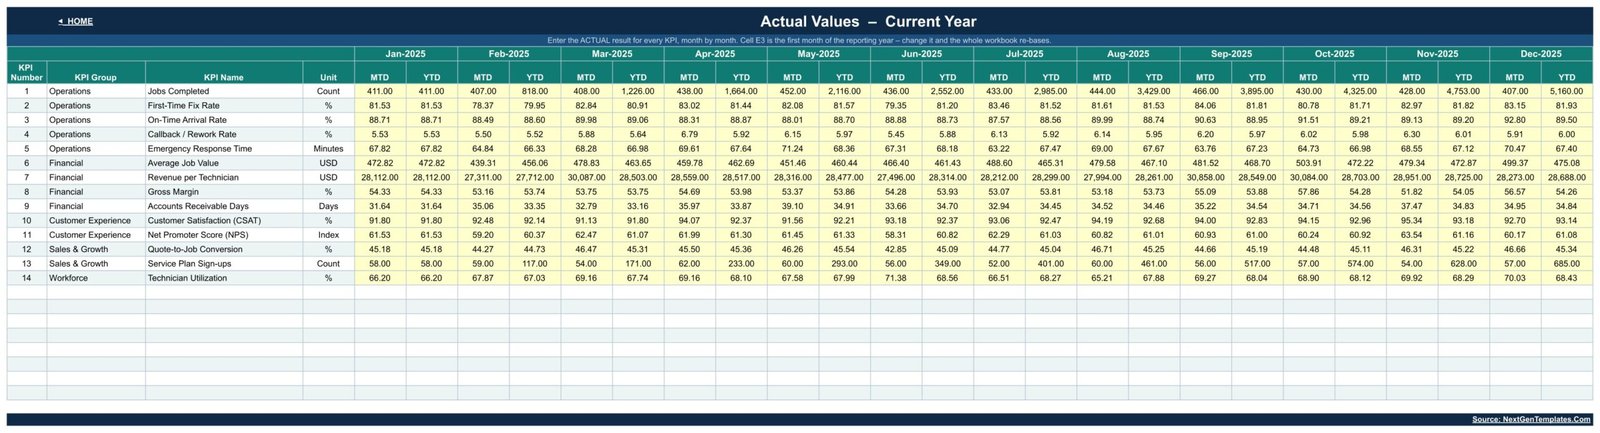
Three identical yellow grids: this year’s actual result, this year’s target, and last year’s result. Each is KPI rows down the side and Jan through Dec across the top, with MTD and YTD columns per month. Cell E3 holds the first month of the reporting year – change it and the whole workbook re-bases, so a July-to-June financial year works without touching a formula.
KPI Definition – the master list
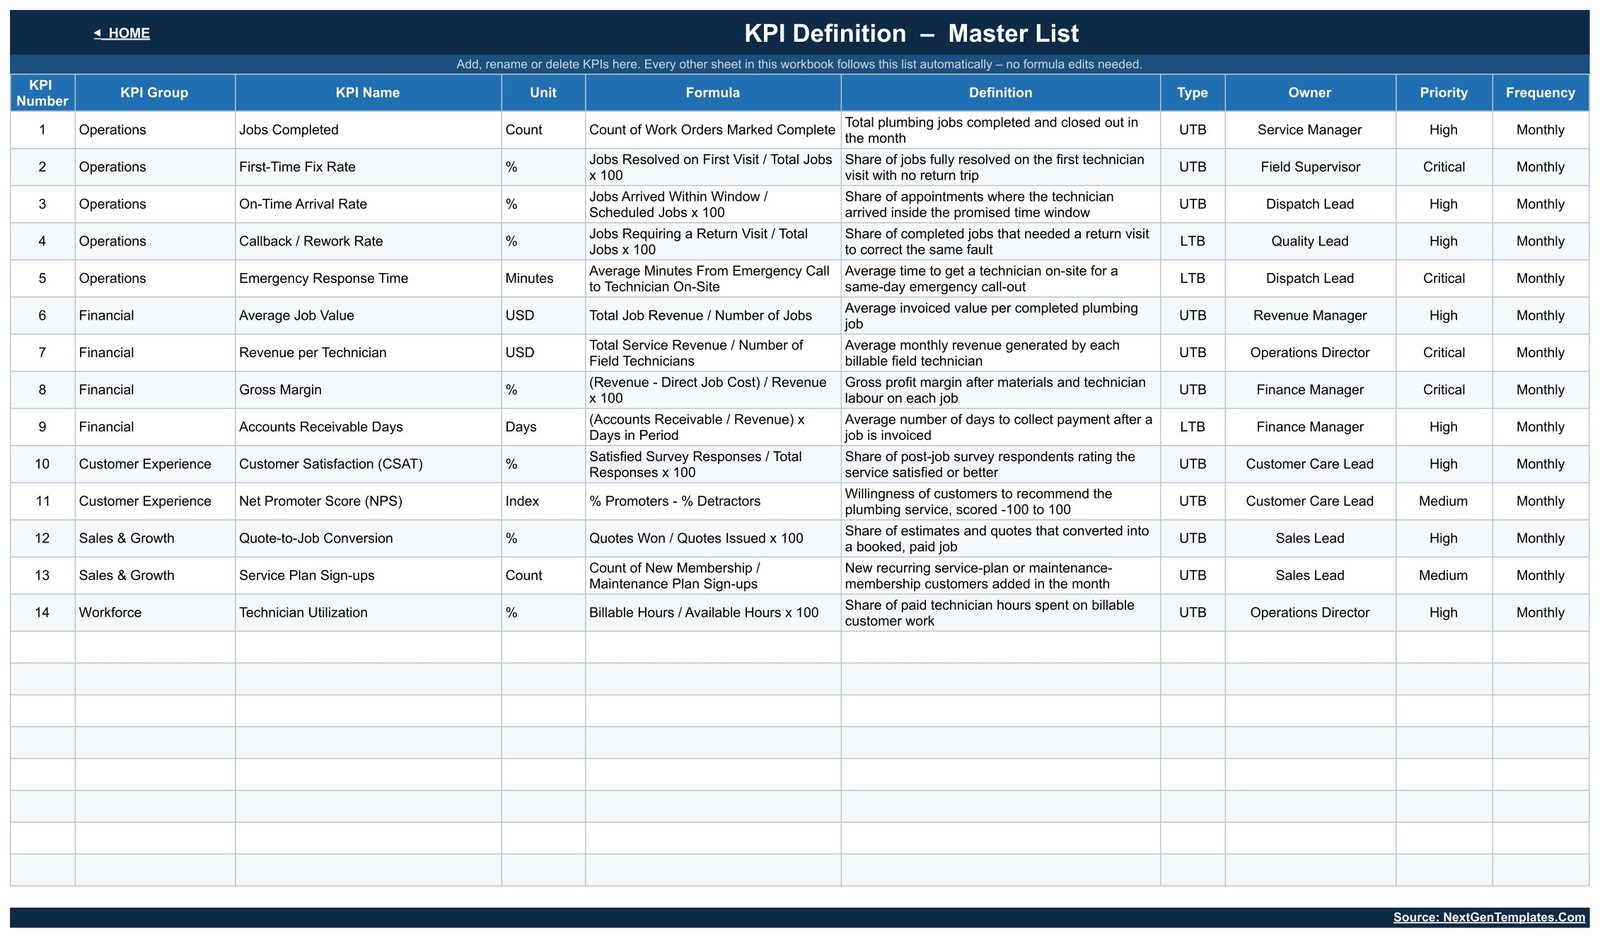
One row per KPI carrying KPI Number, Group, Name, Unit, Formula, Definition, Type, Owner, Priority and Frequency. The shipped owners are Service Manager, Field Supervisor, Dispatch Lead, Quality Lead, Revenue Manager, Operations Director, Finance Manager, Customer Care Lead and Sales Lead. Every formula is written out in plain English – for example Callback / Rework Rate is “Jobs Requiring a Return Visit / Total Jobs x 100”. Edit this sheet and the rest of the workbook follows.
A Read Me tab explains how the workbook is wired, and a Get More Templates tab links to the rest of the range.
Plumbing Business KPI Dashboard vs. Excel vs. Paid Field-Service Software – Where This Fits
| This template (Google Sheets) | The same scorecard in Excel | Paid field-service platform (ServiceTitan, Housecall Pro, Jobber) | |
|---|---|---|---|
| Cost | One-off, under $15 | One-off, under $25 | Typically $50-$400 per user per month |
| Platform | Google Sheets in a browser | Microsoft Excel desktop | Web app plus a technician mobile app |
| Setup time | Minutes – make a copy and type your numbers | Minutes – open the file | Weeks, usually with onboarding and data migration |
| Real-time team collaboration | Yes, native to Google Sheets | Only via OneDrive co-authoring | Yes |
| Mobile access | Google Sheets mobile app (read and edit) | Excel mobile app | Purpose-built technician app |
| Customisable KPIs and fields | Yes – the KPI Definition tab is the master list | Yes | Limited to what the vendor exposes |
| Share with a link | Yes | No – send the file | Yes, inside the licensed account |
| Year-1 cost at 5 users | Under $15 total | Under $25 total | Roughly $3,000-$24,000 |
| Dispatching and scheduling | No | No | Yes – that is the core of the product |
| Invoicing and payments | No | No | Yes |
| Data source | You type the monthly totals | You type the monthly totals | Captured automatically from jobs |
The honest summary: a field-service platform runs the work and produces the numbers. This template reads the numbers – it is the monthly management review that sits above whatever system you already use, including a paper diary.
Who This Template Is For – and Who It’s Not For
It is for an owner or operations manager of a plumbing company with roughly 2-40 technicians who already has the monthly figures somewhere – in a job book, an invoicing app, an accounting package – and wants one page that says which of fourteen numbers moved the wrong way this month. It suits anyone who runs a monthly review meeting and currently rebuilds the same slide by hand.
It is not for you if you want the spreadsheet to pull data automatically – it will not; you type monthly totals. It is not for job-by-job tracking: there is no work-order list, no customer table, no per-job record anywhere in the file. It is not for daily or weekly management – every KPI is defined as Monthly. And if you have never written down a target for any of these fourteen measures, expect to spend an evening deciding them before the traffic lights mean anything.
What this template does not do, stated plainly. It does not check or track licensing, permits, backflow-prevention certification, apprenticeship hours or plumbing code compliance, and nothing in it should be treated as evidence for any of those. It is not accounting or invoicing software and it does not raise, send or reconcile an invoice – Gross Margin and Accounts Receivable Days are figures you calculate elsewhere and type in. It does no dispatching and no scheduling. It ships with no safety KPI; if you add one – a recordable incident rate, for instance – it will be a number you typed, with no OSHA or regulatory calculation behind it, and it evidences nothing on its own. All sample figures in the file are invented for illustration.
How to Use the Plumbing Business KPI Dashboard in Google Sheets
- Make your own copy. Your download is a PDF containing the Google Sheets copy link. Open it, click the link, and Google creates an editable copy in your own Drive. The original stays view-only.
- Set your reporting year. On KPI Input – Actual, cell E3 is the first month of the reporting year. Change it if your year does not start in January.
- Edit the KPI list if you want to. On KPI Definition, rename, delete or add KPIs and set the Group, Unit, Type (UTB or LTB), Owner, Priority and Frequency. Every other sheet follows this list.
- Type last year’s numbers. Fill KPI Input – PY so the vs-Prior-Year columns and the trend charts have something to compare against.
- Type this year’s targets, then your actuals. KPI Input – Target and KPI Input – Actual, month by month, in the yellow cells only.
- Pick a month on KPI Dashboard and read the scorecard. Then open KPI Analysis to see which group is dragging and which five KPIs are at the bottom.
- Drill into anything red. KPI Trend, select that KPI, and read twelve months of it before deciding whether it is a trend or a bad month.
Real-World Use Cases
Daniel, owner of an 11-van residential plumbing firm
Daniel’s monthly meeting used to be a printout of the bank balance. He now types eleven numbers on the first Monday of the month and opens KPI Analysis. In the sample month the Financial group averages 96.0% YTD against Operations at 99.7%, and Accounts Receivable Days sits at the bottom of the Bottom 5 at 90.3%. That is a collections conversation, not a technician conversation – and it took him ninety seconds to find.
Priya, operations manager at a commercial plumbing contractor
Priya cares about two numbers: First-Time Fix Rate and Callback / Rework Rate. Both are on the scorecard, and Callback / Rework Rate is typed LTB, so when her team pushed it from 6.06 to 6.20 the achievement dropped to 90.0% and the light went red – the right direction of alarm for a lower-is-better measure. She uses KPI Trend on that one KPI in her supervisor one-to-ones.
A two-partner emergency call-out business
They track only six of the fourteen KPIs and deleted the rest from the KPI Definition tab. Emergency Response Time and On-Time Arrival Rate are the two they quote to commercial clients, and the twelve-month chart is what they put in front of a landlord who asked how fast they actually turn up.
Frequently Asked Questions
Is this the same as the Plumbing Business KPI Scorecard?
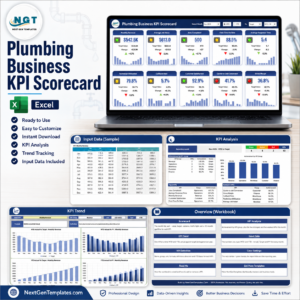
No. This is the KPI Dashboard family: a month-picker scorecard with MTD and YTD side by side, three separate input sheets (Actual, Target, Prior Year), a per-KPI KPI Trend page and a KPI Analysis roll-up. The Plumbing Business KPI Scorecard in Google Sheets and the Excel edition are a different template – KPI cards with RAG lights and a comparison-switch dropdown over a single monthly data sheet. Many people own both; neither replaces the other.
Is it the same as the Plumbing Contractor Dashboard?
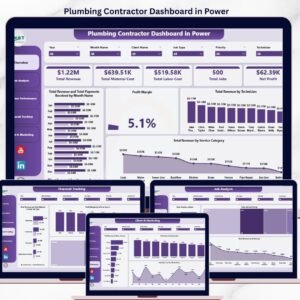
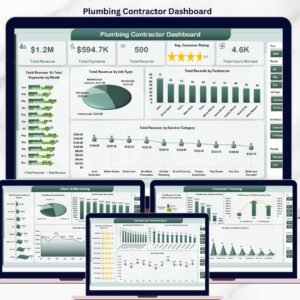
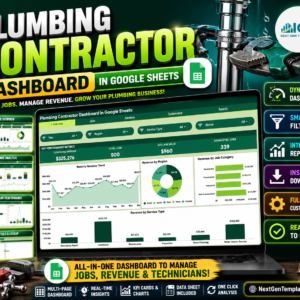
No. The Plumbing Contractor Dashboard in Google Sheets is an analytical dashboard built over a job-level data table with slicers and pivot-style charts. This file has no job-level data at all – you enter fourteen monthly totals. They answer different questions.
Does it connect to my invoicing or job-management software?
No. There is no connector, no import and no API. You type the monthly totals into three yellow sheets. That is also why it needs no add-on and no authorisation prompt.
Can I change the KPIs to my own?
Yes, and that is the intended use. The KPI Definition tab is the master list – add, rename or remove rows there, set Group and Type, and the scorecard, trend page and analysis page all follow. You are not limited to fourteen.
Can I change the On Target / At Risk / Missed thresholds?
Yes. They are written into the Status formulas on the KPI Dashboard tab – currently 100% and above for On Target, 95-99% for At Risk, below 95% for Missed. Edit the formula and the whole column follows.
Do I need Google Workspace, or does a free Gmail account work?
A free personal Google account is enough. The file uses ordinary spreadsheet formulas and built-in charts – no add-ons, no Apps Script, nothing to install or approve.
Can I use it in Excel instead?
You can download it as .xlsx from Google Sheets and most of it will carry over, but the dropdowns and formatting are built for Sheets. If Excel is your main tool, buy the Excel edition of this dashboard rather than converting this one.
About the Author
Built by PK – Microsoft Certified Professional with 15+ years of Excel, Google Sheets, and Power BI experience. Founder of NextGenTemplates, reaching 300K+ subscribers across YouTube channels. Every template is hand-built and tested before release.
Explore Related Templates
- HVAC Contractor KPI Dashboard in Google Sheets – the same dashboard structure for an HVAC service business.
- Plumbing Business KPI Scorecard in Google Sheets – the card-and-RAG-light sibling, single data sheet.
- Plumbing Contractor Dashboard in Google Sheets – job-level analytics with slicers.
- Plumbing Maintenance Checklist in Google Sheets – the task-level companion.
- Roofing Contractor KPI Scorecard in Google Sheets – for a mixed trades group.
- Browse the full Google Sheets KPI Dashboard category or every Google Sheets template.
Also available in: Microsoft Excel – Plumbing Business KPI Dashboard in Excel – and Power BI – Plumbing Business KPI Dashboard in Power BI. Same fourteen KPIs, same five groups, built natively for each tool.
Get the Plumbing Business KPI Dashboard in Google Sheets now – instant download, lifetime access, free bug fixes. Your download is a PDF holding the copy link; one click and the workbook is in your own Drive.
Watch the step-by-step video Demo:
Last updated: 26 August 2026.




























Reviews
There are no reviews yet.