

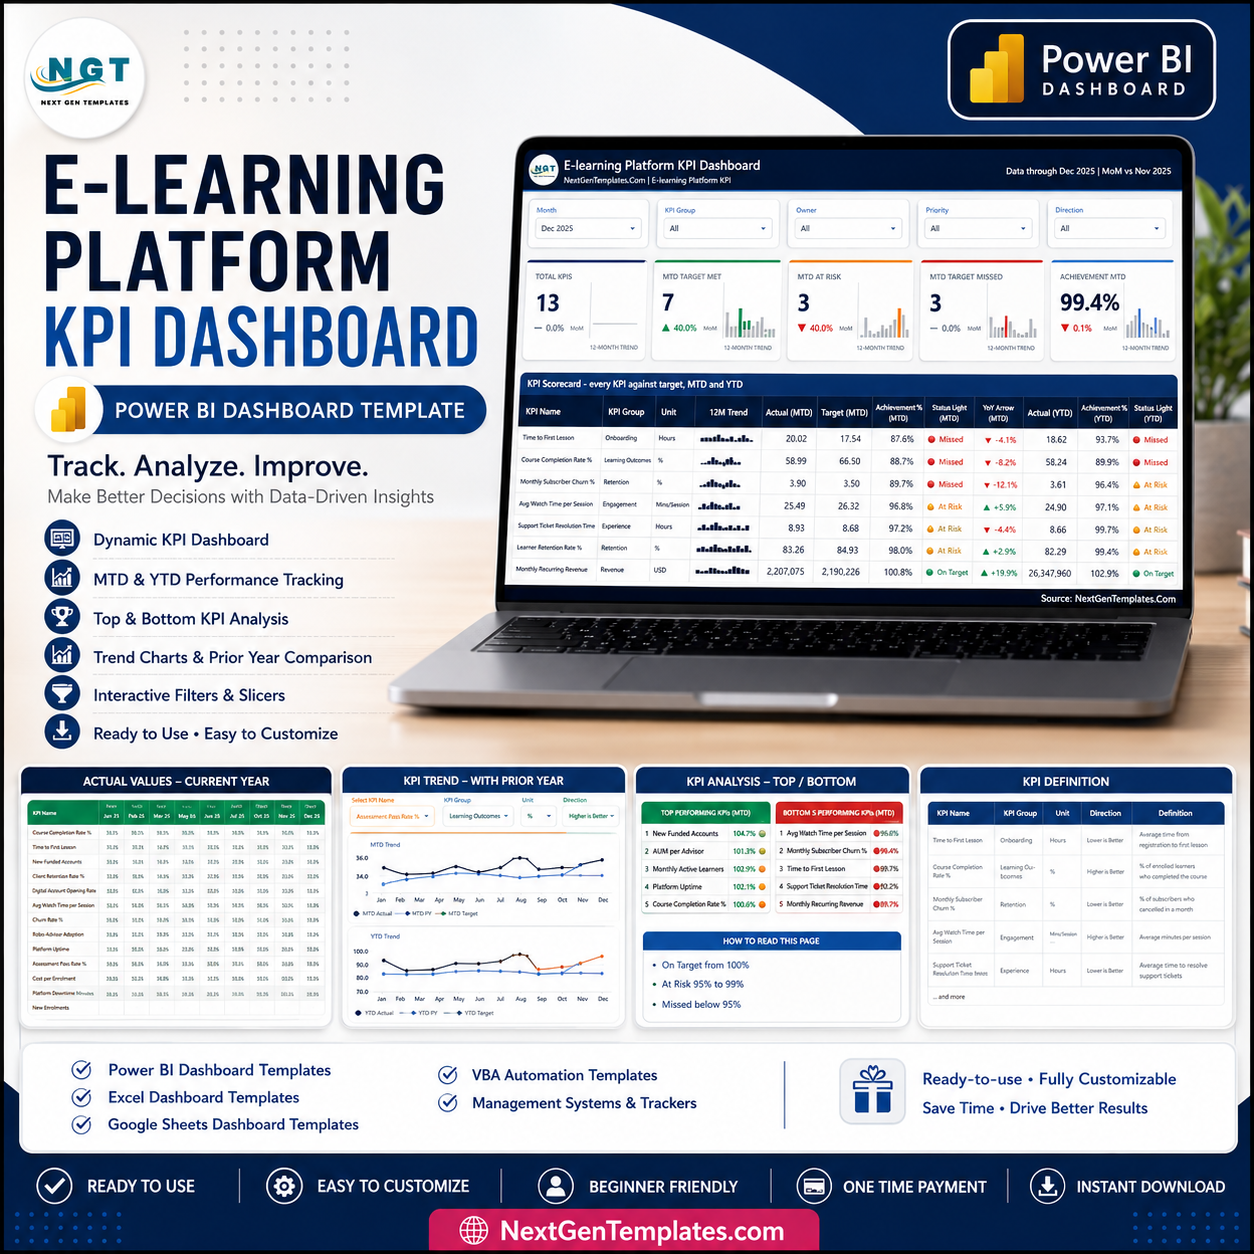
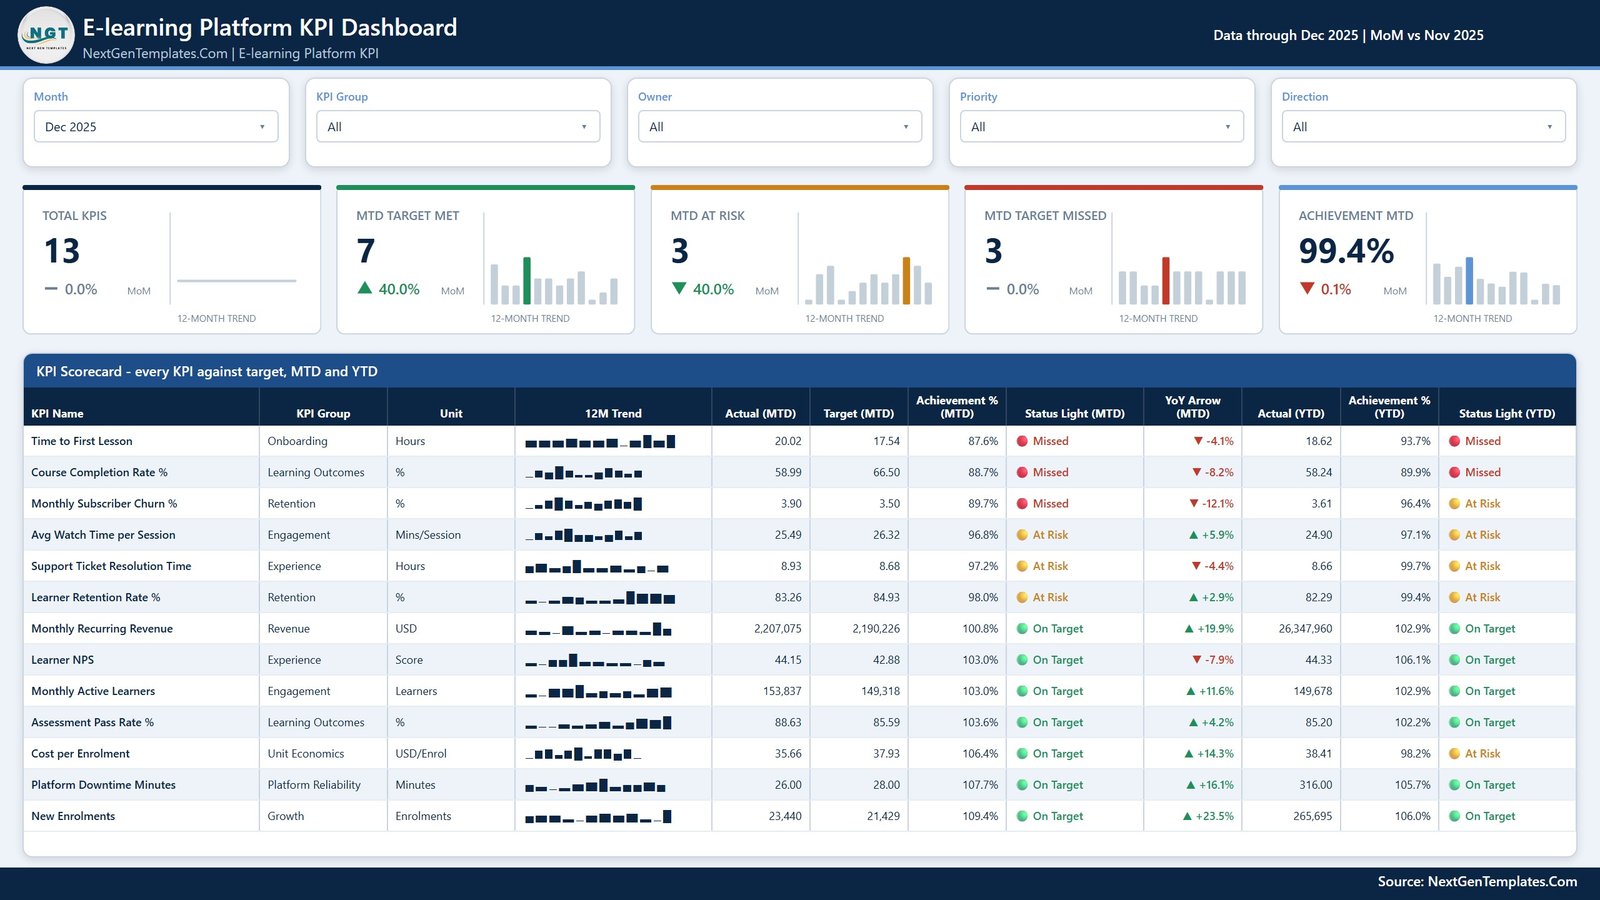
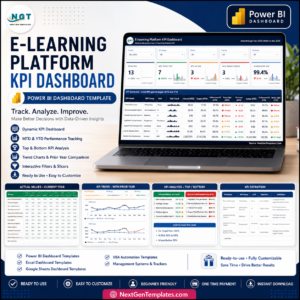
E-learning Platform KPI Dashboard in Power BI turns 13 learning, retention, revenue, onboarding, support, and reliability KPIs into a monthly scorecard with MTD and YTD tracking. The included Dec 2025 sample shows 7 KPIs on target, 3 at risk, 3 missed, and 99.4% overall MTD achievement, so you can see the traffic-light logic before replacing the demo data. Built and tested by PK, a Microsoft Certified Professional with 15+ years of analytics experience. Instant download, one-time payment, editable files, and no subscription.
Key Features of E-learning Platform KPI Dashboard in Power BI
- 13 education-platform KPIs: Monthly Active Learners, watch time, completion, assessment pass rate, retention, churn, time to first lesson, Learner NPS, support resolution time, new enrolments, monthly recurring revenue, cost per enrolment, and downtime.
- MTD and YTD scorecard: Compare actuals with your targets and prior-year values in one grid.
- Traffic-light status: On Target, At Risk, and Missed indicators respect whether higher or lower performance is better.
- Five report slicers: Filter by month, KPI group, owner, priority, and direction.
- Trend analysis: Select one KPI to compare current-year, prior-year, and target movement across 12 months.
- KPI definition view: Review the selected KPI’s formula, definition, unit, owner, priority, achievement, and monthly detail.
- Editable source workbook: Update actuals, targets, and KPI definitions in the included Data.xlsx file, then refresh Power BI.
What’s Inside the E-learning Platform KPI Dashboard in Power BI
The PBIX contains four visible pages plus two hidden tooltip pages. This is the KPI scorecard family: it is designed for recurring target review, not the broader multi-page analytical dashboard family.
1 – KPI Scorecard
The main page summarizes all 13 KPIs with Total KPIs, MTD Target Met, MTD At Risk, MTD Target Missed, and Achievement MTD cards. The scorecard adds 12-month sparklines, MTD actual and target, achievement, status, year-over-year movement, YTD actual, and YTD status.
2 – KPI Trend
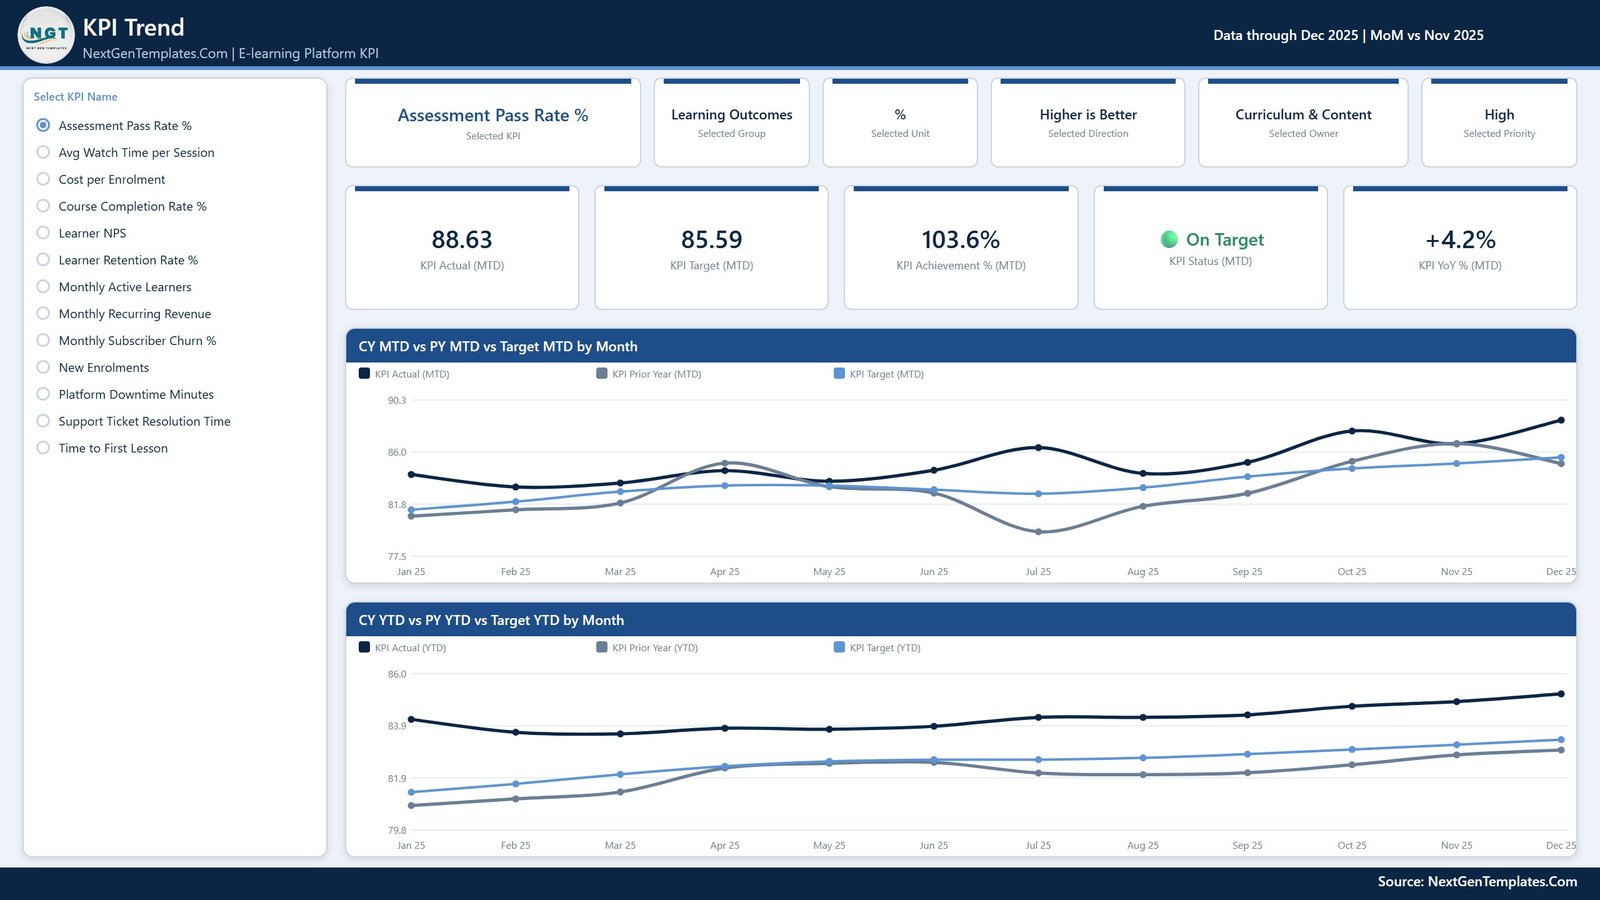
Select any KPI to see its group, unit, direction, owner, and priority alongside MTD actual, target, achievement, status, and year-over-year change. Two monthly charts compare current-year actuals with prior-year actuals and targets for both MTD and YTD views.
3 – KPI Definition
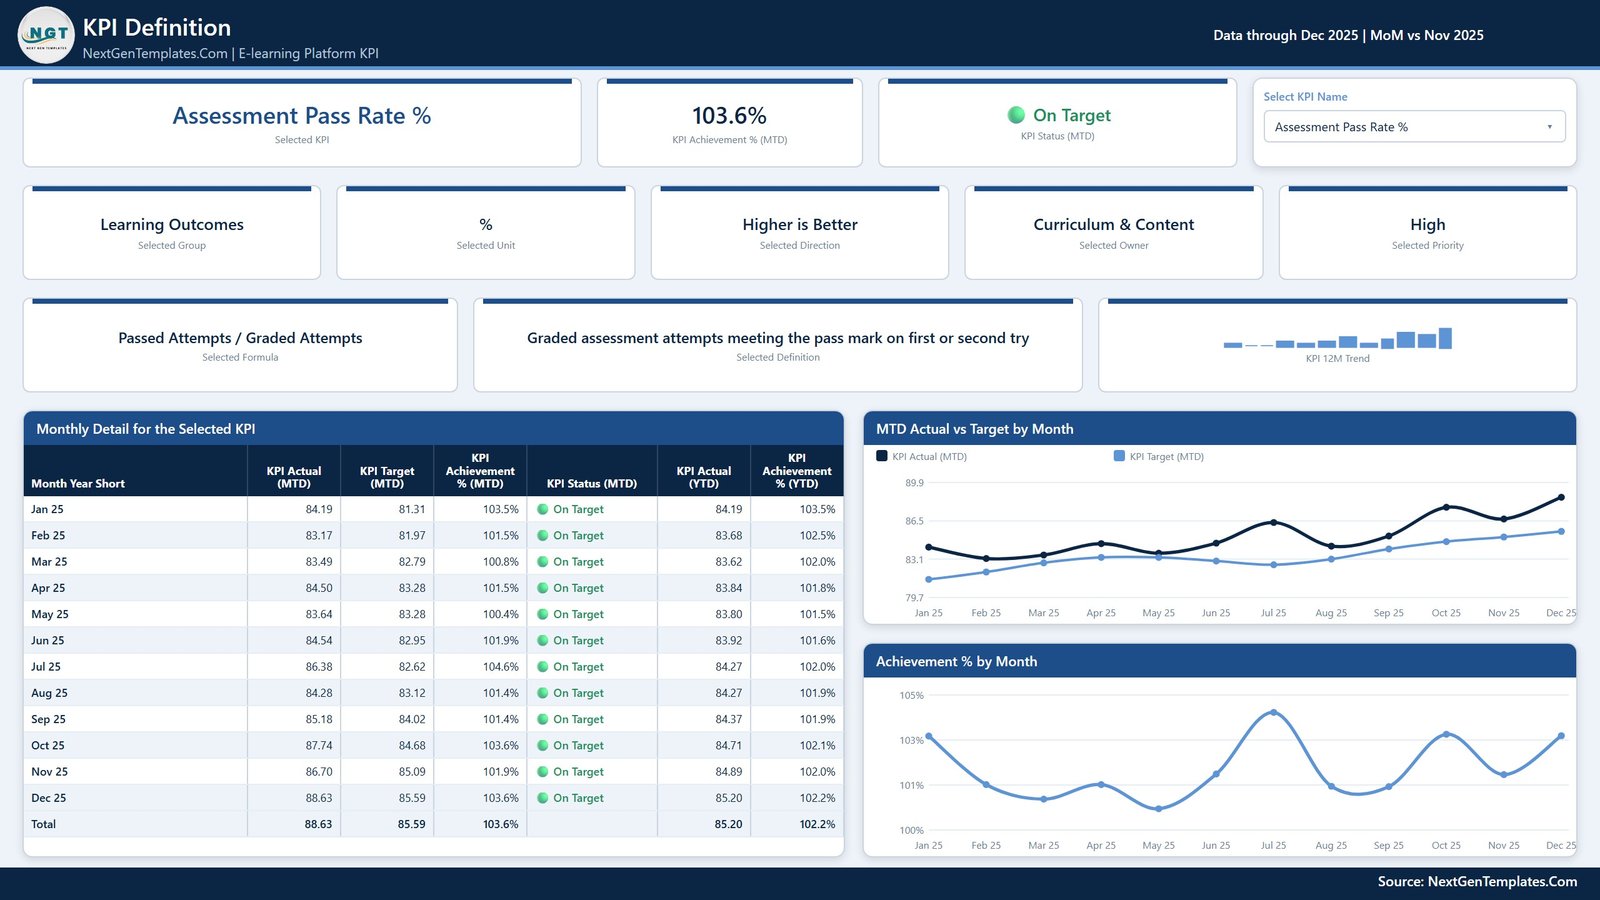
This page explains the selected KPI through its formula and plain-language definition. It also provides month-by-month actual, target, achievement, and status detail, plus Actual vs Target and Achievement % trends.
4 – Get More Templates
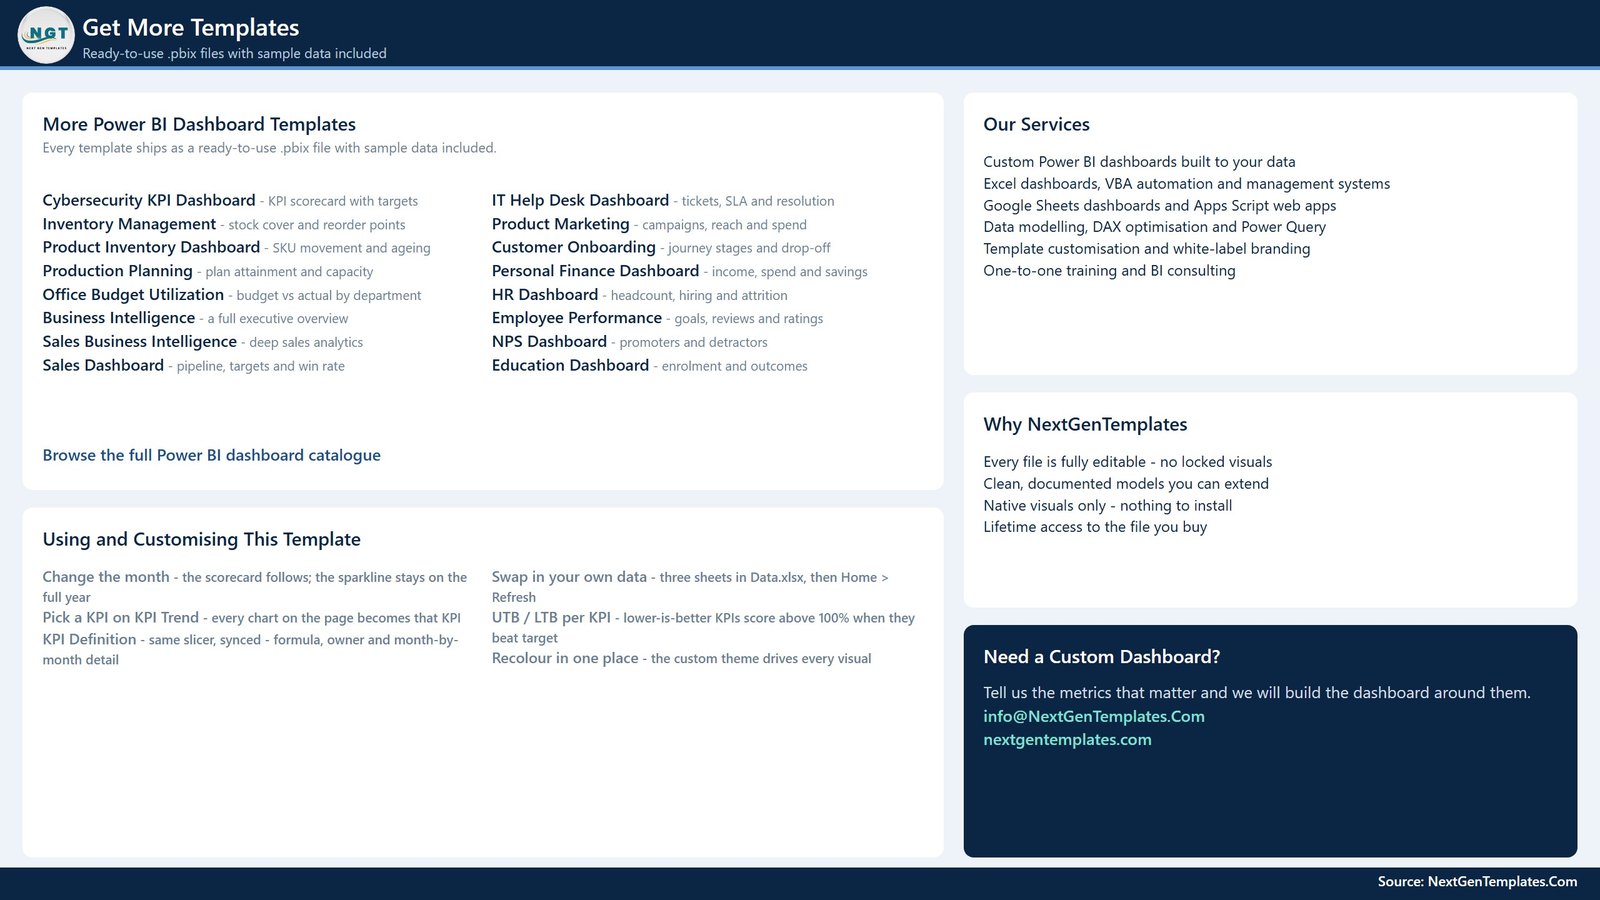
The final visible page provides built-in guidance for changing the month, replacing data, selecting KPIs, applying UTB/LTB logic, and refreshing the model. It also points users toward related dashboard templates and customization services.
E-learning Platform KPI Dashboard in Power BI vs. Excel vs. Paid LMS/SaaS – Where This Fits
| Feature | This Power BI template | Excel alternative | Paid LMS/SaaS |
|---|---|---|---|
| Cost | $12.99 sale price, one-time | One-time workbook purchase | Monthly or annual subscription |
| Platform | Power BI Desktop | Microsoft Excel | Vendor cloud platform |
| Setup | Replace structured source data and refresh | Replace cells and refresh formulas/pivots | Implementation, account setup, and integration |
| Interactive analysis | Native slicers, tooltips, cross-filtering, and drillable visuals | Workbook filters and charts | Depends on plan and vendor |
| Course hosting and learner logins | No | No | Usually included |
| Best fit | Monthly KPI review from exported or maintained data | Spreadsheet-first scorecard workflow | Operational course delivery and live workflows |
Who This Template Is For – and Who It’s Not For
It is built for e-learning founders, LMS operations teams, curriculum leads, growth marketers, learner-success managers, finance partners, and Power BI analysts who need a repeatable performance review. It is not an LMS, student portal, payment system, course player, certificate engine, or live data connector. Your team supplies the source data and chooses targets and thresholds.
How to Use the E-learning Platform KPI Dashboard in Power BI
- Download and unzip the product package.
- Keep the PBIX and Data.xlsx files together.
- Replace the sample values in the actual, target, and KPI-definition sheets while preserving the structure.
- Open the PBIX in Power BI Desktop and select Home > Refresh.
- Choose a month and use the KPI group, owner, priority, and direction slicers.
- Select a KPI on the Trend or Definition page for focused review.
- Set targets and status rules that reflect your own operating model; supplied values are examples, not benchmarks.
Real-World Use Cases
An e-learning founder reviews active learners, recurring revenue, churn, enrolments, and cost per enrolment before the monthly leadership meeting. A curriculum lead monitors completion, assessment pass rate, watch time, and retention to prioritize course-quality work. A learner-success manager follows time to first lesson, NPS, and support resolution time to identify onboarding and service friction.
Frequently Asked Questions
Does this connect directly to my LMS?
No. It ships with sample data and does not include a direct connector. Export or maintain your data in the supplied structure and refresh the PBIX.
Which software is required?
Use Microsoft Power BI Desktop to open, refresh, and edit the PBIX file. Data.xlsx can be edited in Microsoft Excel.
Are the targets industry benchmarks?
No. All sample figures, targets, and status thresholds are demonstration values. Replace them with definitions approved for your organization.
Can I change the KPI list?
Yes, but adding or renaming KPIs may also require updates to model logic and visuals. Basic Power BI knowledge is recommended for structural changes.
How many report pages are included?
There are four visible pages and two hidden tooltip pages in the PBIX.
Is this the same as a general e-learning analytics dashboard?
No. This is a KPI scorecard focused on monthly actual-versus-target and MTD/YTD status tracking. Broader analytical dashboards cover different dimensions and chart pages.
About the Author
Built by PK – Microsoft Certified Professional with 15+ years of Excel, Google Sheets, and Power BI experience. Founder of NextGenTemplates, reaching 300K+ subscribers across YouTube channels. Every template is hand-built and tested before release.
Explore Related Templates
- Read the E-learning Platform KPI Dashboard guide
- E-learning Content Services Dashboard in Power BI
- Online Certification Providers Dashboard in Power BI
- E-learning Apps Dashboard in Power BI
- Browse Power BI KPI Dashboard templates
Ready to replace manual KPI slides? Download this editable Power BI scorecard, add your learning-platform figures, and bring actual, target, prior-year, and status tracking into one review workflow.
Last updated: August 18, 2026.



Reviews
There are no reviews yet.