

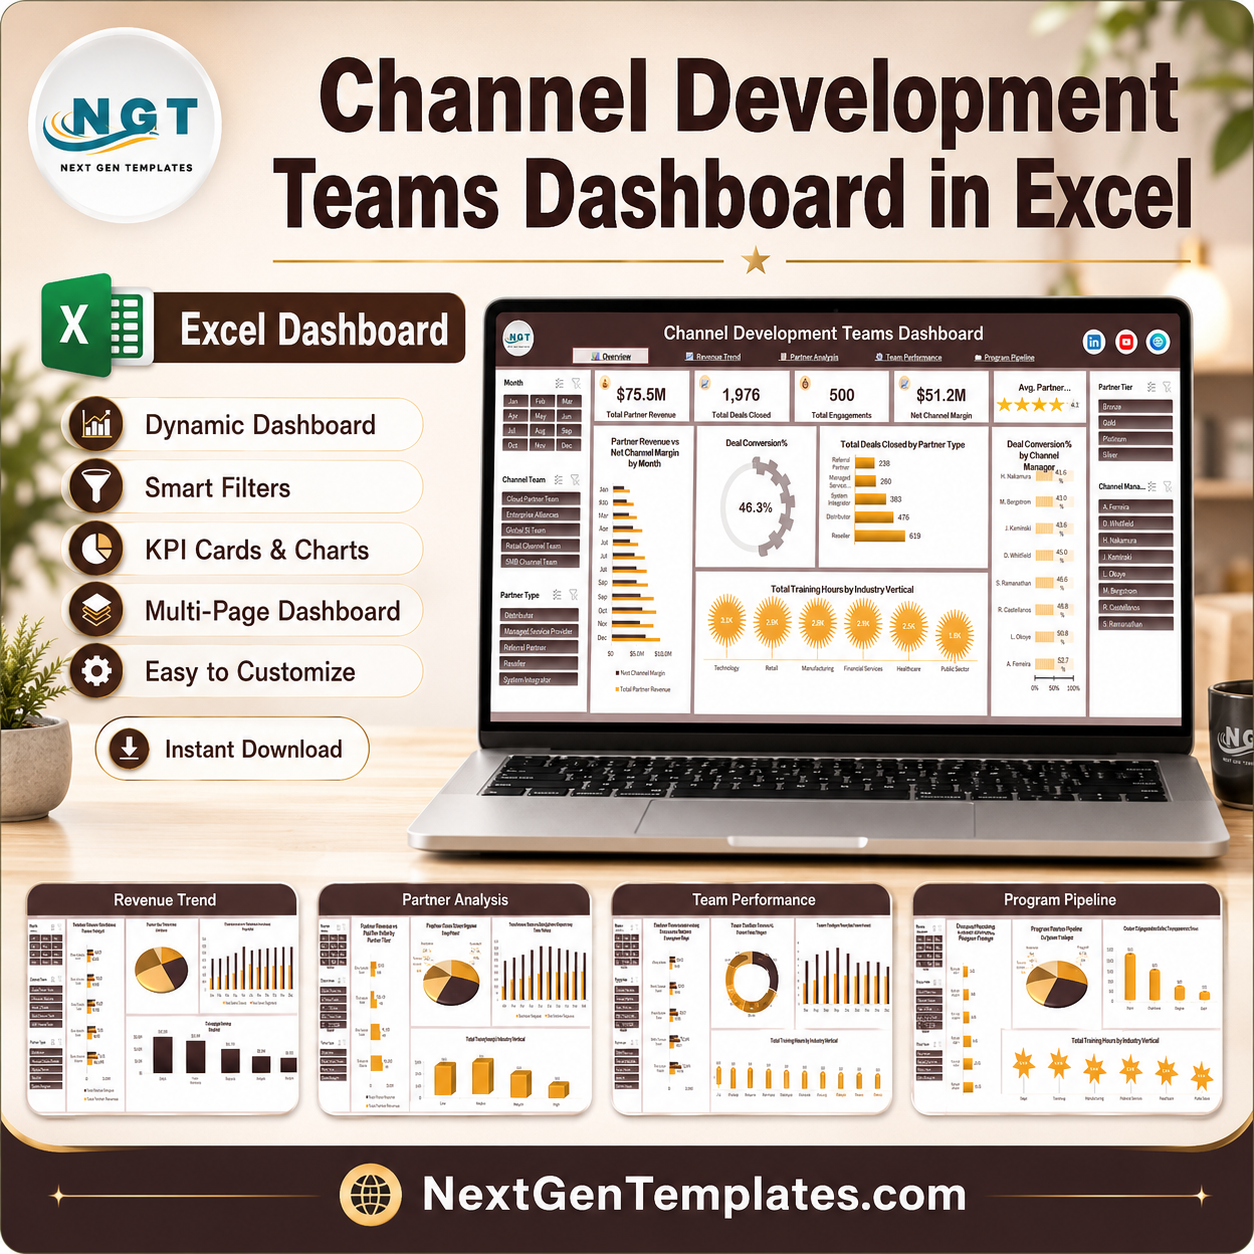
Channel businesses fail quietly. A partner tier stops registering deals, MDF keeps going out the door, a channel manager’s conversion rate slides for two quarters, and nobody notices until the annual review – because the numbers live in five different exports that nobody has time to reconcile. The Channel Development Teams Dashboard in Excel puts all of it on five pages that update the moment you paste in fresh data.
This is a plain Excel workbook. Pivot tables, pivot charts and slicers – no Power Query gymnastics, no add-ins, no macros, no monthly subscription. Drop your partner records into the data sheet, refresh, and every KPI card, chart and slicer follows.
What This Dashboard Tracks
The workbook is built around the metrics a channel organisation actually runs on: partner revenue and net channel margin, deals registered versus deals closed, deal conversion percentage, pipeline value, MDF spend, partner training hours, engagement counts and engagement status. Every one of them can be sliced by month, channel team, partner type, partner tier and channel manager without touching a formula.
Key Features
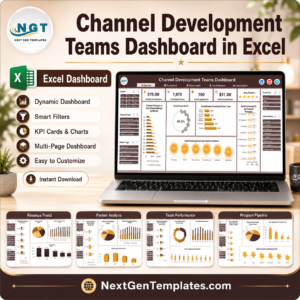
- Five linked pages with a navigation bar across the top – one click moves between Overview, Revenue Trend, Partner Analysis, Team Performance and Program Pipeline.
- Five slicers, synced across every page. Month, Channel Team, Partner Type, Partner Tier and Channel Manager. Pick Platinum partners in EMEA in Q3 and all five pages answer together.
- Four KPI cards plus an average partner rating tile on the Overview page, each one a live pivot value rather than a typed number.
- Twenty charts across the five pages, every one built on its own pivot table so the visuals never drift from the source data.
- Revenue against margin, revenue against pipeline, revenue against MDF – the three comparisons that tell you whether channel growth is actually profitable.
- Deals registered versus deals closed shown by month, by partner tier and by channel team, so a registration problem never gets mistaken for a closing problem.
- 500 rows of realistic demo data so the dashboard is fully populated the moment you open it. Replace it with your own records and refresh.
- No macros, no add-ins. The file opens without a security warning and works on locked-down corporate machines.
Inside the Dashboard
Overview
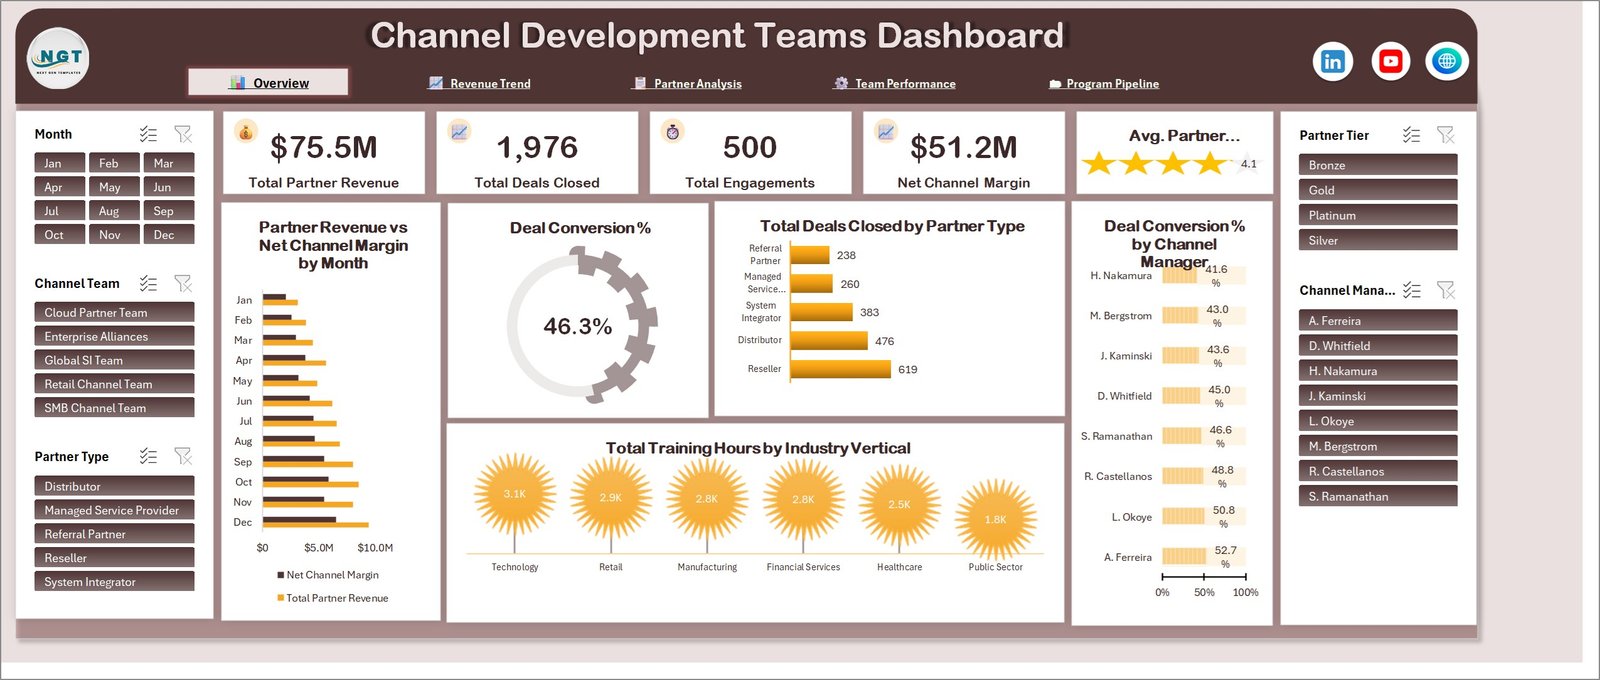
The landing page. Four KPI cards carry Total Partner Revenue, Total Deals Closed, Total Engagements and Net Channel Margin, with an average partner rating tile beside them. Below sit Partner Revenue vs Net Channel Margin by Month, a Deal Conversion % dial, Total Deals Closed by Partner Type ranking Reseller, Distributor, System Integrator, Managed Service Provider and Referral Partner, Deal Conversion % by Channel Manager ordered lowest to highest, and Total Training Hours by Industry Vertical.
Revenue Trend
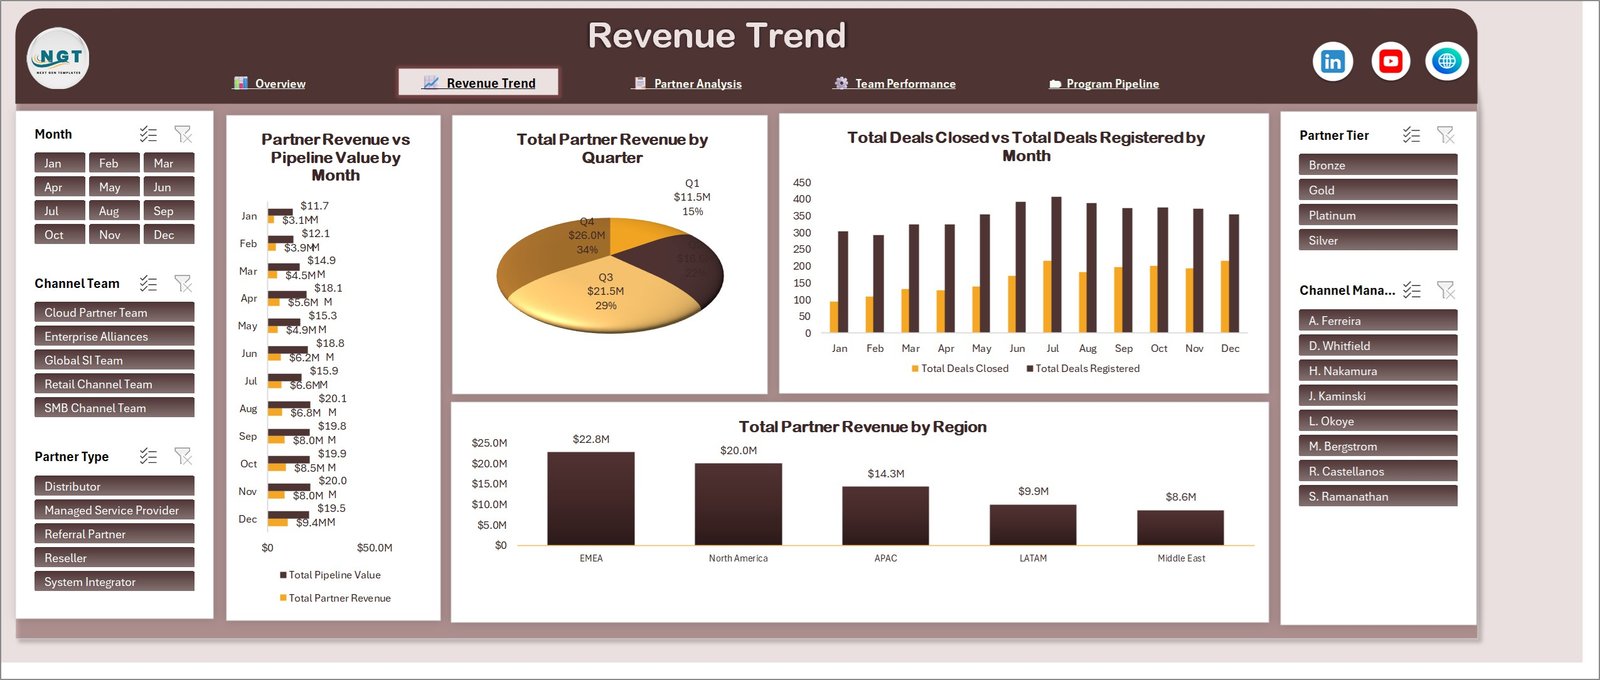
Where the money is going and when. Partner Revenue vs Pipeline Value by Month puts the two side by side for all twelve months, Total Partner Revenue by Quarter shows how the year is weighted, Total Deals Closed vs Total Deals Registered by Month exposes the gap between registration and close, and Total Partner Revenue by Region ranks EMEA, North America, APAC, LATAM and Middle East.
Partner Analysis
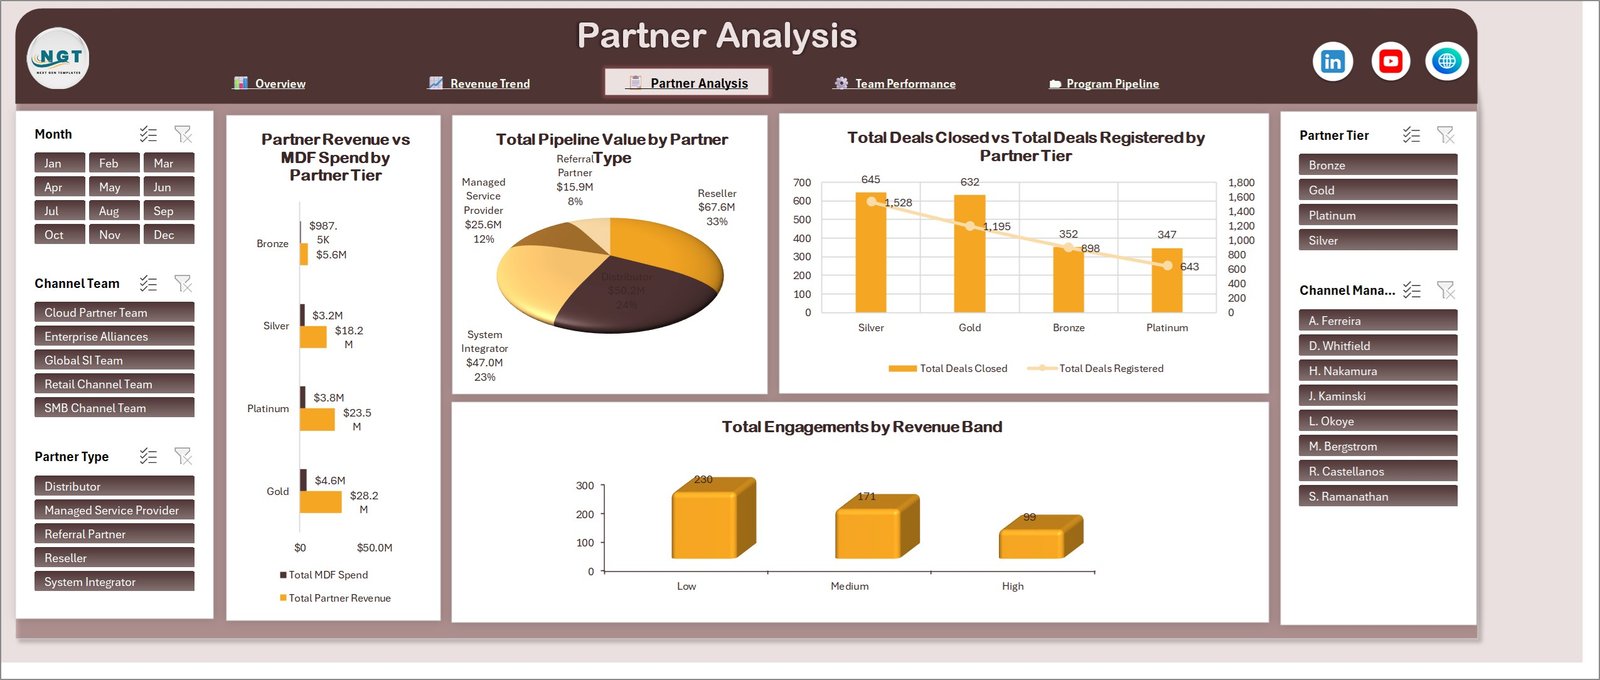
The tier and partner-type view. Partner Revenue vs MDF Spend by Partner Tier sets what each tier returns against what it costs, across Bronze, Silver, Gold and Platinum. Total Pipeline Value by Partner Type shows where future revenue is concentrated. Total Deals Closed vs Total Deals Registered by Partner Tier compares volume and follow-through per tier, and Total Engagements by Revenue Band splits activity into Low, Medium and High bands.
Team Performance
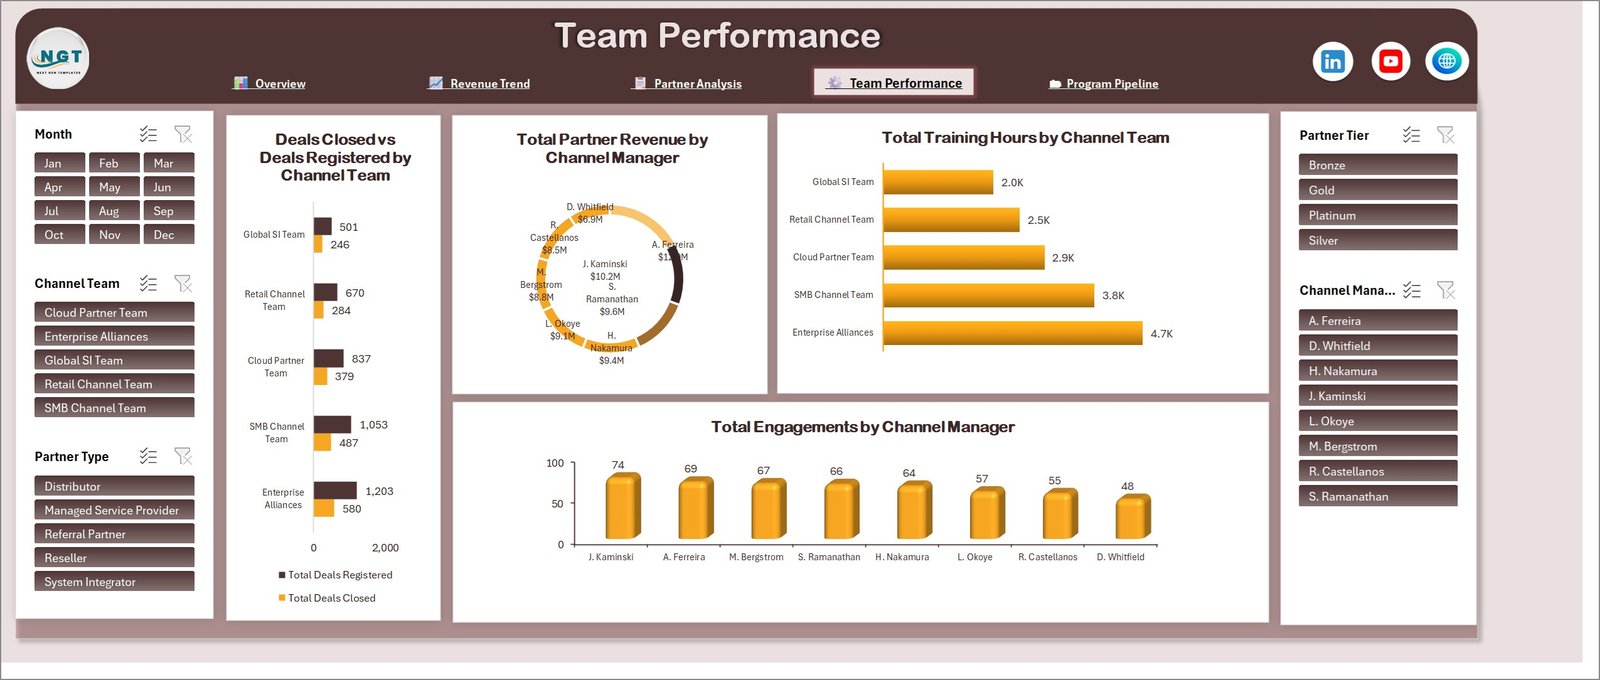
Your internal side of the channel. Deals Closed vs Deals Registered by Channel Team covers Global SI Team, Retail Channel Team, Cloud Partner Team, SMB Channel Team and Enterprise Alliances. Total Partner Revenue by Channel Manager ranks the eight managers, Total Training Hours by Channel Team shows where enablement effort went, and Total Engagements by Channel Manager gives the activity count behind the revenue.
Program Pipeline
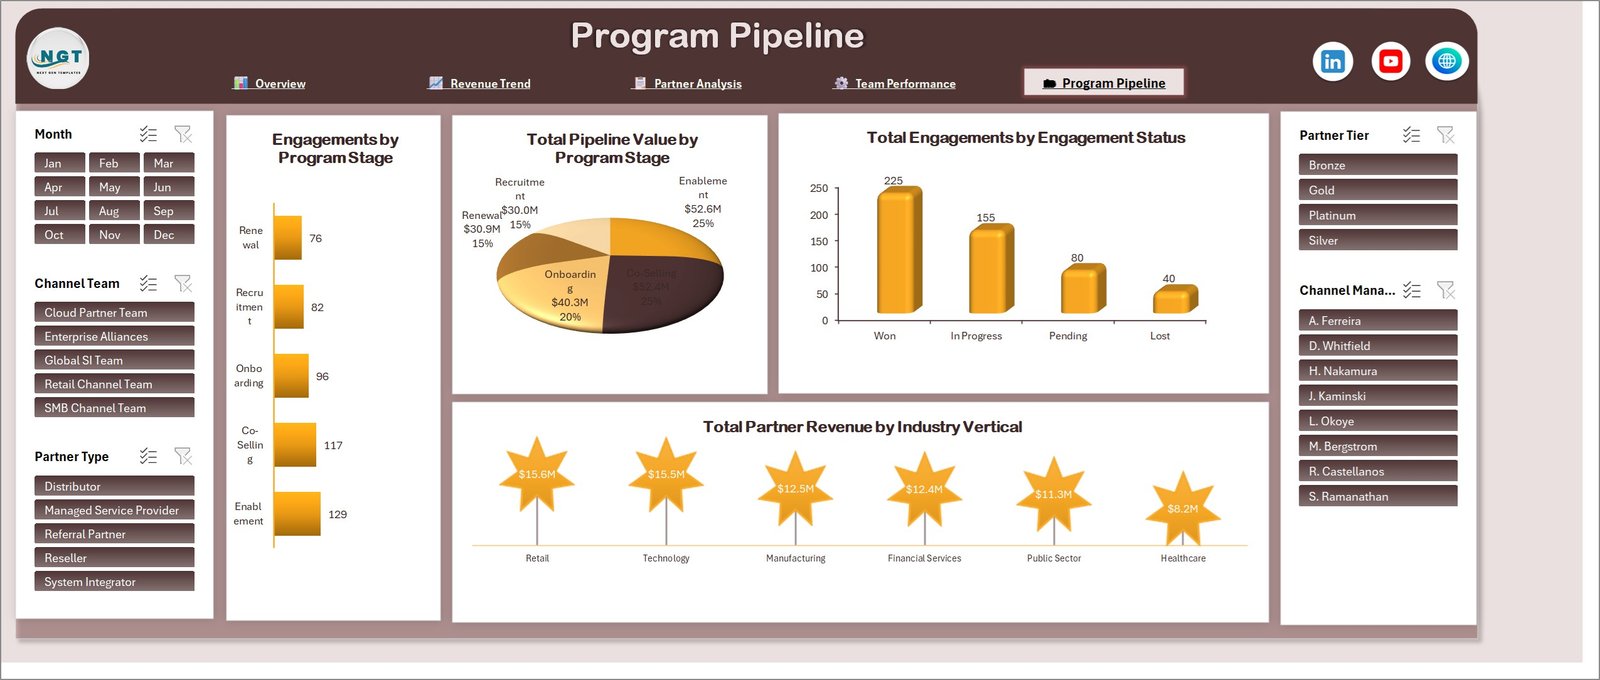
The partner lifecycle. Engagements by Program Stage counts activity across Recruitment, Onboarding, Enablement, Co-Selling and Renewal, Total Pipeline Value by Program Stage attaches money to each of those stages, Total Engagements by Engagement Status splits Won, In Progress, Pending and Lost, and Total Partner Revenue by Industry Vertical ranks Retail, Technology, Manufacturing, Financial Services, Public Sector and Healthcare.
How It Compares
| This dashboard | A spreadsheet of exports | A channel module in your PRM | |
|---|---|---|---|
| Setup time | Paste data, refresh | Rebuilt every month | Weeks of configuration |
| Cost | One-time purchase | Free, but hours of work | Per-seat, per-month |
| Cross-filtering | Five synced slicers on every page | Manual filters, page by page | Yes, if licensed |
| Revenue vs MDF view | Built in by tier | Build it yourself | Often an add-on report |
| Works offline | Yes | Yes | No |
| You own the file | Yes, edit anything | Yes | No |
Who It Is For
- Channel and partner development managers running a reseller, distributor or SI network
- Alliance and partnership leads reporting quarterly to a leadership team
- Partner marketing managers who need to defend MDF spend with numbers
- Sales operations analysts asked to produce a channel pack every month
- Consultants and agencies building channel reporting for a client
How to Use It
- Download the ZIP and extract the Excel workbook.
- Open the data sheet and replace the 500 demo rows with your own partner records, keeping the column headers as they are.
- Press Ctrl + Alt + F5 (Data > Refresh All) to push your data through every pivot table.
- Use the navigation bar to move between the five pages.
- Click any slicer to filter – all five pages follow the same selection.
- Save under your own name and it is ready for the next reporting cycle.
What You Get
- One Excel workbook (.xlsx) containing all five dashboard pages, the data sheet and the supporting pivot tables
- 500 rows of demo data covering a full twelve-month year
- Fully editable charts, colours, labels and layout
- Instant download after purchase, with lifetime access to the file
Frequently Asked Questions
Do I need Power BI, Power Query or any add-in?
No. This is a standard Excel workbook using native pivot tables, pivot charts and slicers. Nothing to install.
Are there macros in the file?
No. The workbook is a plain .xlsx, so it opens without a macro security prompt and runs on managed corporate machines.
Which versions of Excel does it work with?
Excel 2016, 2019, 2021, 2024 and Microsoft 365, on Windows and Mac. Slicers need a desktop version of Excel – they do not filter in Excel for the web or on mobile.
Is the data in the screenshots real?
No. Every figure you see – the partner names, the revenue, the conversion percentages – is randomly generated demo data included so the dashboard looks complete before you add your own. Delete it and paste in yours.
Can I add my own partner tiers, regions or program stages?
Yes. The tiers, types, regions, teams and stages are simply values in the data sheet. Type your own, refresh, and the slicers and charts pick them up.
Can I change the colours to match our brand?
Yes. Nothing is locked. Select any chart, card or shape and restyle it as you would in any Excel file.
Does this connect to my CRM or PRM?
No. It is an offline workbook – you export your partner data and paste it in. That is deliberate: it means no integration project, no IT approval and no data leaving your machine.
Can I use it for client work?
Yes, for your own business or your clients’ reporting. You may not resell or redistribute the template file itself.
Also Available in Power BI
The same five-page channel model is available as a Power BI report if your team already reports in Power BI: Channel Development Teams Dashboard in Power BI.
Related Excel Dashboards
- MarTech Dashboard in Excel
- Marketing Analytics Dashboard in Excel
- Sales Business Intelligence Report in Excel
- Civil Rights Organizations Dashboard in Excel
- Climate Tech Startups Dashboard in Excel
- Cloud Gaming Dashboard in Excel
Browse the full library at Excel Dashboards.




























Reviews
There are no reviews yet.