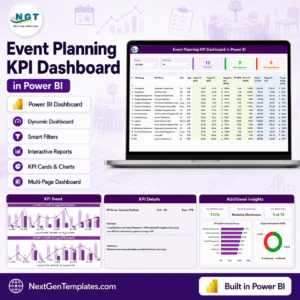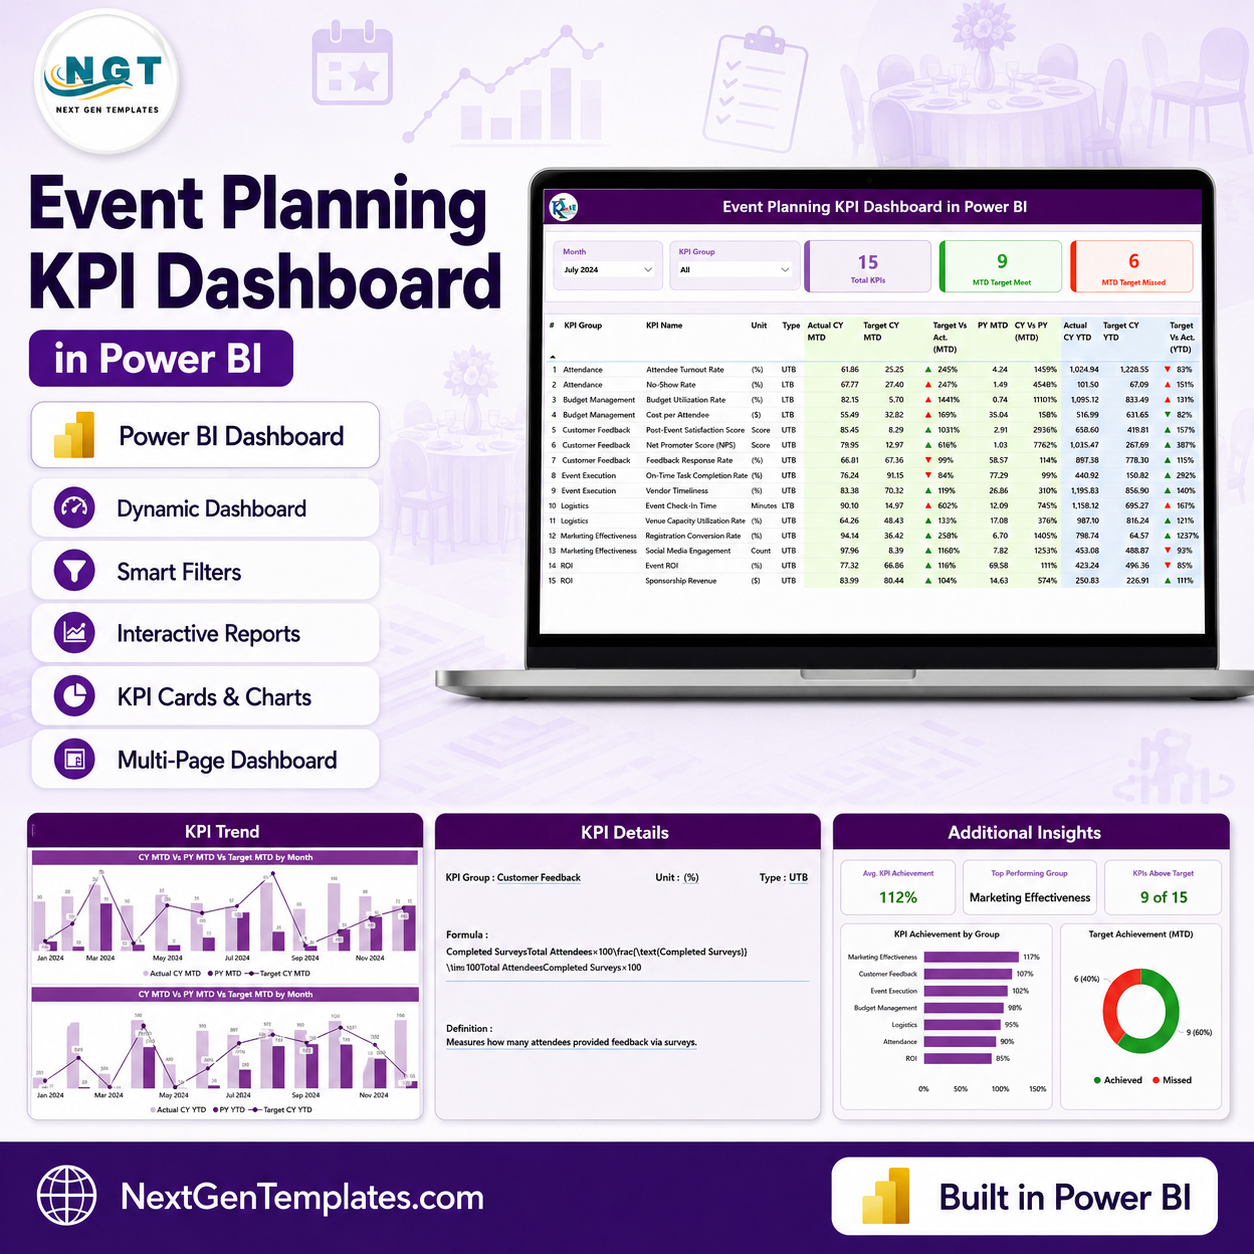
The Event Planning KPI Dashboard in Power BI helps event managers monitor event performance with 3 Power BI report pages, 3 Excel input worksheets, and a KPI table covering 17 performance fields across MTD and YTD views. Built by a Microsoft Certified Professional with 15+ years of Excel and Power BI experience and backed by the PK-AnExcelExpert audience of 300K+ subscribers, this template is ready to edit, refresh, and reuse. Instant download, lifetime access, and free minor updates reduce the risk of starting from a blank Power BI file.
Summary Page
Key Features of Event Planning KPI Dashboard in Power BI
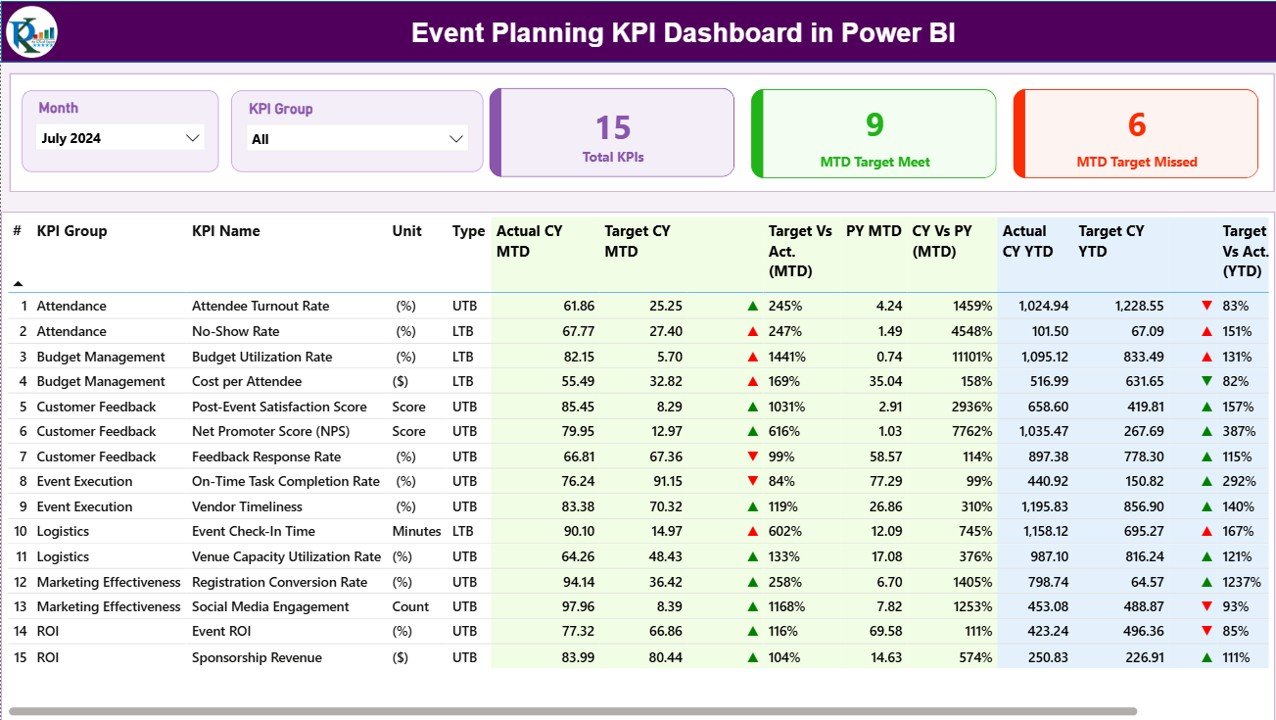
- Summary page for monthly KPI review. Month and KPI Group slicers sit at the top, followed by KPI count, MTD target met count, and MTD target missed count cards.
- Detailed KPI performance table. Review KPI Number, KPI Group, KPI Name, Unit, KPI Type, CY MTD Actual, CY MTD Target, PY MTD, CY YTD Actual, CY YTD Target, PY YTD, and variance percentages in one structured view.
- MTD and YTD status indicators. Red and green up/down icons show whether each KPI is meeting target based on UTB (Upper the Better) or LTB (Lower the Better) logic.
- KPI Trend page. Two combo charts compare current-year actuals, previous-year values, and targets for both MTD and YTD numbers.
- Hidden KPI Definition drillthrough page. Right-click from the Summary page to see each KPI formula and definition without crowding the main dashboard.
- Excel-based data source. Update actual numbers, target numbers, and KPI definitions in the included Excel file, then refresh Power BI.
What’s Inside the Event Planning KPI Dashboard in Power BI
1. Summary Page
This is the main page of the dashboard. Use the Month and KPI Group slicers to narrow the analysis, then read the three cards for Total KPI Count, MTD Target Met Count, and MTD Target Missed Count. The detailed table gives a clean KPI-by-KPI view, including Actual CY MTD, Target CY MTD, Target vs Actual (MTD), PY MTD, CY vs PY (MTD), Actual CY YTD, Target CY YTD, Target vs Actual (YTD), PY YTD, and CY vs PY (YTD).
2. KPI Trend Page
The KPI Trend page shows two combo charts for the selected KPI: one for MTD and one for YTD. Each chart compares current-year actuals, previous-year actuals, and target values so event teams can see whether performance is improving, slipping, or moving away from plan.
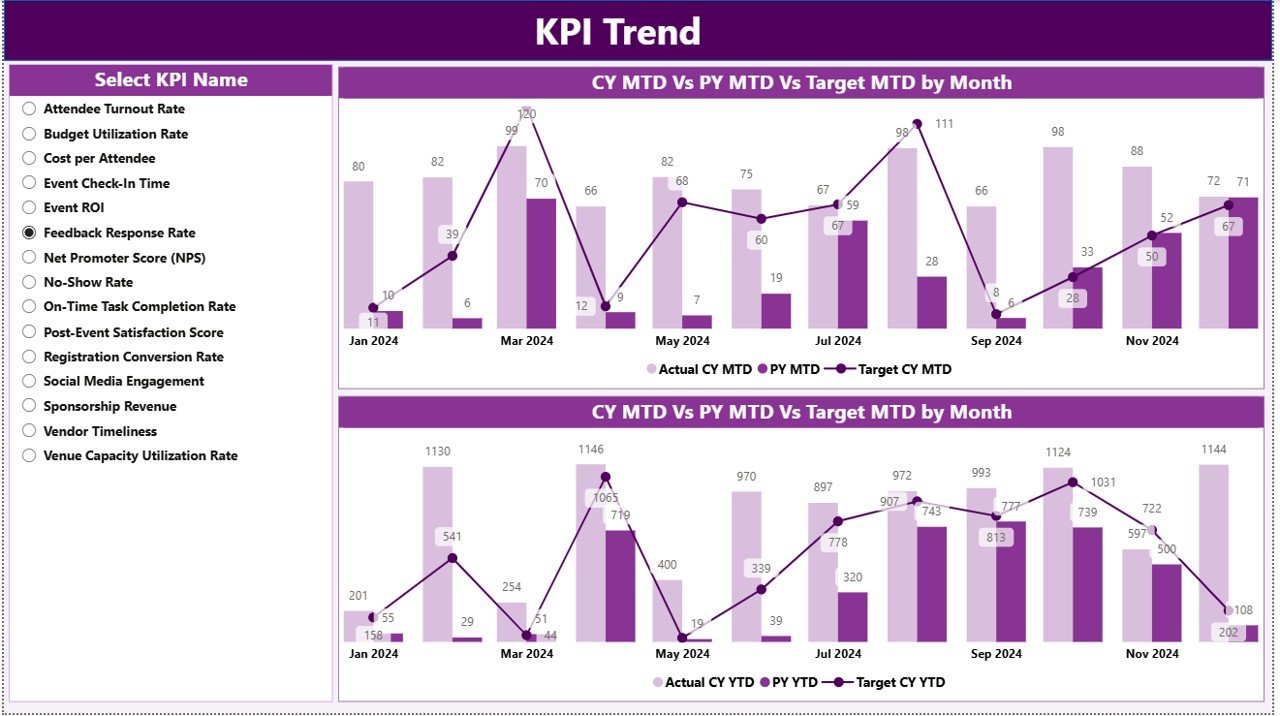
KPI Trend Page
3. KPI Definition Page
The KPI Definition page is a hidden drillthrough page. From the Summary page, drill through to check the KPI formula, definition, unit, group, and KPI type. A back button on the top-left corner returns users to the main page.
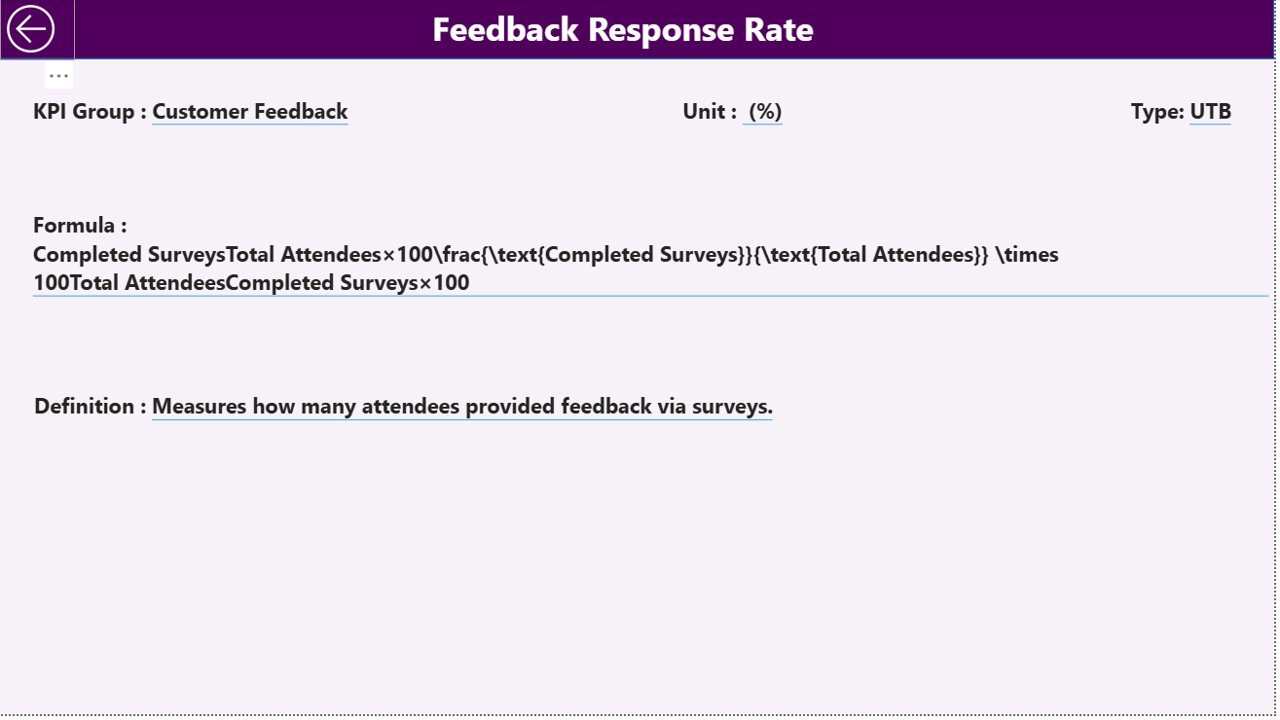
KPI Definition Page
Excel Data File
The dashboard uses an Excel file as its data source. Fill Input_Actual with KPI Name, Month, MTD number, and YTD number. Fill Input_Target with KPI Name, Month, MTD target, and YTD target. Fill KPI Definition with KPI Number, KPI Group, KPI Name, Unit, Formula, Definition, and Type (LTB or UTB).
Event Planning KPI Dashboard in Power BI vs. Tableau vs. Paid Event Management SaaS – Where This Fits
| Feature | This Power BI dashboard | Tableau alternative | Paid event management SaaS |
|---|---|---|---|
| Cost | $11.99 sale price | Requires Tableau setup and licensing | Recurring subscription |
| Platform | Power BI Desktop and Power BI Service | Tableau Desktop / Cloud | Vendor web platform |
| Setup time | Update Excel inputs and refresh | Build data model and visuals | Onboarding and configuration |
| Real-time team collaboration | Available after publishing to Power BI Service | Available through Tableau Cloud | Usually included |
| Mobile access | Power BI mobile app when published | Tableau mobile options | Usually included |
| Customizable fields | Edit Excel inputs, Power Query, DAX, and report visuals | Fully customizable with Tableau skills | Limited by vendor fields |
| Share with link | Yes, through Power BI Service | Yes, through Tableau Cloud | Yes |
| Year-1 cost at 5 users | $11.99 plus Power BI access if publishing | Licensing and build time | Often hundreds or thousands annually |
| KPI definition drillthrough | Included | Must be built | Depends on plan |
Who This Template Is For – and Who It’s Not For
This dashboard is ideal for event planners, event operations managers, conference coordinators, venue teams, agency account managers, finance analysts, and business owners who need a monthly KPI review format for event performance.
It is not a ticketing platform, registration app, floor-plan tool, payment system, vendor portal, or live event check-in system. Use it as a reporting layer after your event data has been captured in Excel, CSV, CRM, or event software exports.
How to Use the Event Planning KPI Dashboard in Power BI
- Download and unzip the file.
- Open the .pbix file in Power BI Desktop.
- Open the Excel data source and replace sample values in Input_Actual, Input_Target, and KPI Definition.
- Use the first date of each month in the Month field.
- Keep KPI names consistent across Actual, Target, and Definition sheets.
- Refresh the Power BI report.
- Use Month and KPI Group slicers to review performance.
- Drill through from Summary to KPI Definition when you need formula details.
Real-World Use Cases
An event operations manager uses the Summary page after every month-end close to see which KPIs met MTD targets and which missed them.
A conference finance analyst reviews YTD target variance and CY vs PY movement before the quarterly leadership meeting.
An event agency account lead filters KPI Group to client-facing metrics and uses the KPI Trend page to explain performance movement with current-year, target, and previous-year context.
Frequently Asked Questions
Do I need Power BI Desktop?
Yes. The template is designed for Power BI Desktop. Power BI Desktop is free from Microsoft.
What data source does the dashboard use?
It uses an Excel file with Input_Actual, Input_Target, and KPI Definition worksheets.
Can I add my own event KPIs?
Yes. Add the KPI to the definition sheet and keep the KPI name consistent in the actual and target input sheets.
What do LTB and UTB mean?
LTB means Lower the Better, and UTB means Upper the Better. The dashboard uses this logic to interpret KPI status icons.
Can I publish this report online?
Yes, you can publish it to the Power BI Service if you have the required Microsoft account and licensing.
Does it replace event management software?
No. It is a KPI reporting dashboard, not a registration, ticketing, check-in, or payment system.
About the Author
Built by PK – Microsoft Certified Professional with 15+ years of Excel, Google Sheets, and Power BI experience. Founder of NextGenTemplates, reaching 300K+ subscribers across YouTube channels. Every template is hand-built and tested before release.
Explore Related Templates
- Power BI templates
- Power BI KPI Dashboard templates
- Event Management Dashboard in Power BI
- Project Management KPI Dashboard in Power BI
- Marketing KPI Dashboard in Power BI
Add the Event Planning KPI Dashboard in Power BI to your reporting toolkit today. Download the file, update the Excel inputs, refresh Power BI, and review event KPIs without rebuilding the report from scratch.
Last updated: 15 August 2026.