

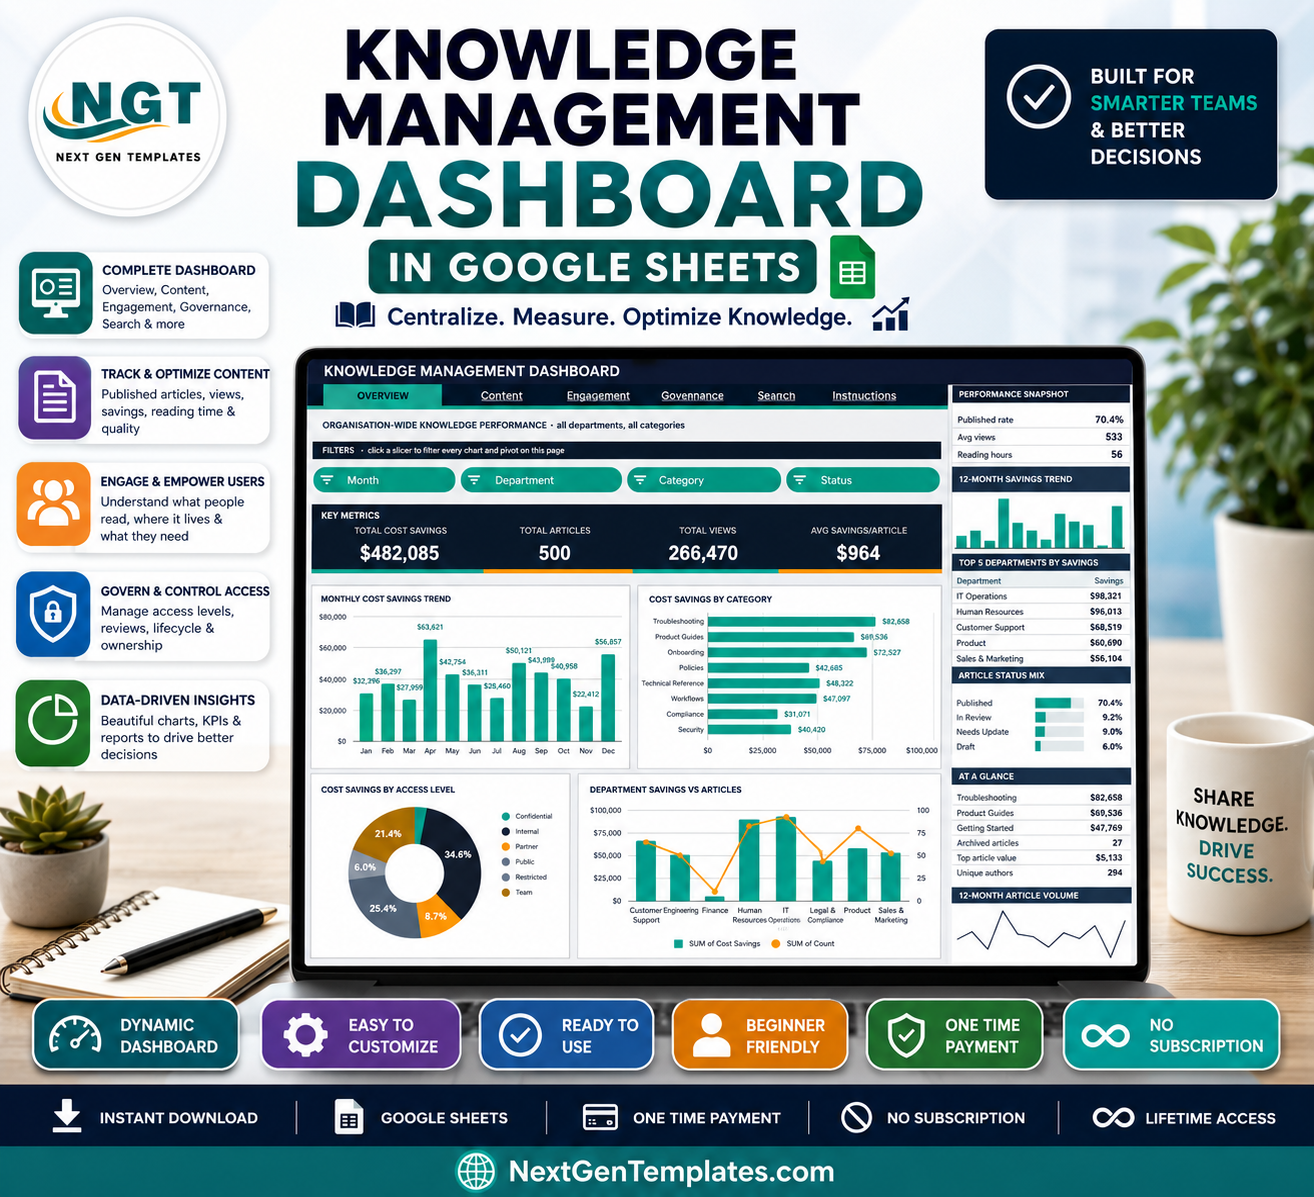

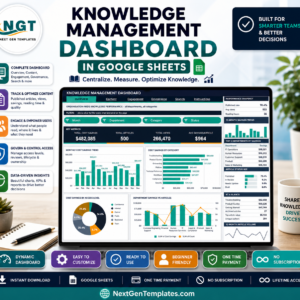
The Knowledge Management Dashboard in Google Sheets tracks 16 KPI cards and 16 slicer-driven charts across 6 tabs, built on 500 sample knowledge base articles spanning 8 departments, 9 categories, 8 content types and 6 source systems. Setup takes under 10 minutes: paste your own article export over the Data sheet and every pivot, chart and Top 5 panel redraws itself.
🌍 Join 10,000+ customers in 180+ countries using NextGenTemplates to replace paid SaaS tools with one-time-purchase Excel, Google Sheets, Power BI and HTML templates.
✅ Instant download · One-time payment · No subscription · No per-user fees · Lifetime access
🔑 Key Features of the Knowledge Management Dashboard in Google Sheets
- 📊 16 KPI cards across four analysis pages. The dashboard tracks Total Cost Savings, Total Articles, Total Views, Avg Savings per Article, Published Articles, Reading Hours, FAQ Views, How-To Guide Views, Avg Read Time, Restricted Articles, Needs Update, Unique Authors and Archived Rate. In the sample data that reads $482,085 saved across 500 articles and 266,470 views.
- 🧩 Native pivot tables and slicers — no helper formulas. Every chart reads a real Google Sheets pivot table parked to the right of its page. Click any slicer in the FILTERS strip and all four charts plus the sidebar Top 5 panel refilter together, so the workbook stays fast as the article library grows.
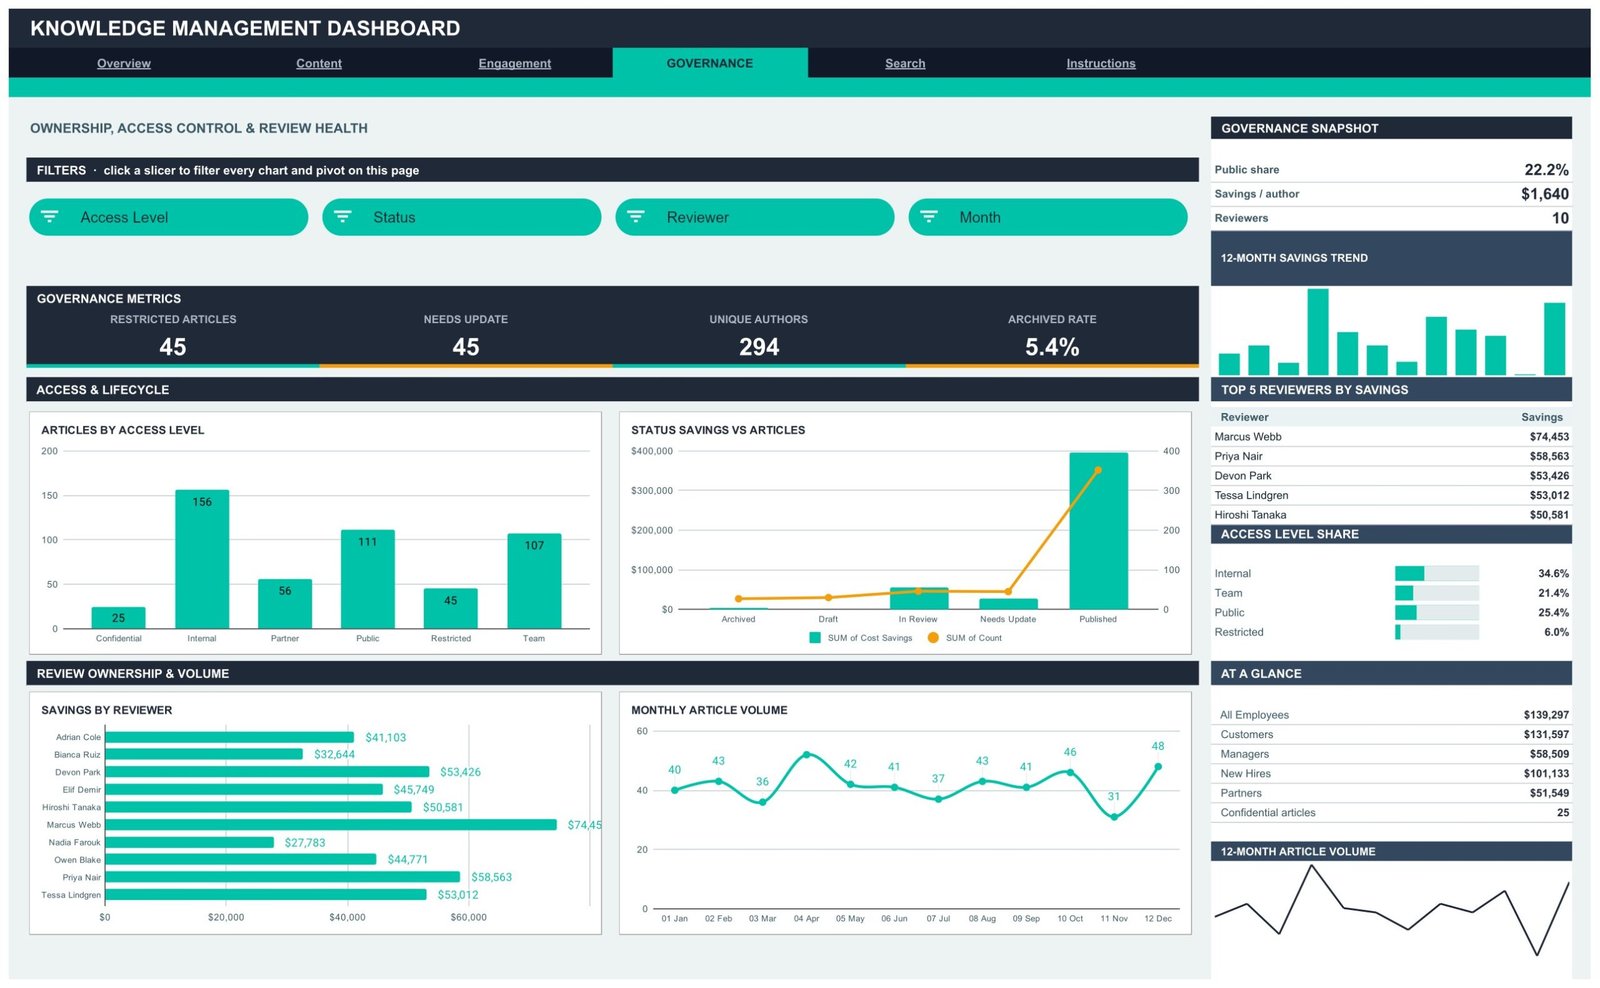
- 🎛️ 16 slicers, four per analysis page. Overview filters by Month, Department, Category and Status. Content filters by Department, Content Type, Month and Access Level. Engagement filters by Content Type, Category, Audience and Source. Governance filters by Access Level, Status, Reviewer and Month.
- 💰 A built-in cost-savings model. Cost Savings is the support cost avoided when a reader self-serves an article instead of raising a ticket. Replace the per-article value with whatever your team assigns to a deflected request and every savings chart, Top 5 list and snapshot recalculates.
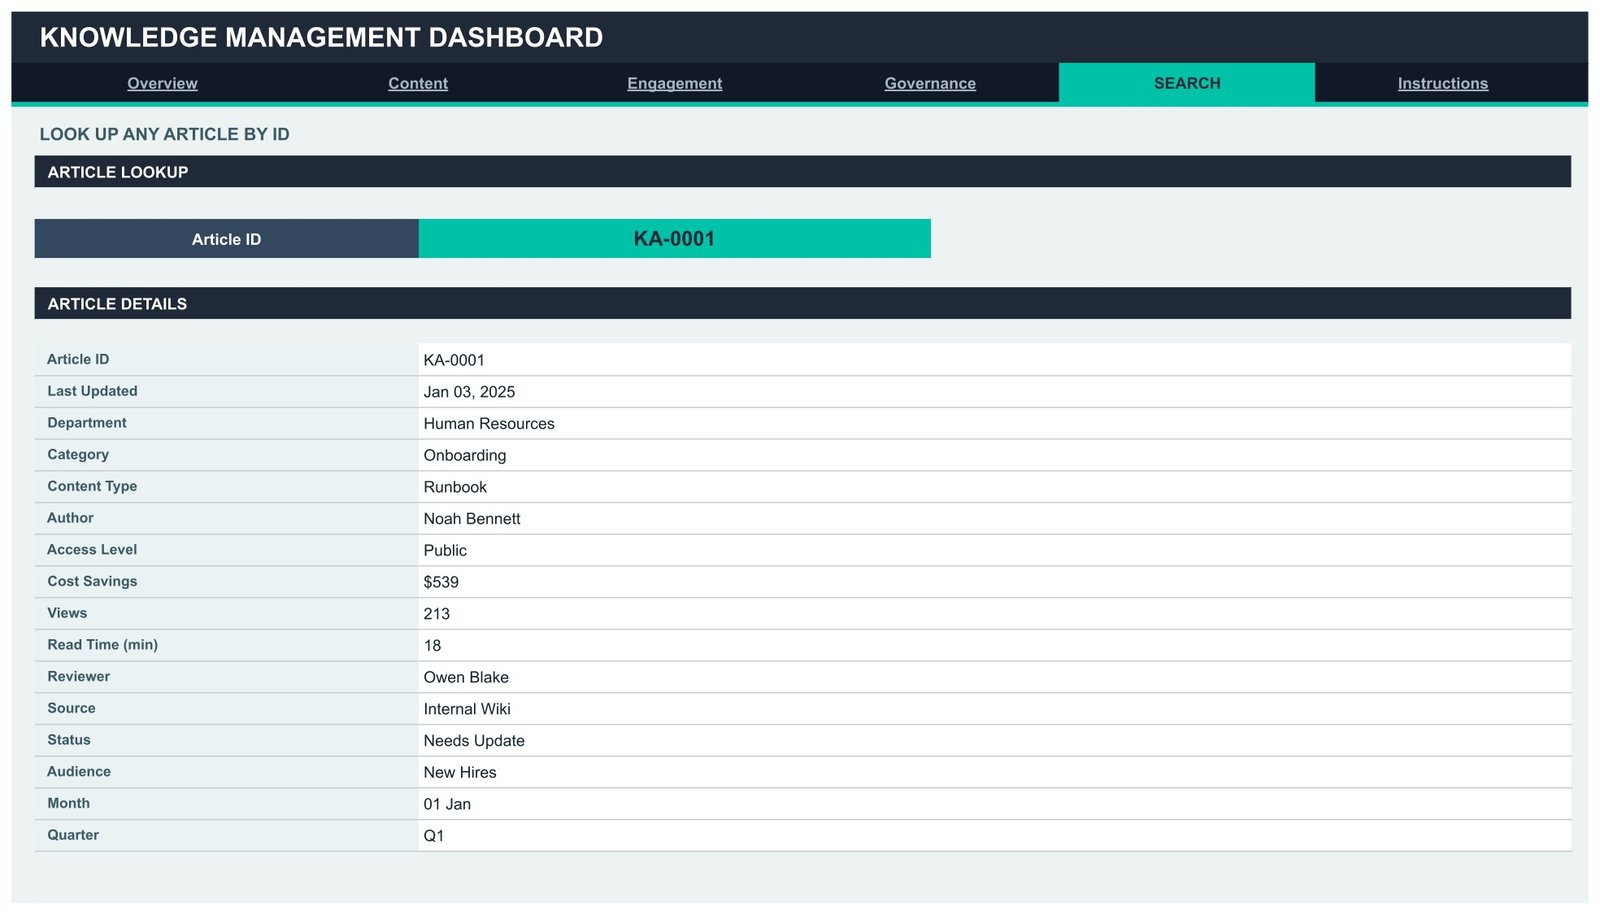
- 🔎 Article-level lookup. The Search tab takes any Article ID and returns all 16 stored fields — department, category, content type, author, access level, cost savings, views, read time, reviewer, source system, status, audience, month and quarter.
- 📈 Right-hand insight rail on every analysis page. Each page carries a snapshot block, a 12-month savings trend, a Top 5 ranking, a share breakdown and an At-a-glance list, so the headline numbers sit beside the charts rather than on a separate tab.
- ➕ Auto-expand to 1,000 rows. Pivots, slicers and every formula already cover row 1001. Paste new records anywhere inside that range and the dashboard updates on its own — no range editing.
- 🎨 One-place theming. The whole design runs off a single contrast pair — ink #1F2937 against accent #00C2A8, plus amber #F59E0B for second chart series. Edit the palette block and the entire dashboard restyles.
📦 What’s Inside the Knowledge Management Dashboard in Google Sheets
Six tabs: four analysis pages, one lookup page and a user guide. Every page shares the same navigation strip, so moving between them is one click.
Page 1: Overview — Organisation-Wide Knowledge Performance
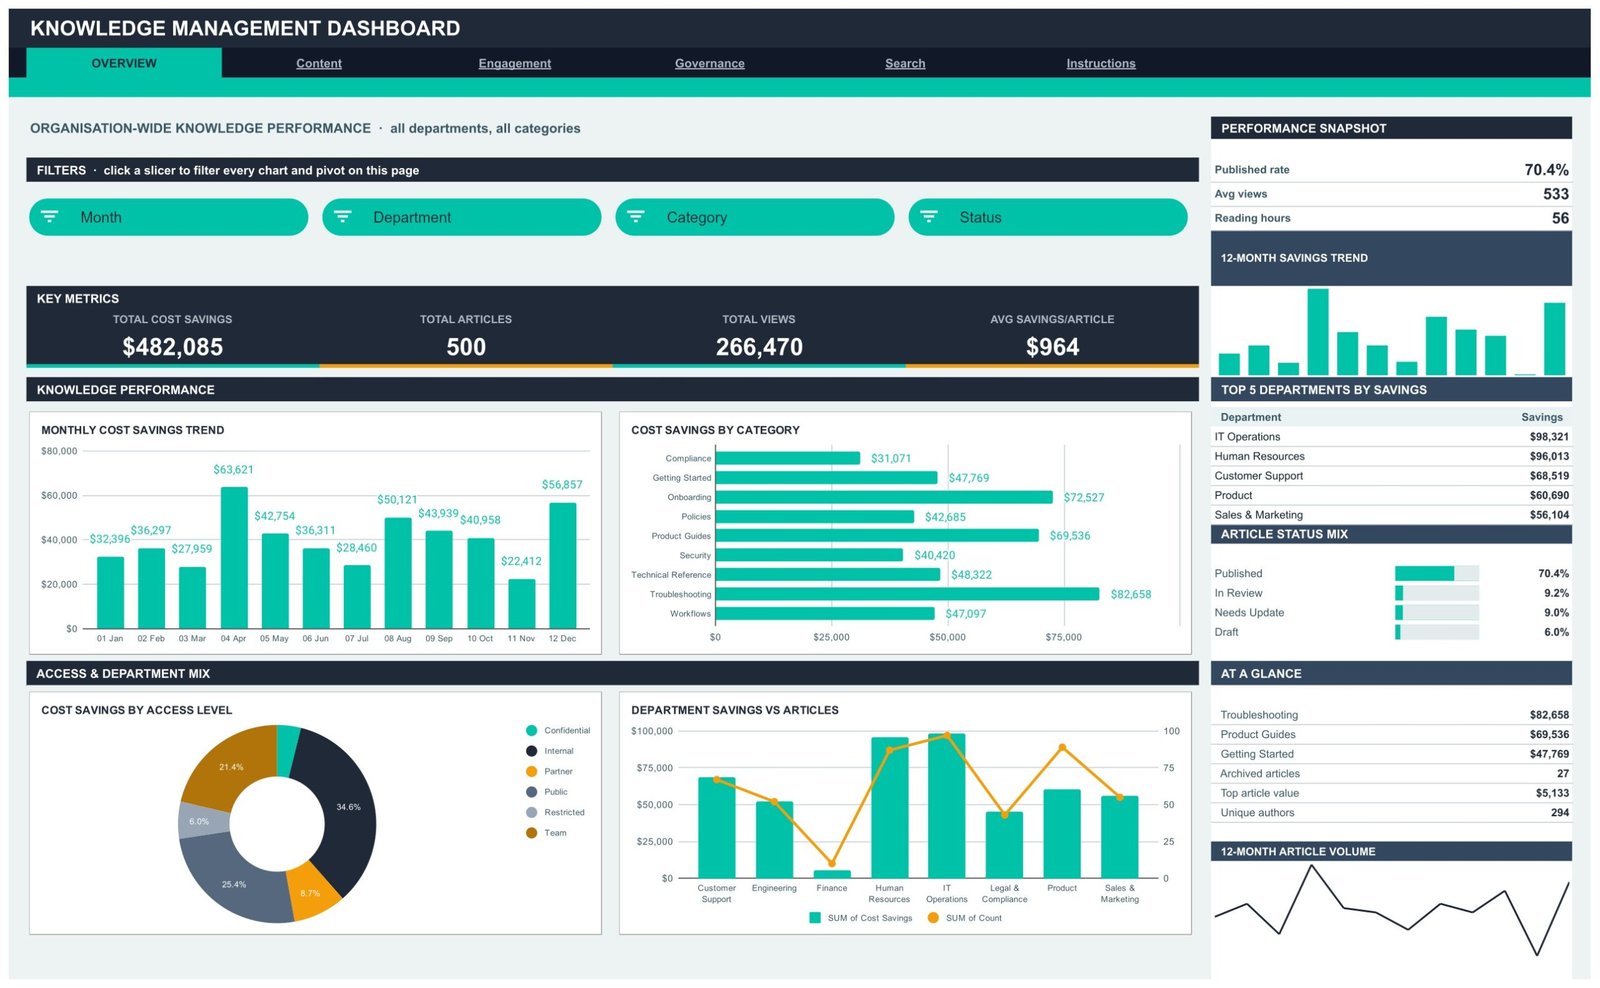
Headline cards show Total Cost Savings, Total Articles, Total Views and Avg Savings per Article, with a snapshot of Published rate, Avg views and Reading hours. Charts include Monthly Cost Savings Trend, Cost Savings by Category, Cost Savings by Access Level and Department Savings vs Articles, alongside a Top 5 Departments by Savings table and an Article Status Mix bar set covering Published, In Review, Needs Update and Draft.
Page 2: Content — Library, Savings and Format Mix by Department
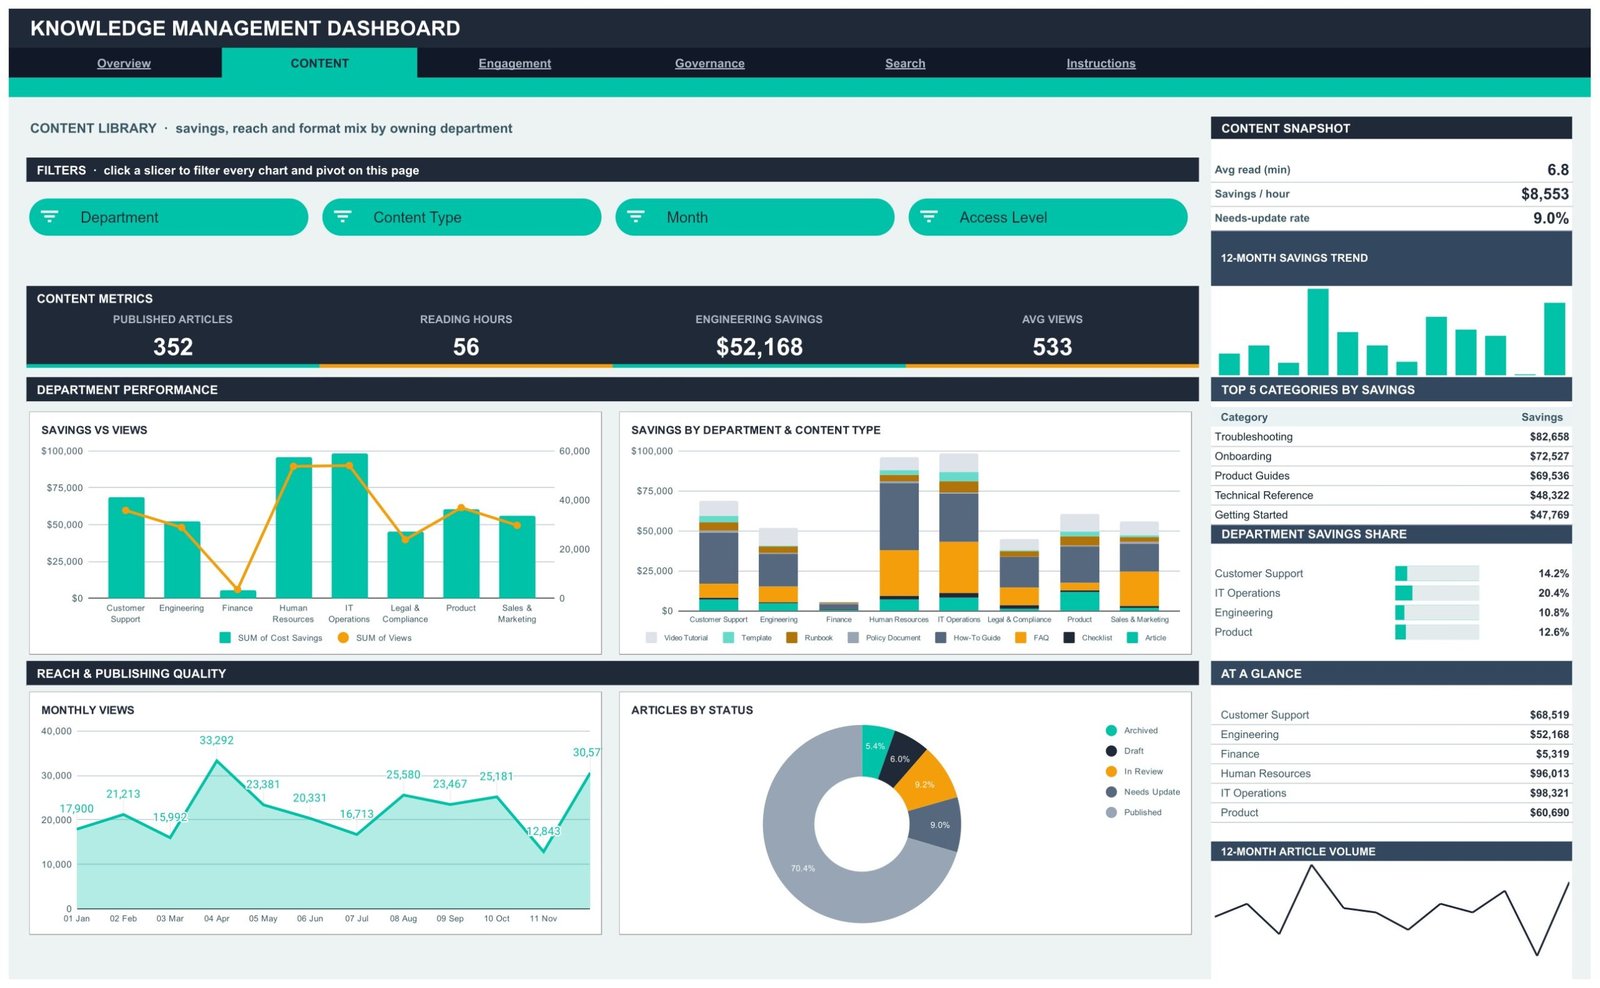
Cards track Published Articles, Reading Hours, Engineering Savings and Avg Views, with a snapshot of Avg read time, Savings per hour and Needs-update rate. Charts include Savings vs Views by Department, Savings by Department and Content Type, Monthly Views and Articles by Status, plus Top 5 Categories by Savings and a Department Savings Share panel.
Page 3: Engagement — What People Actually Open
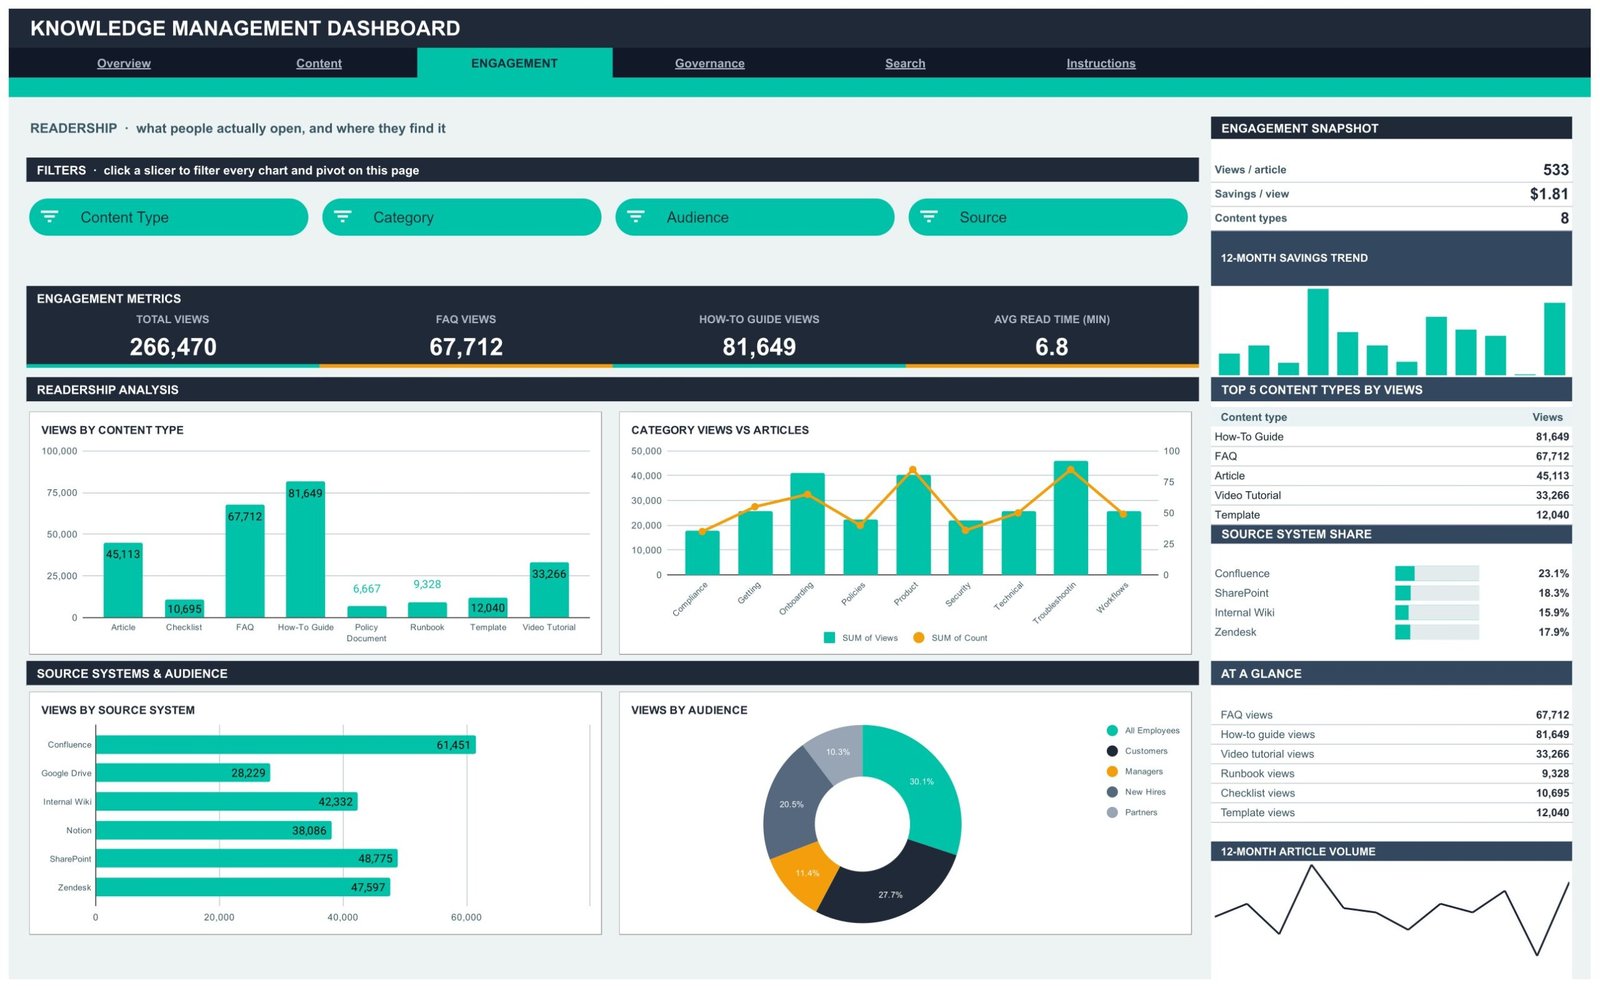
Cards show Total Views, FAQ Views, How-To Guide Views and Avg Read Time, with a snapshot of Views per article, Savings per view and Content types. Charts include Views by Content Type, Category Views vs Articles, Views by Source System and Views by Audience, plus Top 5 Content Types by Views and a Source System Share panel covering Confluence, SharePoint, Zendesk, Internal Wiki, Notion and Google Drive.
Page 4: Governance — Ownership, Access Control and Review Health
Cards track Restricted Articles, Needs Update, Unique Authors and Archived Rate, with a snapshot of Public share, Savings per author and Reviewers. Charts include Articles by Access Level, Status Savings vs Articles, Savings by Reviewer and Monthly Article Volume, plus Top 5 Reviewers by Savings and an Access Level Share panel.
Page 5: Search — Look Up Any Article by ID
Pick an Article ID such as KA-0001 and the Article Details card returns every stored field for that record: Last Updated, Department, Category, Content Type, Author, Access Level, Cost Savings, Views, Read Time, Reviewer, Source, Status, Audience, Month and Quarter.
Page 6: Instructions — How This Dashboard Works
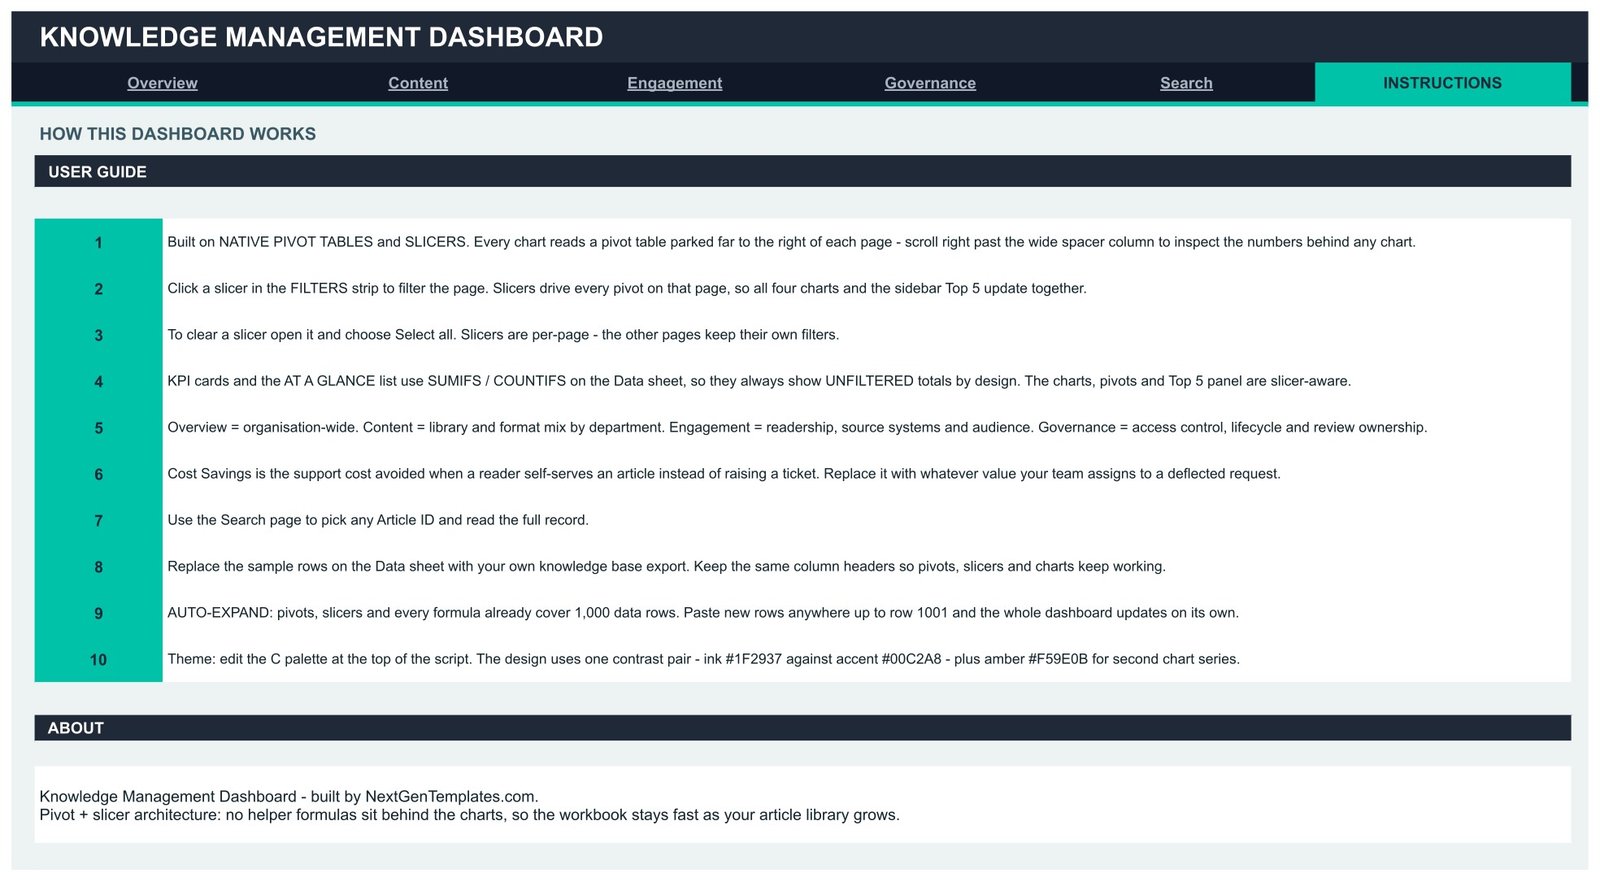
A ten-step user guide covering the pivot-and-slicer architecture, how to clear a slicer, why the KPI cards deliberately show unfiltered totals, what Cost Savings represents, how to swap in your own export and where the colour palette lives.
Data Sheet
A flat table of 500 sample articles with the exact column headers the pivots expect. Replace the rows with your Confluence, SharePoint, Notion or Zendesk export, keep the headers, and the dashboard follows.
📊 Knowledge Management Dashboard in Google Sheets vs. Excel vs. Paid Knowledge Base Analytics
| Feature | Knowledge Management Dashboard in Google Sheets | Microsoft Excel dashboard | Guru / Zendesk Guide / Confluence Analytics |
|---|---|---|---|
| Cost | $9.99 one-time ✅ | $14-25 one-time | $10-30 per user per month |
| Platform | Any browser, no install ✅ | Excel desktop licence needed | Vendor cloud only |
| Setup time | Under 10 minutes ✅ | Under 15 minutes | 2-6 weeks with migration |
| Real-time team collaboration | Built in ✅ | Only via OneDrive co-authoring | Built in ✅ |
| Mobile access | Google Sheets app ✅ | Excel mobile, limited slicers | Native app ✅ |
| Customisable fields and charts | Fully editable ✅ | Fully editable ✅ | Fixed vendor reports |
| Share with a link | One click ✅ | File attachment | Seat required to view |
| Works on an export from any KB tool | Yes ✅ | Yes ✅ | Only its own platform |
| Year-1 cost at 5 users | $9.99 ✅ | $14-25 | $600-1,800 |
For teams that want knowledge base reporting without paying per seat for a platform they already outgrew, the Knowledge Management Dashboard in Google Sheets sits in the sweet spot.
👥 Who This Template Is For — and Who It’s Not For
✅ This template is built for:
- Knowledge managers and documentation leads at 20-500 person companies who need a monthly reporting view without buying an analytics add-on.
- Customer support and IT operations managers proving that self-service deflects tickets, using a cost-per-deflection number they control.
- Internal comms and HR teams auditing onboarding and policy content for staleness, ownership and access level.
- Consultants and agencies running a knowledge base audit for a client and delivering the findings in a shareable sheet.
❌ This template is NOT for:
- Teams that want a live API connection into Confluence, Notion or Zendesk — this reads a manual export, not a sync.
- Enterprises needing SSO, audit logging and row-level permissions on the report itself.
- Anyone looking for a knowledge base to write articles in — this measures a knowledge base, it does not host one.
- Libraries beyond roughly 1,000 articles per refresh without extending the pre-built ranges first.
⚙️ How to Use the Knowledge Management Dashboard in Google Sheets
- Open the PDF in your download and click the copy link to create your own editable copy in Google Drive.
- Open the Instructions tab and read the ten-step guide — it explains the pivot-and-slicer architecture in about two minutes.
- Export your articles from Confluence, SharePoint, Notion, Zendesk or your internal wiki into a flat list.
- Paste the rows over the sample data on the Data sheet, keeping the existing column headers exactly as they are.
- Set your own Cost Savings value per article — the support cost avoided each time a reader self-serves.
- Return to Overview and click a slicer. All four charts and the sidebar Top 5 panel refilter together.
- Use the Search tab to pull any single Article ID and read its full record before a review meeting.
- Share the sheet with your team by link, or edit the palette block to match your brand colours.
💼 Real-World Use Cases
Priya runs documentation for a 120-person SaaS company. She refreshes the Data sheet every month, opens Governance, filters to Needs Update and hands each reviewer their own list from the Savings by Reviewer chart — replacing a spreadsheet she used to rebuild by hand every quarter.
Marcus manages IT Operations at a manufacturer. He uses the Engagement page to see that How-To Guides and FAQs pull the most views, then shifts his team’s writing effort towards those two formats and shows leadership the savings-per-view number to justify the time.
Elif consults on knowledge base clean-ups. She drops a client’s export into the Data sheet, screenshots the Overview and Governance pages, and delivers a findings pack in an afternoon instead of building a bespoke report from scratch.
❓ Frequently Asked Questions
What KPIs does the Knowledge Management Dashboard in Google Sheets track?
The Knowledge Management Dashboard in Google Sheets tracks 16 KPIs including Total Cost Savings, Total Articles, Total Views, Avg Savings per Article, Published Articles, Reading Hours, FAQ Views, How-To Guide Views, Avg Read Time, Restricted Articles, Needs Update, Unique Authors and Archived Rate.
How long does setup take?
Under 10 minutes. Copy the sheet from the link in the PDF, paste your article export over the sample rows on the Data sheet, and set your own cost-per-deflection value. Pivots, slicers and formulas already cover 1,000 rows, so nothing needs re-ranging.
Does it connect directly to Confluence, Notion or Zendesk?
No. The Knowledge Management Dashboard in Google Sheets reads a manual export rather than a live API sync. Any tool that can export a flat article list works, because the dashboard only cares about the column headers on the Data sheet.
How does this compare to Guru or Zendesk Guide analytics?
Paid knowledge base analytics costs roughly $10-30 per user per month and only reports on its own platform. The Knowledge Management Dashboard in Google Sheets is a one-time $9.99 purchase, reads an export from any tool, and every chart and field is yours to edit.
What is the Cost Savings figure actually measuring?
Cost Savings is the support cost avoided when a reader self-serves an article instead of raising a ticket. The sample file uses a placeholder value; replace it with whatever your team assigns to a deflected request and every savings chart recalculates.
Can I add more than 1,000 articles?
Yes, but you need to extend the pre-built ranges first. Out of the box the Knowledge Management Dashboard in Google Sheets covers rows up to 1001 in every pivot, slicer and formula, which suits most internal knowledge bases.
Why do the KPI cards ignore the slicers?
By design. The KPI cards and the At-a-glance list use SUMIFS and COUNTIFS on the Data sheet so they always show unfiltered organisation totals as a constant reference. The charts, pivots and Top 5 panels are the slicer-aware parts of the page.
👤 About the Author
Built by PK — Microsoft Certified Professional with 15+ years of Excel, Google Sheets and Power BI experience. Founder of NextGenTemplates, reaching 300K+ subscribers across YouTube channels (@PK-AnExcelExpert, @NextGenTemplates, @NeoTechNavigators). Every template is hand-built and tested before release.
🔗 Explore Related Templates
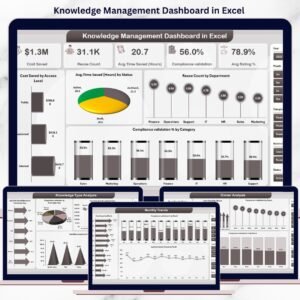
Also available as: the Knowledge Management Dashboard in Excel for teams on a desktop workbook, and the Knowledge Management Dashboard in Power BI when you need a refreshable model instead of a sheet.
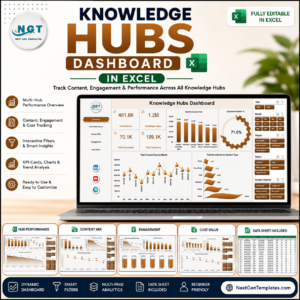
If knowledge sits inside a wider delivery function, pair this with the Project Management Office (PMO) Dashboard in Google Sheets or the Innovation & Transformation Dashboard in Google Sheets. For a deeper library view, the Knowledge Hubs Dashboard in Excel covers hub-level performance.
Browse the full Google Sheets Dashboards collection, or start from the Google Sheets Templates category to see trackers and planners built the same way.
📖 Click here to read the Detailed Blog Post
🎥 Visit our YouTube channel for step-by-step video tutorials
👉 YouTube.com/@NextGenTemplates
Watch the step-by-step video Demo:
📅 Last updated: August 2026
Compatibility and Requirements
- Works in Google Sheets. You need a free Google account and a web browser.
- You copy the sheet into your own Google Drive from the link in the PDF, then paste your article export over the sample rows on the Data sheet.
- The charts read native pivot tables and slicers. Google explains how to build and read charts in Add and edit a chart or graph.









Reviews
There are no reviews yet.