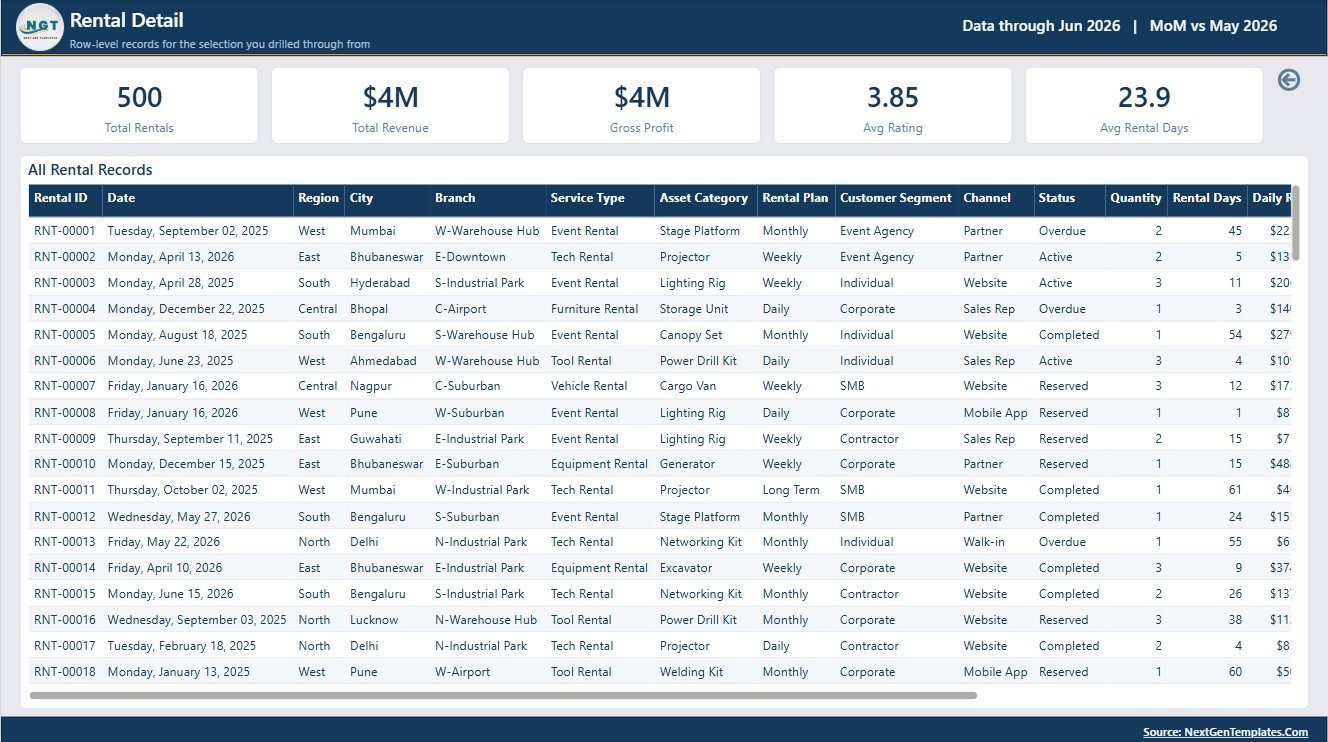
Rental Services Dashboard in Power BI helps rental companies monitor the numbers that usually sit across disconnected booking files, branch reports, and finance summaries. Instead of checking revenue, rentals, profit, discounts, utilisation, region, branch, channel, and customer satisfaction separately, this Power BI dashboard brings them into one reporting experience. It is a ready-to-use digital template with interactive pages, slicers, and visual analysis.
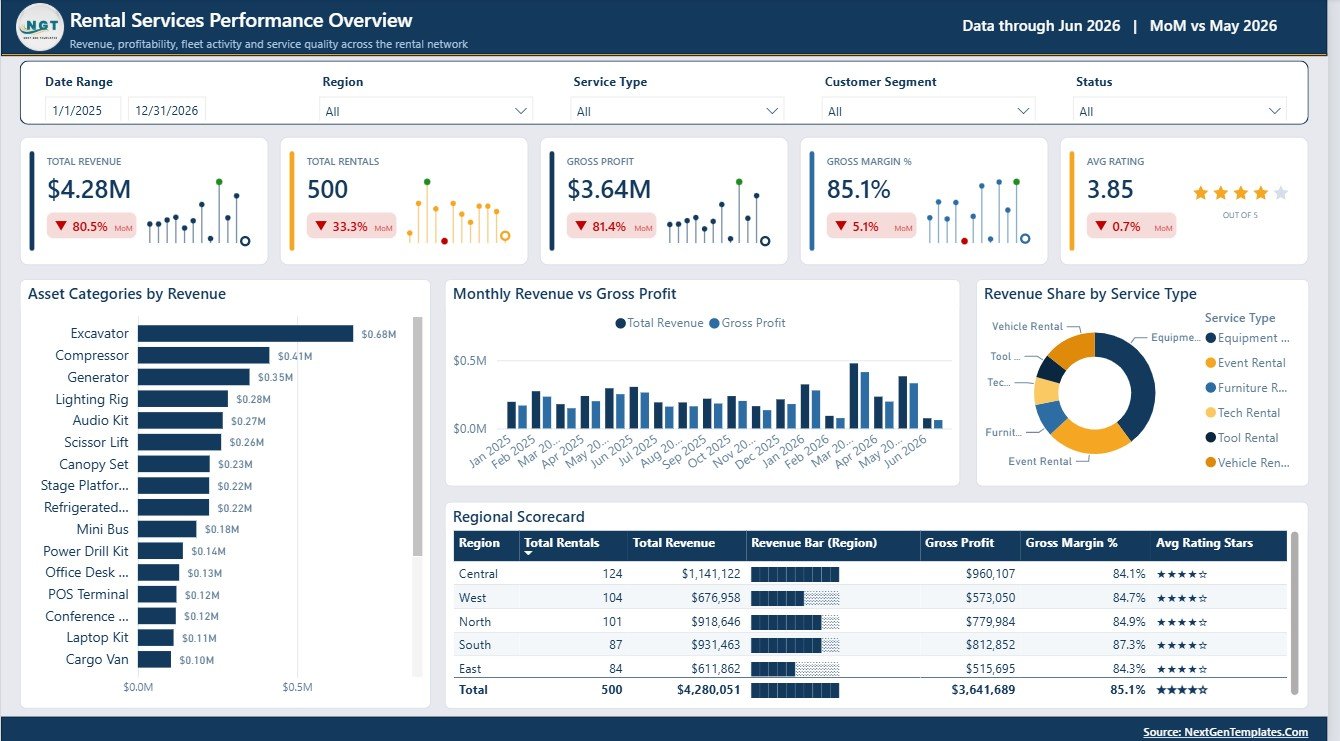
Rental Services Dashboard in Power BI
Key Features of Rental Services Dashboard in Power BI
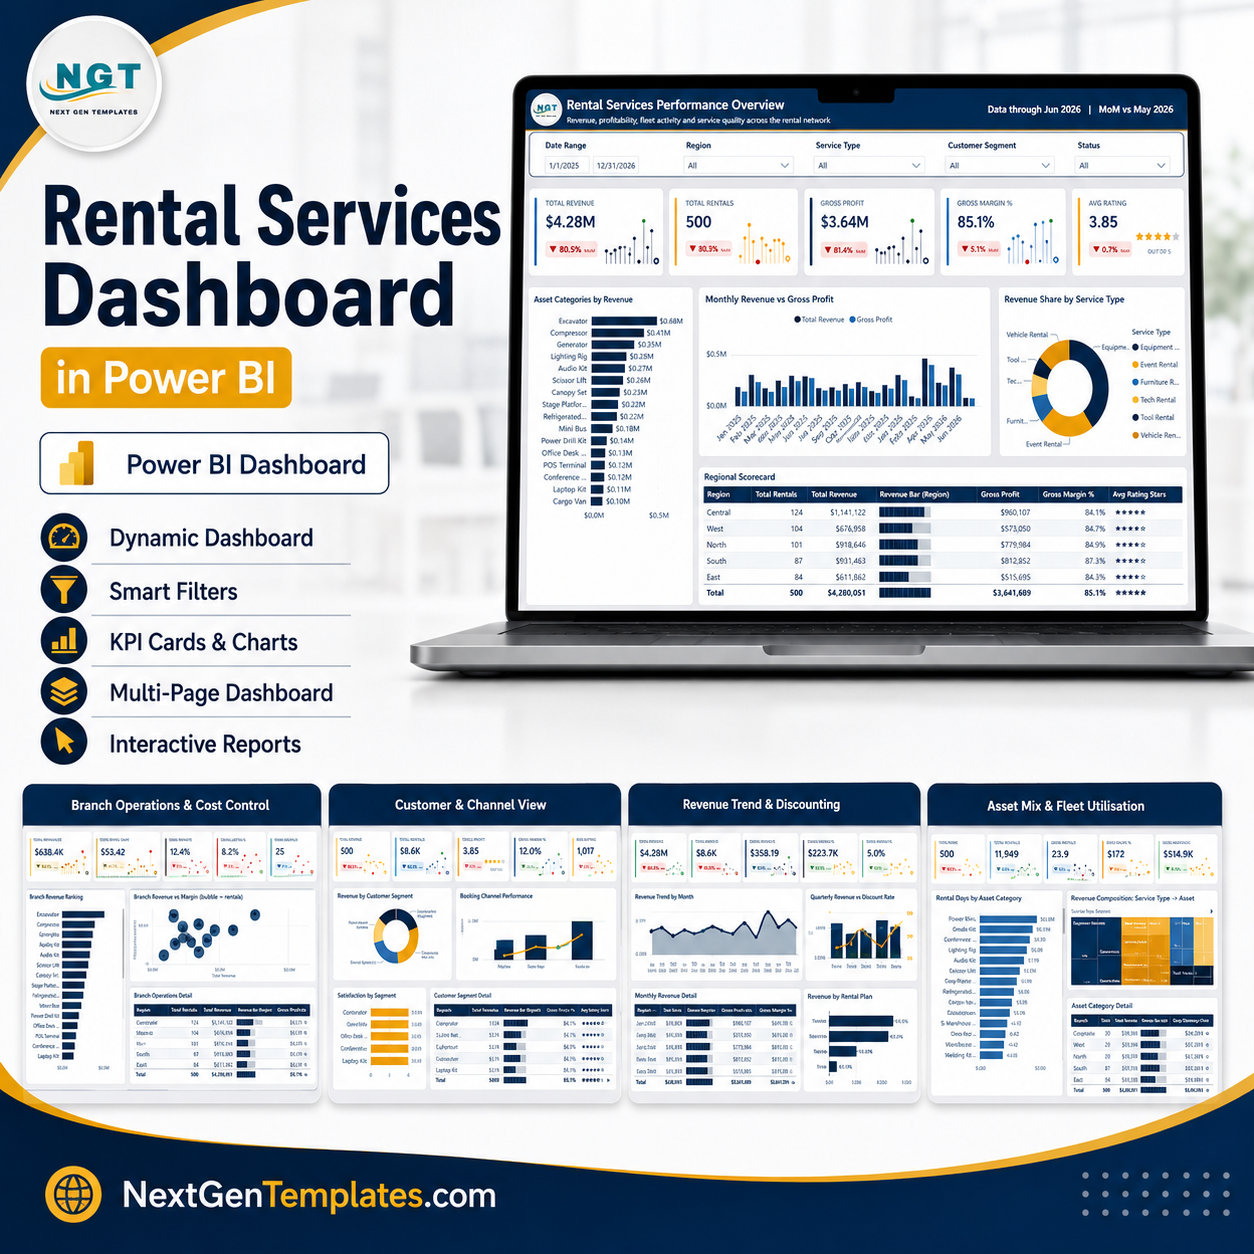
This template gives rental teams a practical reporting view for revenue, rental volume, gross profit, discounting, asset mix, customer segments, booking channels, branch performance, and regional operations. The dashboard uses cards for quick executive metrics and charts for deeper analysis.
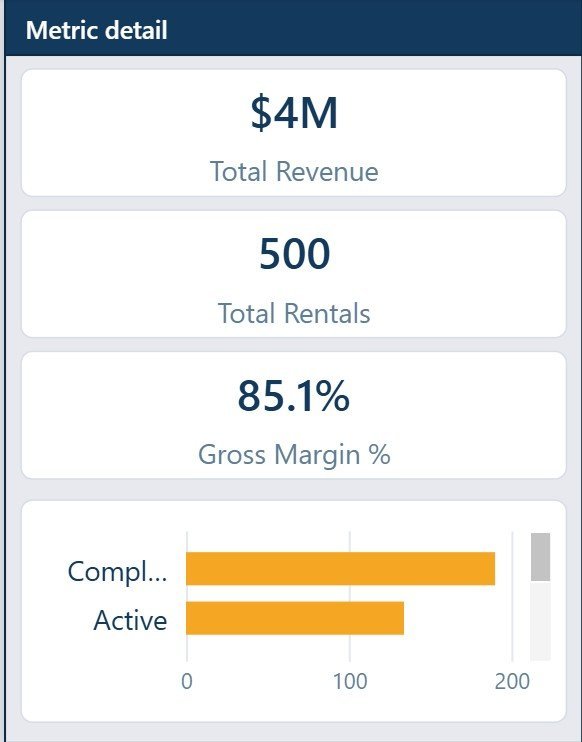
The overview page includes cards for Total Revenue, Total Rentals, Gross Profit, Gross Margin %, and Avg Rating. These KPIs help owners and operations managers understand whether the rental business is growing profitably and whether customer satisfaction is holding steady.
What’s Inside the Rental Services Dashboard in Power BI
The Power BI report includes multiple analytical pages. The Overview Page summarises high-level performance and includes Total Revenue by Asset Category, Total Revenue and Gross Profit by Month, Revenue Share by Service Type, and Rental Performance by Region.
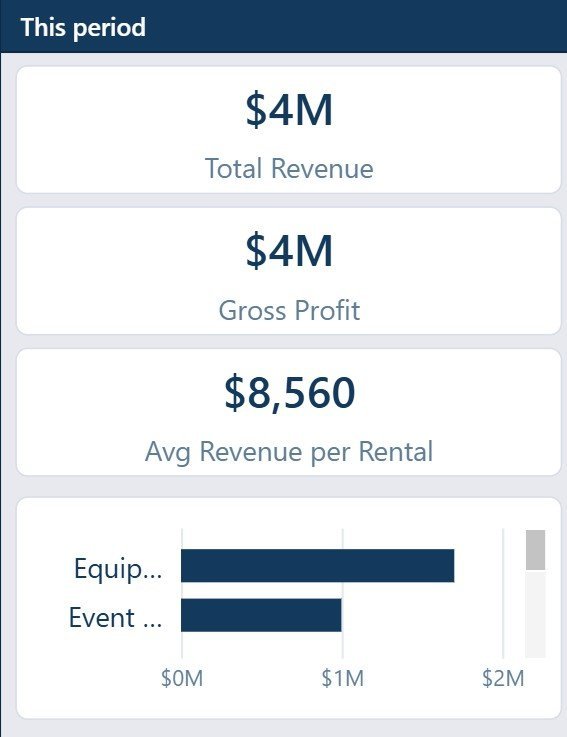
Total Revenue by Asset Category shows which rental asset groups are creating the most income. Total Revenue and Gross Profit by Month helps compare top-line growth with profitability trends. Revenue Share by Service Type highlights which service models contribute the largest portion of revenue. Rental Performance by Region shows where demand and revenue concentration are strongest.
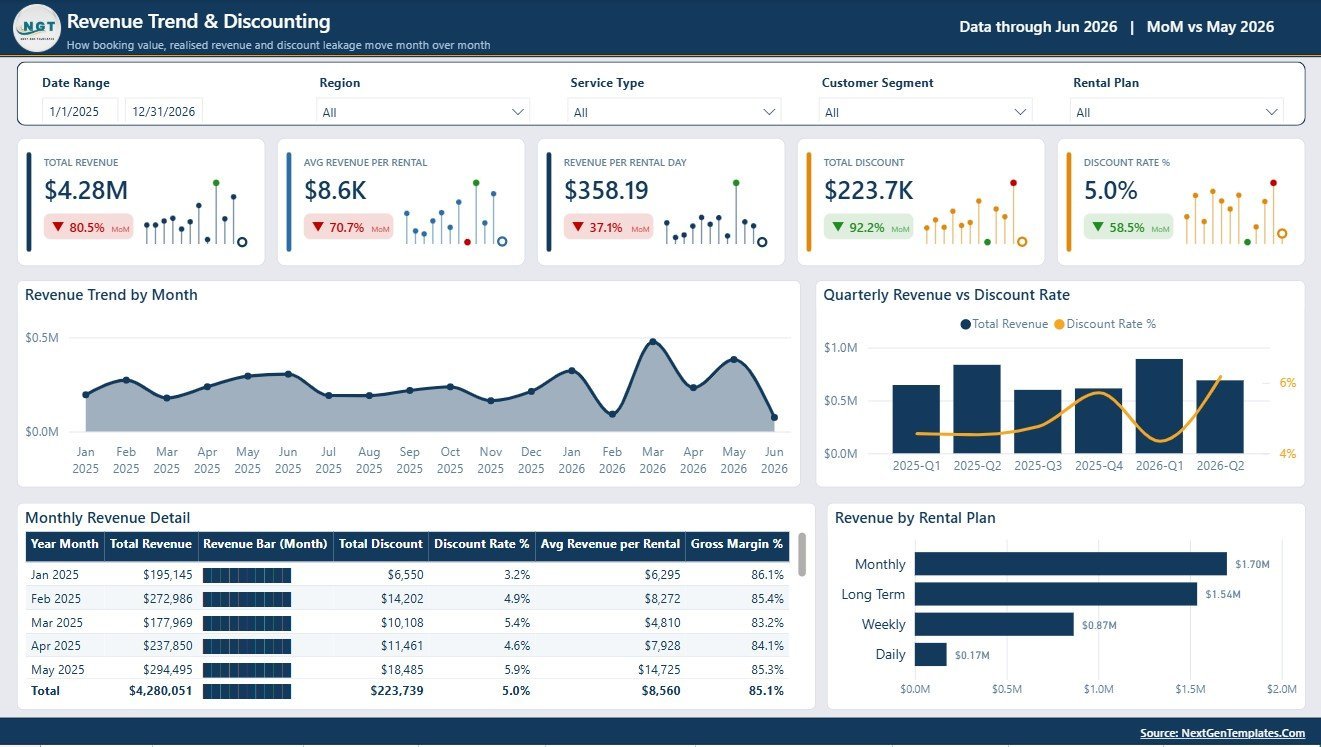
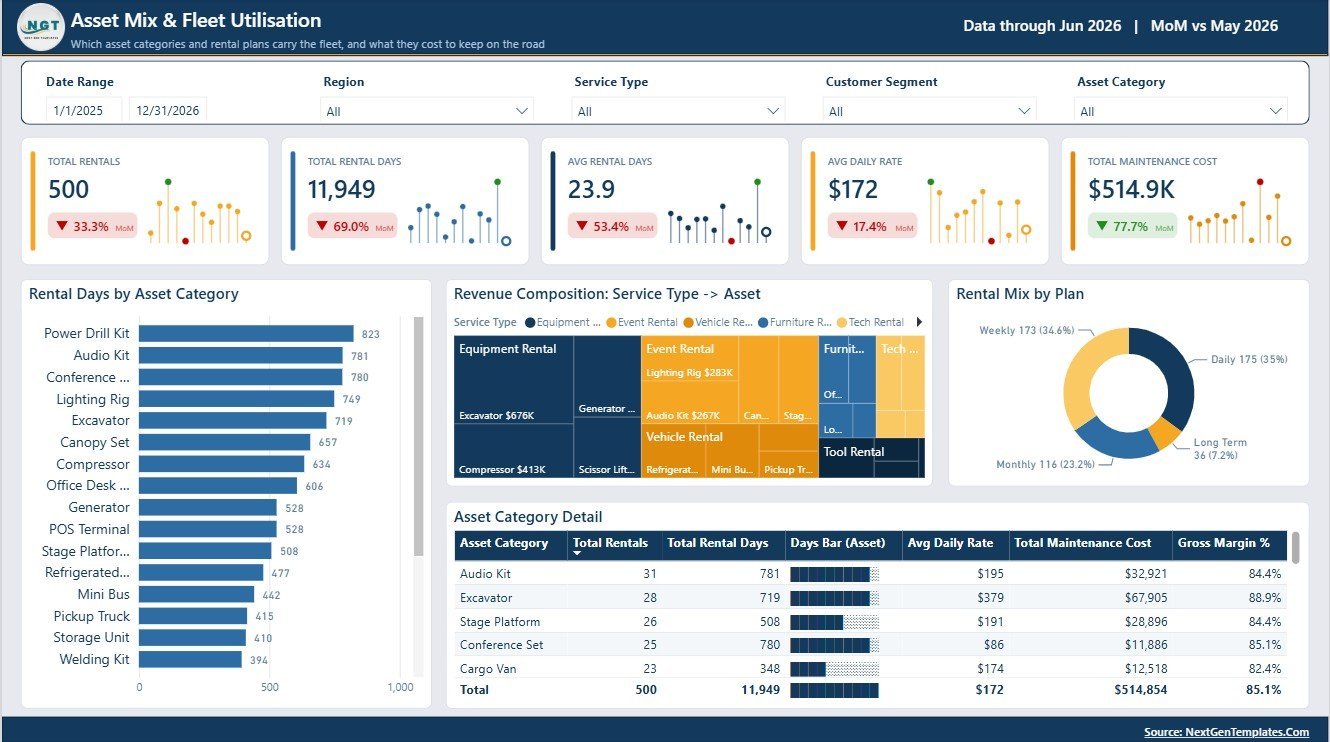
The Revenue Trend & Discounting page includes Total Revenue by Month, Total Revenue and Discount Rate % by Quarter, Revenue Performance by Year Month, and Total Revenue by Rental Plan. The Asset Mix & Fleet Utilisation page includes Rental Days by Asset Category, Revenue Composition by Service Type and Asset Category, Rental Mix by Rental Plan, and Asset Category Performance by Asset Category.
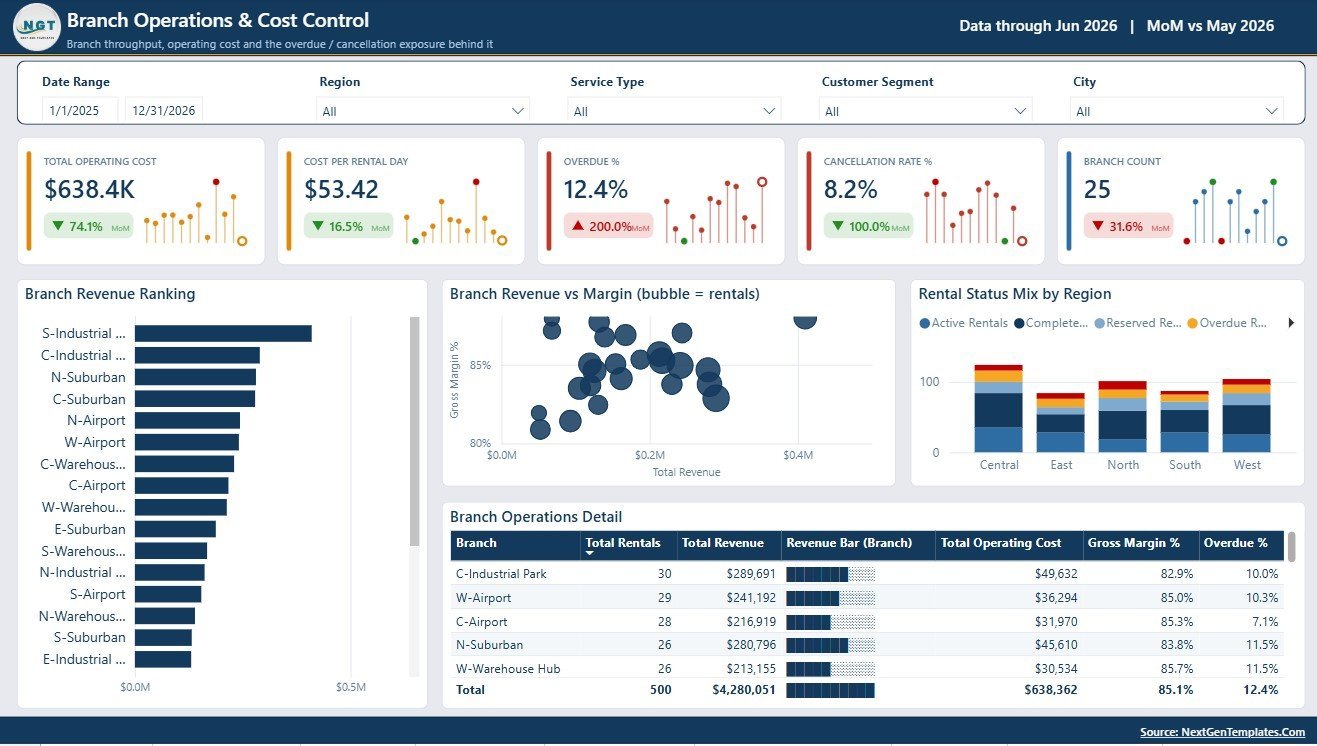
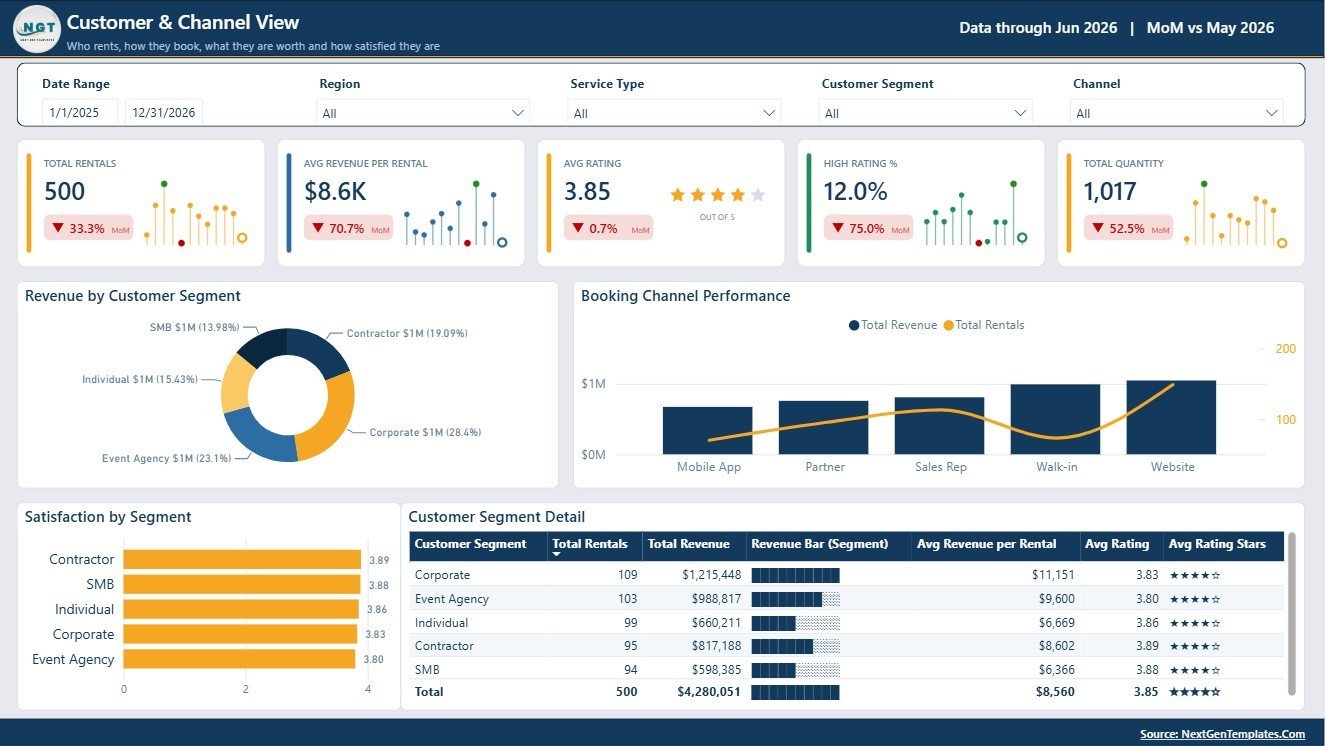
The Branch Operations & Cost Control page includes Branch Revenue Ranking by Branch, Gross Margin % by Branch Revenue, Rental Status Mix by Region, and Branch Operations Performance by Branch. The Customer & Channel View page includes Total Revenue by Customer Segment, Booking Channel Performance by Channel, Satisfaction by Customer Segment, and Customer Segment Performance by Customer Segment.
Rental Services Dashboard in Power BI vs. Tableau vs. Paid CRM/SaaS – Where This Fits
| Area | This Power BI Template | Tableau Alternative | Paid SaaS Alternative |
|---|---|---|---|
| Cost | One-time template purchase | Requires Tableau licensing | Monthly or annual subscription |
| Platform | Power BI Desktop | Tableau Desktop or Cloud | Vendor-hosted system |
| Setup time | Fast setup with sample structure | Requires dashboard build work | Depends on implementation |
| Rental KPIs | Revenue, profit, rentals, margin, rating, asset mix, branch and channel views | Must be built manually | Available only if included in the system |
Who This Template Is For – and Who It’s Not For
This template is for equipment rental companies, tool rental businesses, event rental operators, vehicle rental teams, construction rental branches, and service businesses that rent assets across regions or channels. It is not a booking engine, payment system, customer portal, inventory scanner, or ERP replacement.
How to Use the Rental Services Dashboard in Power BI
Download and unzip the file after purchase. Open the PBIX file in Power BI Desktop. Review the sample pages and fields, then replace the sample data with your own rental records. Refresh the report, check page slicers, and adjust visual formatting as needed.
Real-World Use Cases
Branch Operations Manager: compares branch revenue ranking, gross margin, and rental status mix to identify locations needing cost or process review.
Rental Business Owner: uses the overview page to check revenue, rentals, profit, margin, and customer rating before monthly review meetings.
Fleet Analyst: reviews rental days, asset category performance, and revenue composition to decide which asset categories deserve more investment.
Frequently Asked Questions
Do I need Power BI Desktop?
Yes. Open the PBIX file in Power BI Desktop, which is free from Microsoft.
Can I replace the sample data?
Yes. Replace the sample source with your own rental services data.
Does this include multiple dashboard pages?
Yes. It includes overview, revenue trend, asset mix, branch operations, and customer/channel analysis pages.
Can I edit the visuals?
Yes. You can edit charts, cards, colors, fields, and filters in Power BI.
Is this a rental booking system?
No. This is a reporting dashboard template for analysis.
About the Author
Built by PK – Microsoft Certified Professional with 15+ years of Excel, Google Sheets, and Power BI experience. Founder of NextGenTemplates, reaching 300K+ subscribers across YouTube channels. Every template is hand-built and tested before release.
Explore Related Templates
Browse more Power BI templates and Power BI dashboard templates on NextGenTemplates.
Get the Rental Services Dashboard in Power BI today and start reviewing your rental performance with cleaner reporting.
Last updated: August 3, 2026