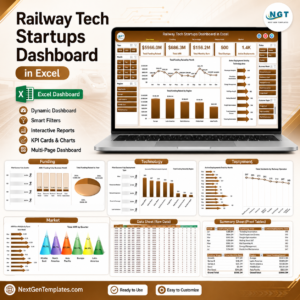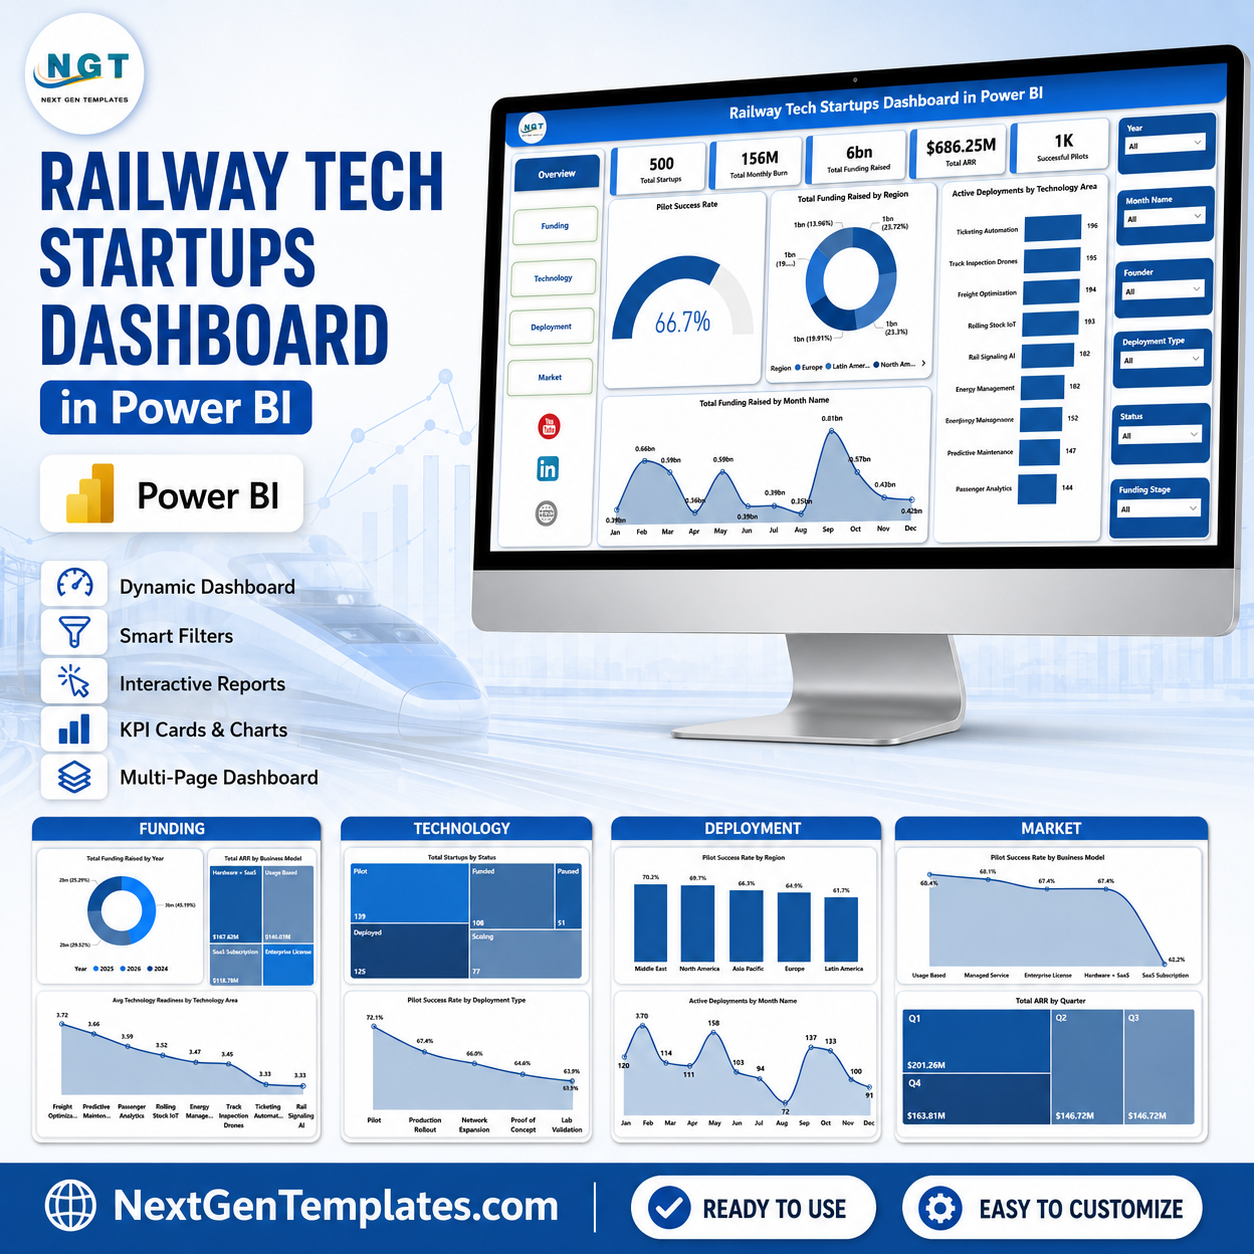
Last updated: August 1, 2026. The Railway Tech Startups Dashboard in Power BI helps rail innovation teams, startup founders, accelerators, venture analysts, and transport strategy teams review startup performance without building a report from a blank canvas. It turns funding, ARR, monthly burn, pilots, deployments, readiness, operators, regions, business models, and technology areas into 5 interactive Power BI pages, 5 executive KPI cards, and focused chart views. Join 8,400+ teams in 40+ countries using NextGenTemplates for one-time-purchase business templates with no recurring SaaS lock-in.
Key Features of Railway Tech Startups Dashboard in Power BI
- 5 Power BI pages for Overview, Funding, Technology, Deployment, and Market analysis.
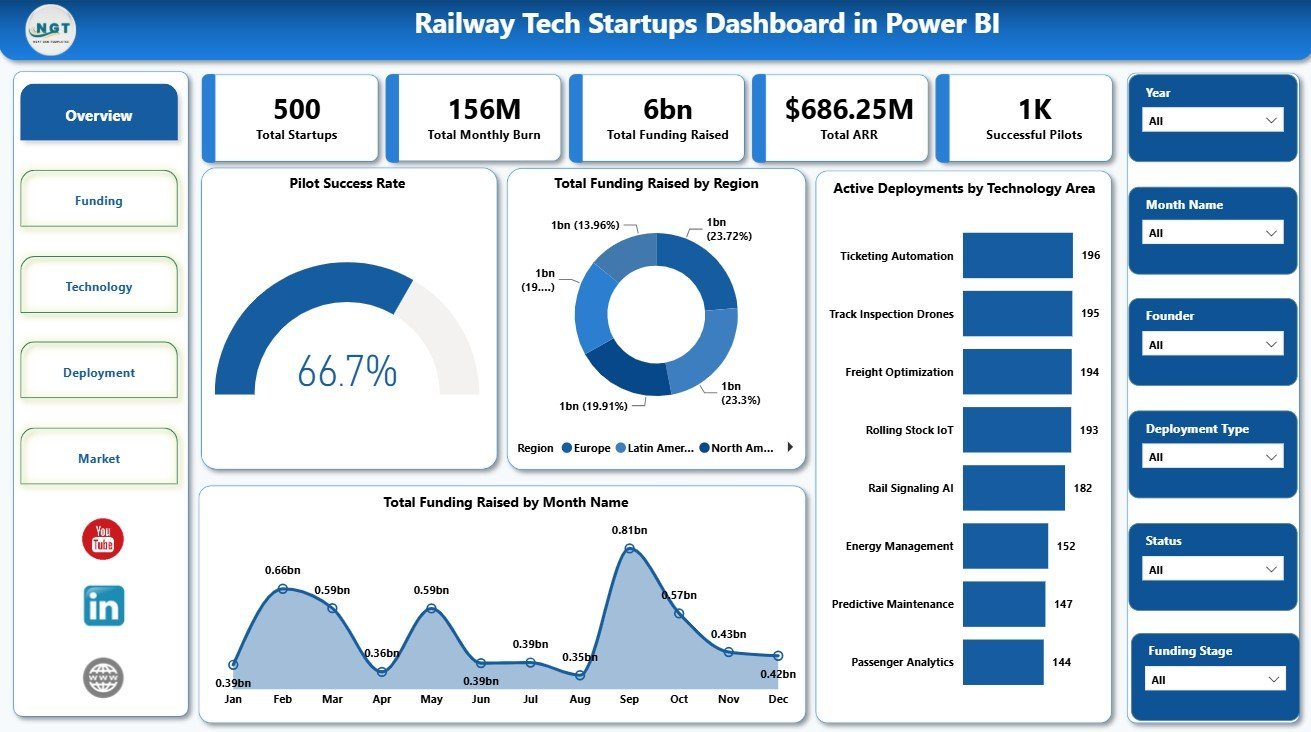
- 5 KPI cards show Total Startups, Total Monthly Burn, Total Funding Raised, Total ARR, and Successful Pilots.
- Railway startup finance tracking combines funding raised, ARR, monthly burn, ARR-to-funding ratio, and quarterly trends.
- Deployment and pilot analysis reviews active deployments, pilot success rate, deployment type, region, and railway operator performance.
- Technology readiness view helps teams compare readiness and startup status by technology area.
- Multiple slicers let users filter quickly during leadership reviews, investor updates, and operator meetings.
- Editable .pbix file so Power BI users can customize measures, pages, colors, visuals, and data connections.
What’s Inside the Railway Tech Startups Dashboard in Power BI
1 – Overview Page
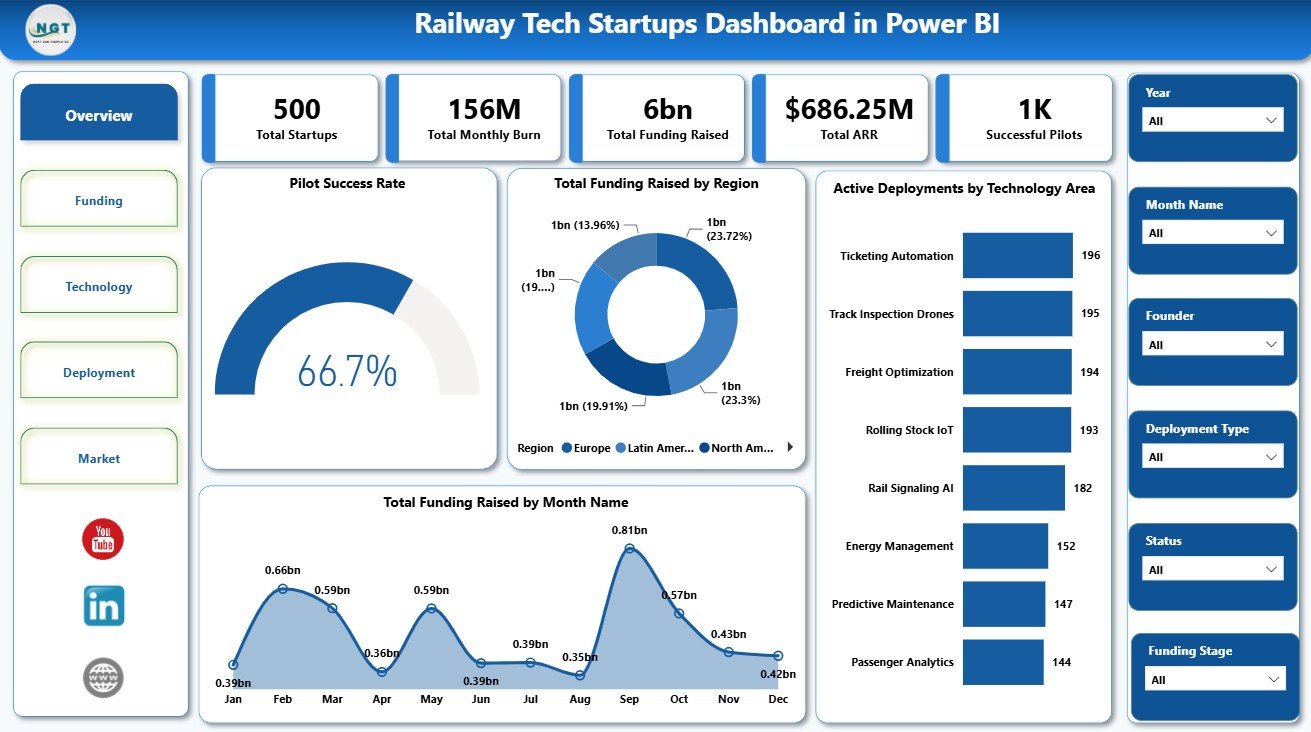
The Overview Page gives a high-level view of the railway tech startup portfolio. Cards show Total Startups, Total Monthly Burn, Total Funding Raised, Total ARR, and Successful Pilots so users can quickly understand portfolio size, spend pressure, capital raised, revenue traction, and pilot outcomes.
Pilot Success Rate by Overall Portfolio: This chart shows the overall pilot success level across the portfolio. It helps managers judge whether railway startup trials are producing enough validated outcomes.
Total Funding Raised by Region: This chart compares startup funding by geography. It helps investors and innovation teams see which regions are attracting more rail technology capital.
Active Deployments by Technology Area: This chart shows where live deployments are concentrated. It helps users compare railway technology areas such as signaling, maintenance, asset monitoring, safety, ticketing, planning, and operations.
Total Funding Raised by Month Name: This chart tracks funding movement by month. It helps teams spot stronger fundraising periods and review whether capital momentum is improving.
Railway Tech Startups Dashboard in Power BI
2 – Funding
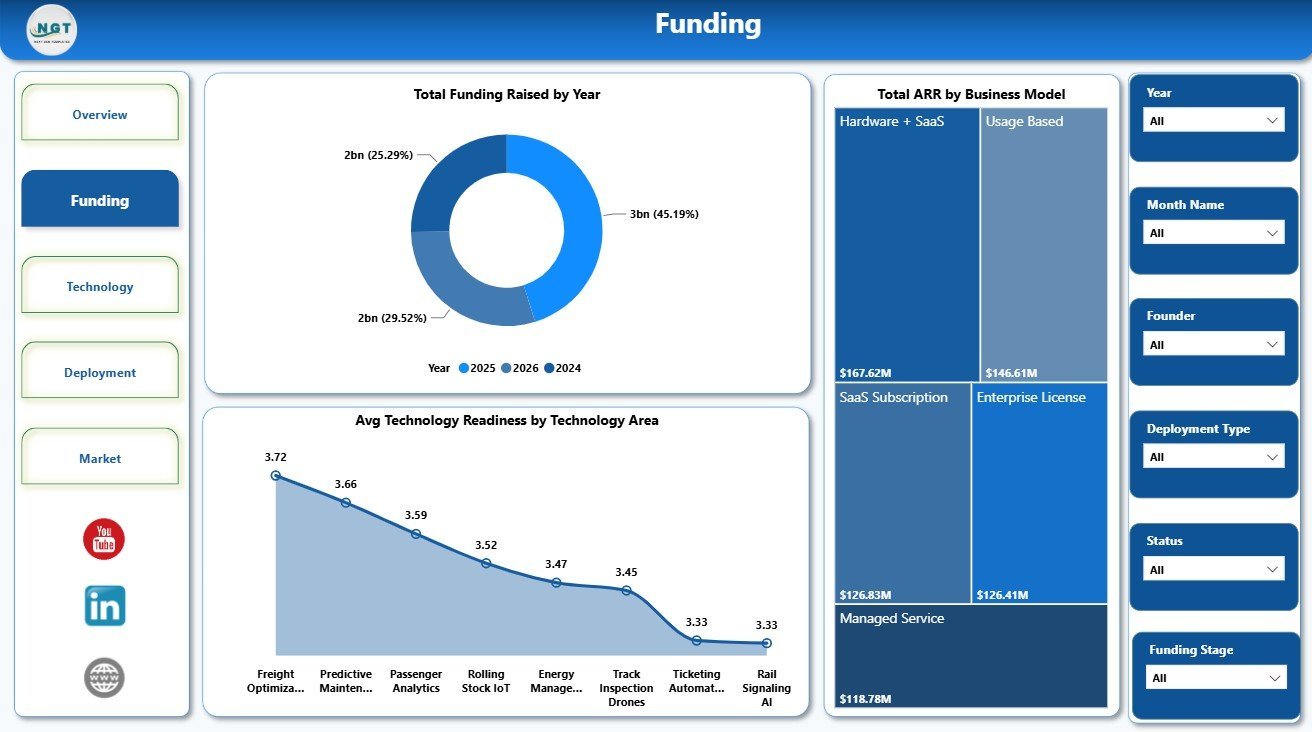
The Funding page focuses on capital movement, revenue model performance, and readiness. It is useful for portfolio reviews where teams need to connect investment activity with commercial progress.
Total Funding Raised by Year: This chart shows yearly fundraising movement. It helps users understand long-term capital trends and compare funding strength across years.
Total ARR by Business Model: This chart compares recurring revenue by business model. It helps users identify whether SaaS, hardware, services, platform, or hybrid models are creating stronger revenue traction.
Avg Technology Readiness by Technology Area: This chart compares readiness across railway technology areas. It helps decision-makers focus support on solutions that are closer to operational adoption.

Funding
3 – Technology
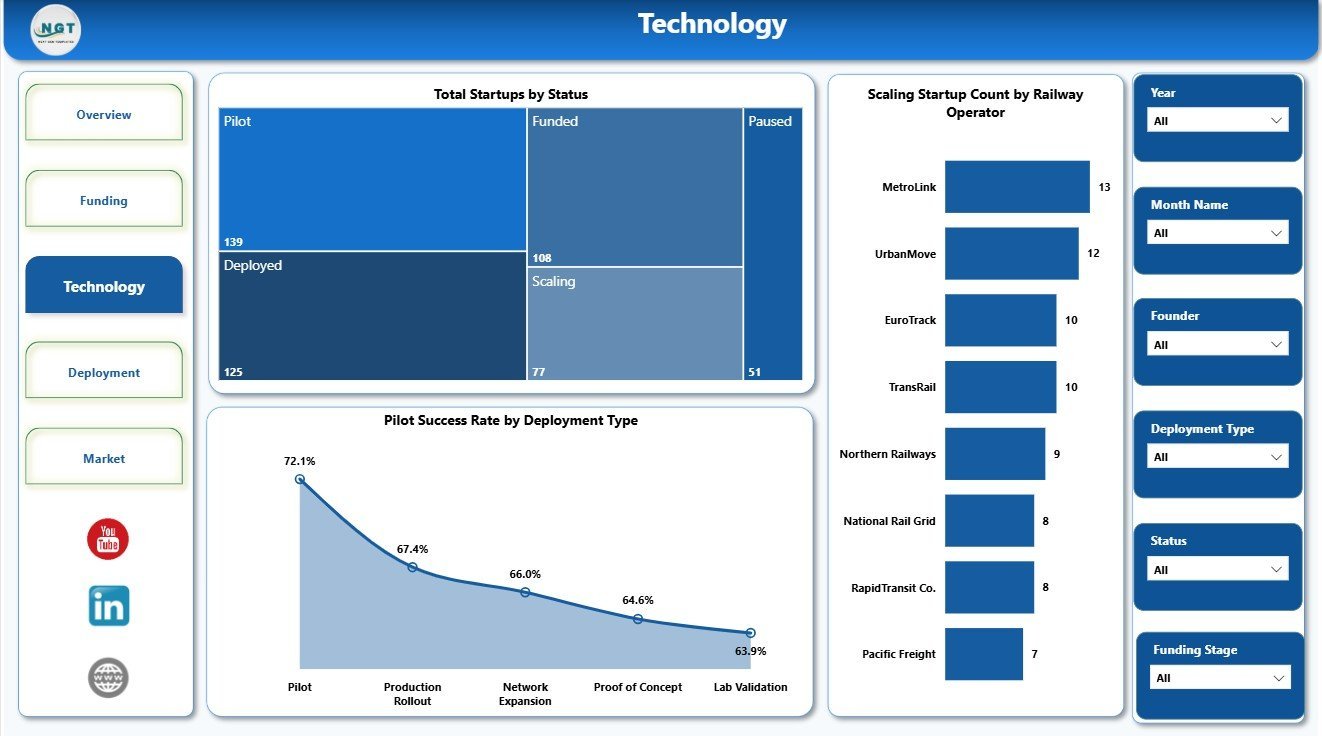
The Technology page explains portfolio maturity, operator activity, and deployment success. It helps rail innovation leaders see whether the right startups are moving from active status into scaling status.
Total Startups by Status: This chart summarizes startups by lifecycle status. It helps users see the mix of active, scaling, paused, graduated, or discontinued startup records.
Scaling Startup Count by Railway Operator: This chart compares scaling startups by railway operator. It helps teams identify which operator relationships are creating stronger adoption signals.
Pilot Success Rate by Deployment Type: This chart compares success by deployment type. It helps users understand which implementation formats are more likely to produce successful pilots.

Technology
4 – Deployment
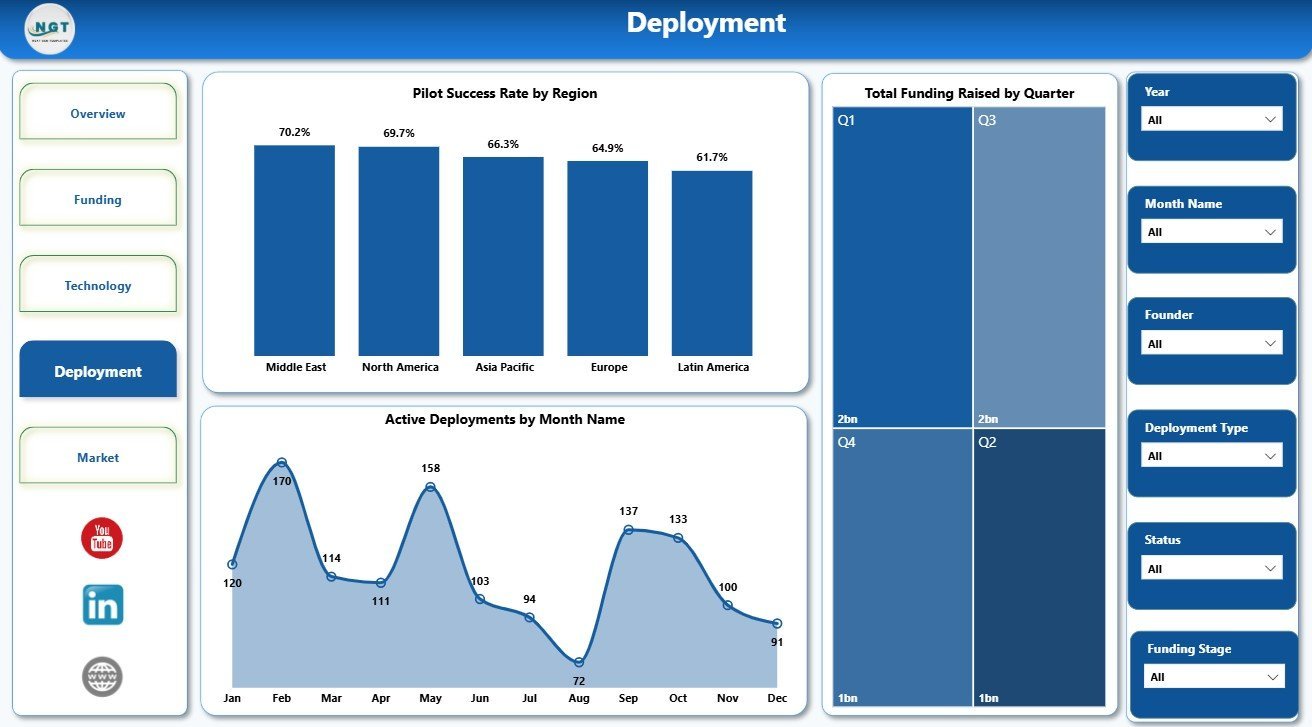
The Deployment page reviews rollout performance by geography and time. It is useful for implementation teams that need to connect deployments, pilot success, and funding cycles in one view.
Pilot Success Rate by Region: This chart compares pilot success by region. It helps users see where railway startup pilots are performing better and where rollout support may be needed.
Total Funding Raised by Quarter: This chart shows funding movement by quarter. It helps connect investment cycles with deployment momentum.
Active Deployments by Month Name: This chart tracks live deployment activity month by month. It helps users see whether railway tech implementation is expanding, flat, or slowing.

Deployment
5 – Market
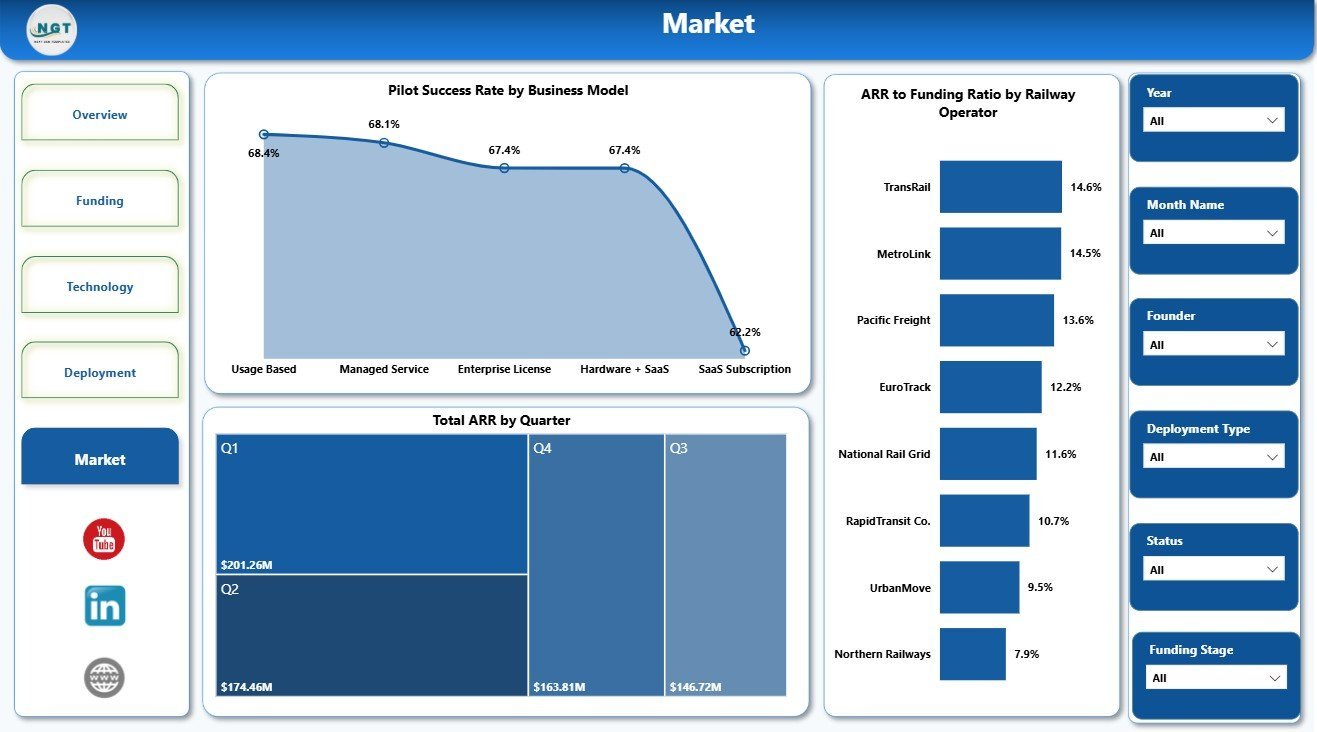
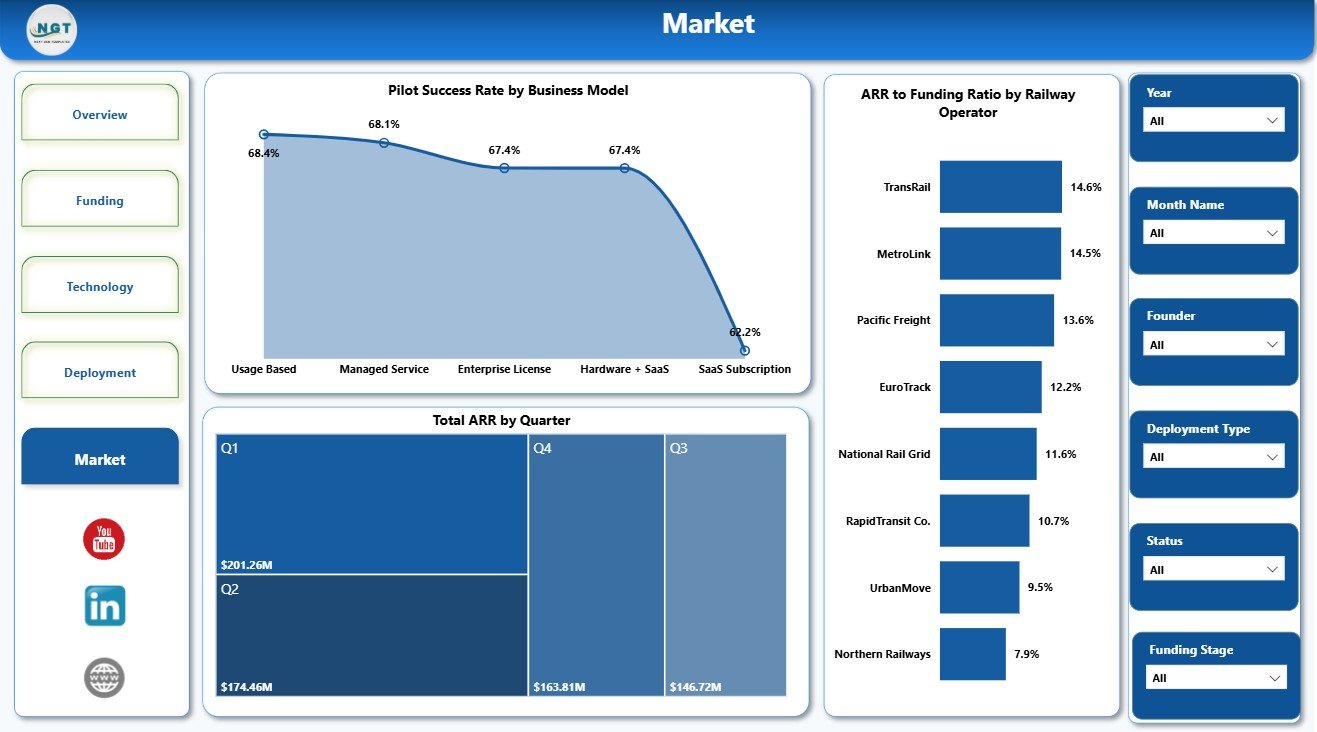
The Market page focuses on revenue quality, business model performance, and operator-level commercial conversion. It helps teams see which startup models and operator relationships are creating better market traction.
Pilot Success Rate by Business Model: This chart compares pilot success across business models. It helps users understand whether certain commercial models are easier to validate in railway environments.
Total ARR by Quarter: This chart tracks recurring revenue by quarter. It helps founders and portfolio managers review whether commercial traction is improving.
ARR to Funding Ratio by Railway Operator: This chart compares ARR-to-funding ratio by operator. It helps users identify which operator relationships are creating stronger revenue conversion against capital raised.
Market
Railway Tech Startups Dashboard in Power BI vs. Tableau vs. Paid Portfolio SaaS – Where This Fits
| Feature | This Power BI dashboard | Tableau or Qlik alternative | Paid portfolio SaaS |
|---|---|---|---|
| Cost | $17.99 one-time sale price | BI license plus analyst build time | Monthly or annual subscription |
| Platform | Power BI Desktop and optional Power BI Service | BI desktop or cloud platform | Vendor cloud platform |
| Setup time | Open PBIX, replace or connect data, refresh | Build model and visuals manually | Implementation and onboarding required |
| Real-time team collaboration | Available after publishing to Power BI Service | Available by plan | Usually included |
| Mobile access | Available through Power BI mobile after publishing | Available through vendor app | Usually included |
| Customizable fields | Edit visuals, model, measures, pages, and source connections | Editable with BI skills | Often limited by vendor rules |
| Share with link | Available through Power BI workspace permissions | Available through platform permissions | Usually login controlled |
| Year-1 cost at 5 users | Template cost plus Microsoft licensing choice | License cost plus build time | Often hundreds or thousands per year |
| Railway startup fit | Built around funding, ARR, burn, pilots, deployments, readiness, operators, regions, business models, and technology areas | Must be designed manually | Depends on vendor module fit |
Who This Template Is For – and Who It’s Not For
This template is for railway innovation managers, rail tech founders, accelerator leaders, incubators, venture analysts, transport agencies, consultants, and Power BI users who need repeatable startup portfolio reporting.
It is not a cap table system, investor CRM, accounting package, legal diligence tool, ERP, safety management system, or live railway operations platform. Use it when the goal is analysis and decision support from structured startup and deployment data.
How to Use the Railway Tech Startups Dashboard in Power BI
- Download and unzip the file package.
- Open the .pbix file in Power BI Desktop.
- Review the included sample data structure.
- Replace or connect the sample source with your own railway tech startup data.
- Refresh the report model.
- Use slicers to filter by region, operator, technology area, business model, deployment type, status, month, quarter, or year.
- Review Overview, Funding, Technology, Deployment, and Market pages during portfolio reviews.
Real-World Use Cases
Rail Innovation Manager: Review active deployments, successful pilots, readiness, and technology area concentration before an operator steering committee meeting.
Venture Analyst: Compare funding raised, ARR, burn, region, business model, and operator relationships before shortlisting railway tech startups.
Accelerator Program Lead: Track cohort progress by deployment type, pilot success, ARR growth, and startup status before demo day or board reporting.
Frequently Asked Questions
What does this dashboard track?
It tracks startups, monthly burn, funding raised, ARR, successful pilots, pilot success rate, active deployments, readiness, regions, operators, business models, technology areas, months, quarters, years, deployment types, and startup status.
How many Power BI pages are included?
The report includes 5 pages: Overview, Funding, Technology, Deployment, and Market.
Do I need Power BI Desktop?
Yes. Power BI Desktop is required to open and customize the .pbix file. Power BI Service is optional for sharing and scheduled refresh.
Can I use my own railway startup data?
Yes. Replace or connect the sample source with your own structured startup portfolio data and refresh the report.
Can I customize the visuals?
Yes. You can edit visuals, pages, colors, measures, labels, relationships, slicers, and source connections in Power BI Desktop.
Does this replace a startup CRM?
No. It is a reporting dashboard template. CRM workflow, contact management, task tracking, legal diligence, and investor relations automation need separate tools.
About the Author
Built by PK – Microsoft Certified Professional with 15+ years of Excel, Google Sheets, and Power BI experience. Founder of NextGenTemplates, reaching 300K+ subscribers across YouTube channels. Every template is hand-built and tested before release.
Explore Related Templates
- Railway Tech Startups Dashboard in Excel
- Railway Equipment Manufacturing Dashboard in Power BI
- Neural Tech Startups Dashboard in Power BI
- Power BI Dashboard Templates
- Power BI Templates
Download the Railway Tech Startups Dashboard in Power BI to review funding, ARR, burn, pilot success, deployments, readiness, operators, regions, business models, and technology areas in one editable Power BI report.
Last updated: August 1, 2026.
Schema note for manual review: add Product, FAQPage, and HowTo JSON-LD through Rank Math or the theme schema editor. priceValidUntil: 2027-08-01.