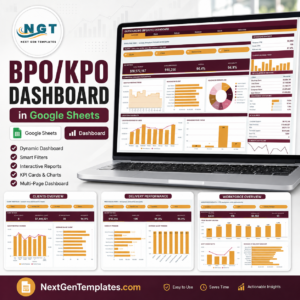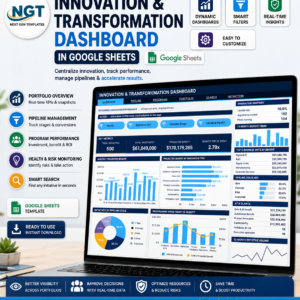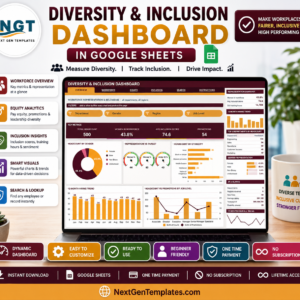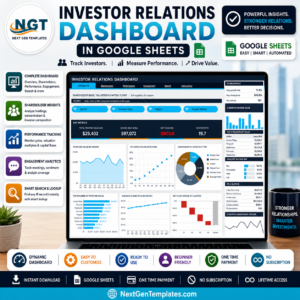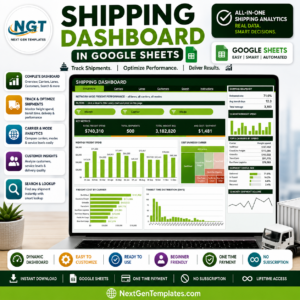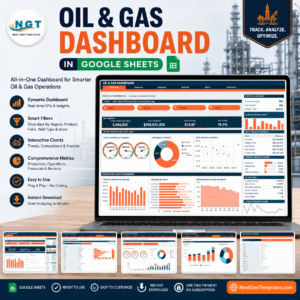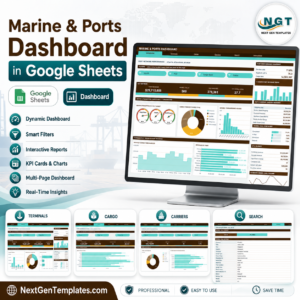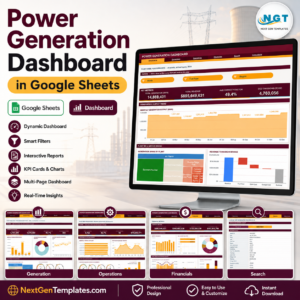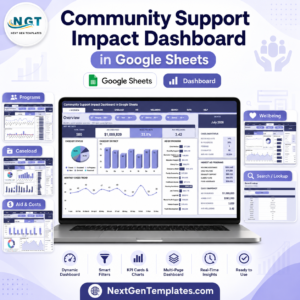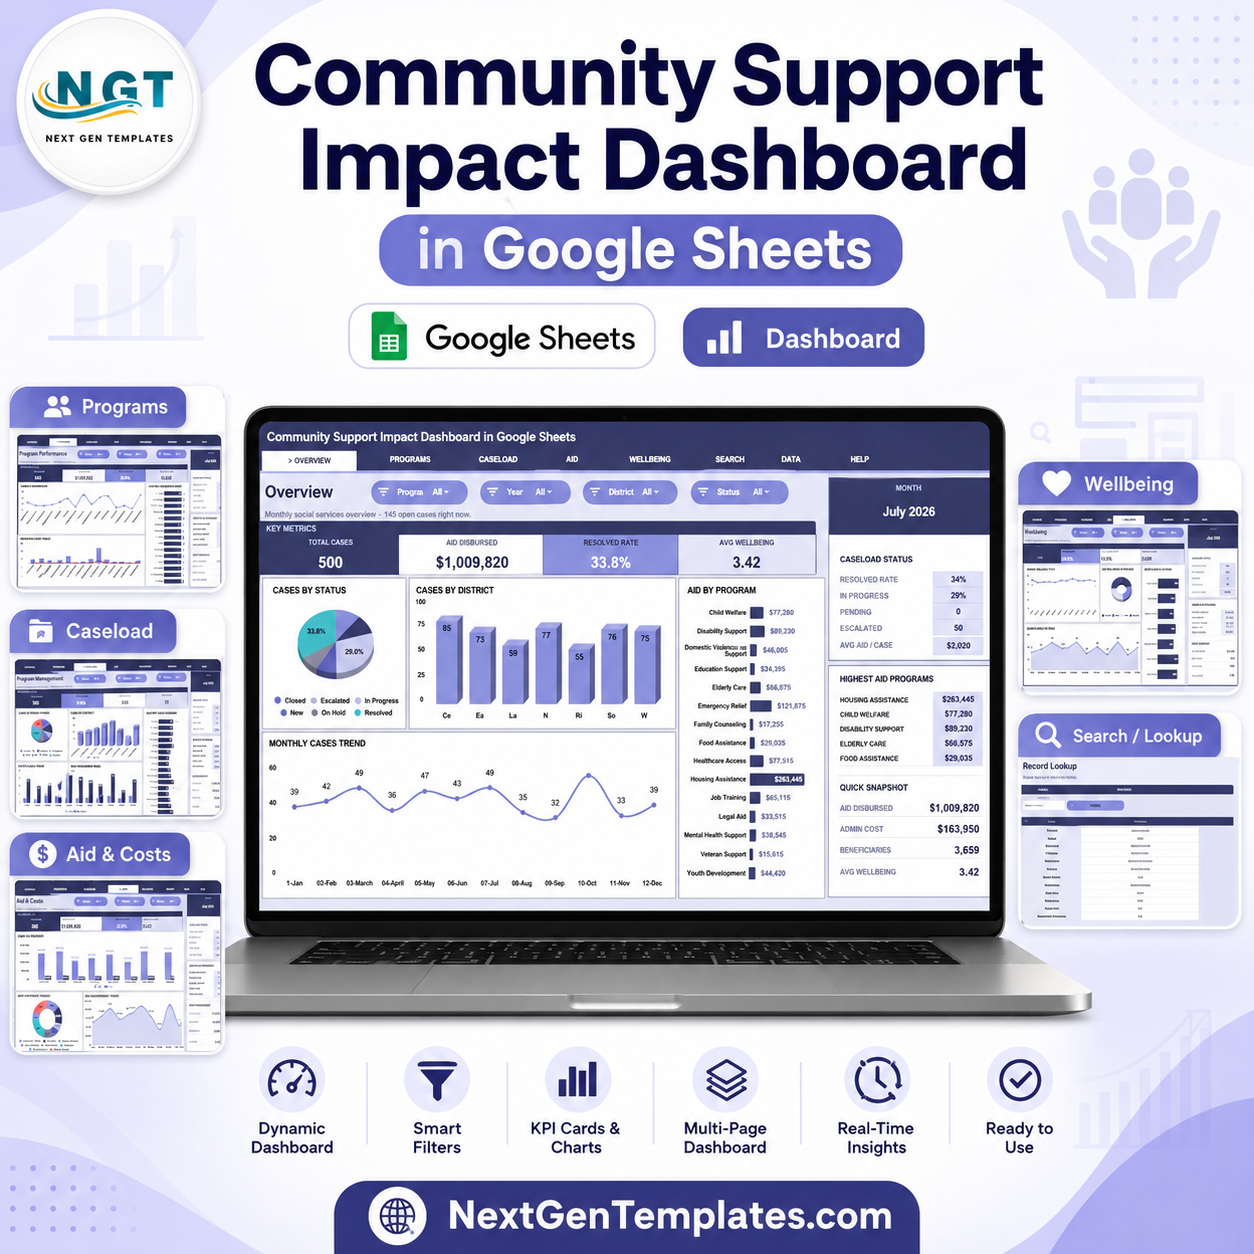
Community Support Impact Dashboard in Google Sheets gives nonprofits, NGOs, charities, relief teams, and community support programs a ready reporting system with 7 sheet tabs, 4 executive KPI cards, 15 analysis charts, and 1 case lookup view. Track Total Cases, Aid Disbursed, Resolved Rate, and Avg Wellbeing without building a dashboard from scratch. Built by PK, a Microsoft Certified Professional with 15+ years of Excel, Google Sheets, and Power BI experience and 300K+ subscribers across YouTube channels, this template is a one-time $9.99 purchase with no recurring software subscription.
Key Features of Community Support Impact Dashboard in Google Sheets
- 4 overview KPI cards for Total Cases, Aid Disbursed, Resolved Rate, and Avg Wellbeing.
- 5 analysis dashboard pages covering overview, program performance, caseload management, aid and costs, and wellbeing.
- Built-in slicers to filter charts quickly by available case, program, district, status, priority, team, and worker fields.
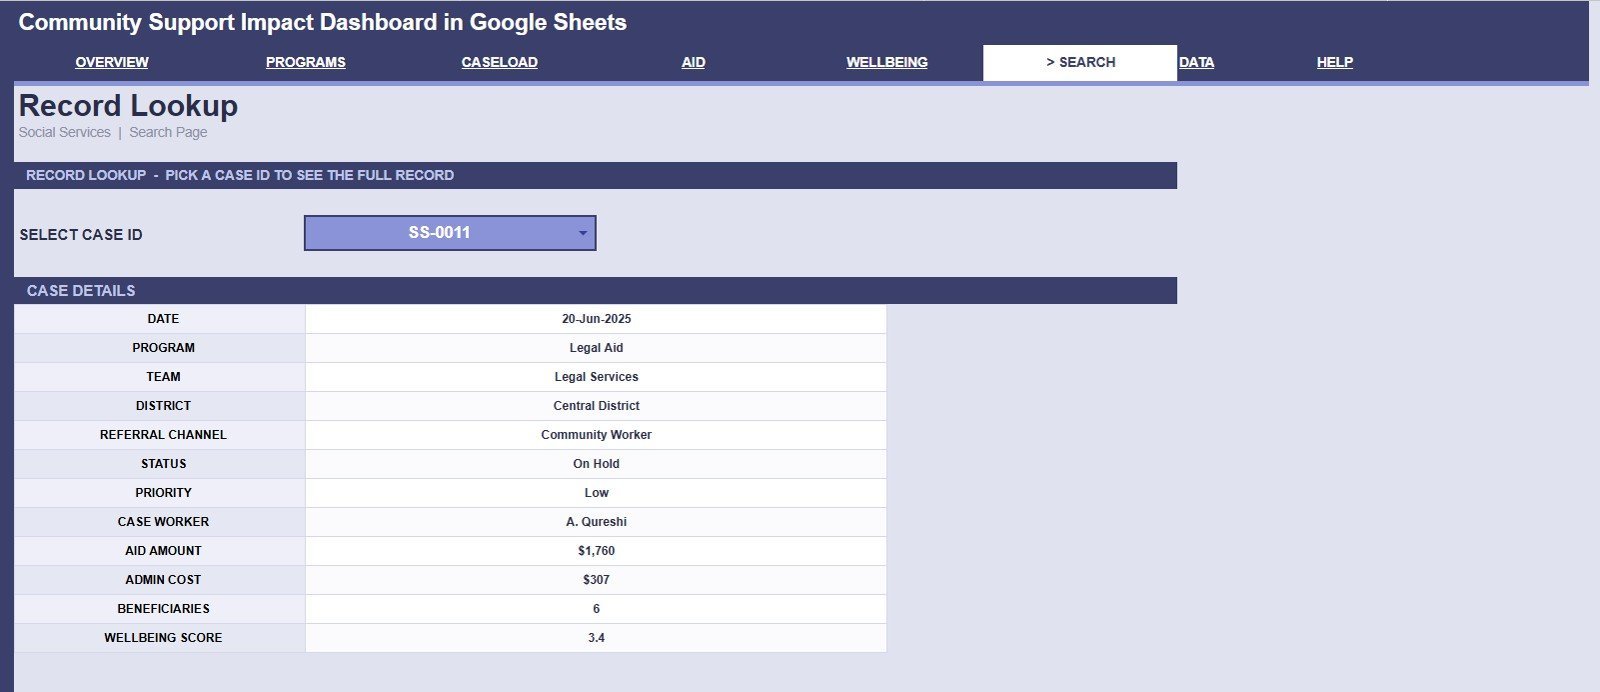
- Search sheet to select a Case ID and view a full case record in one place.
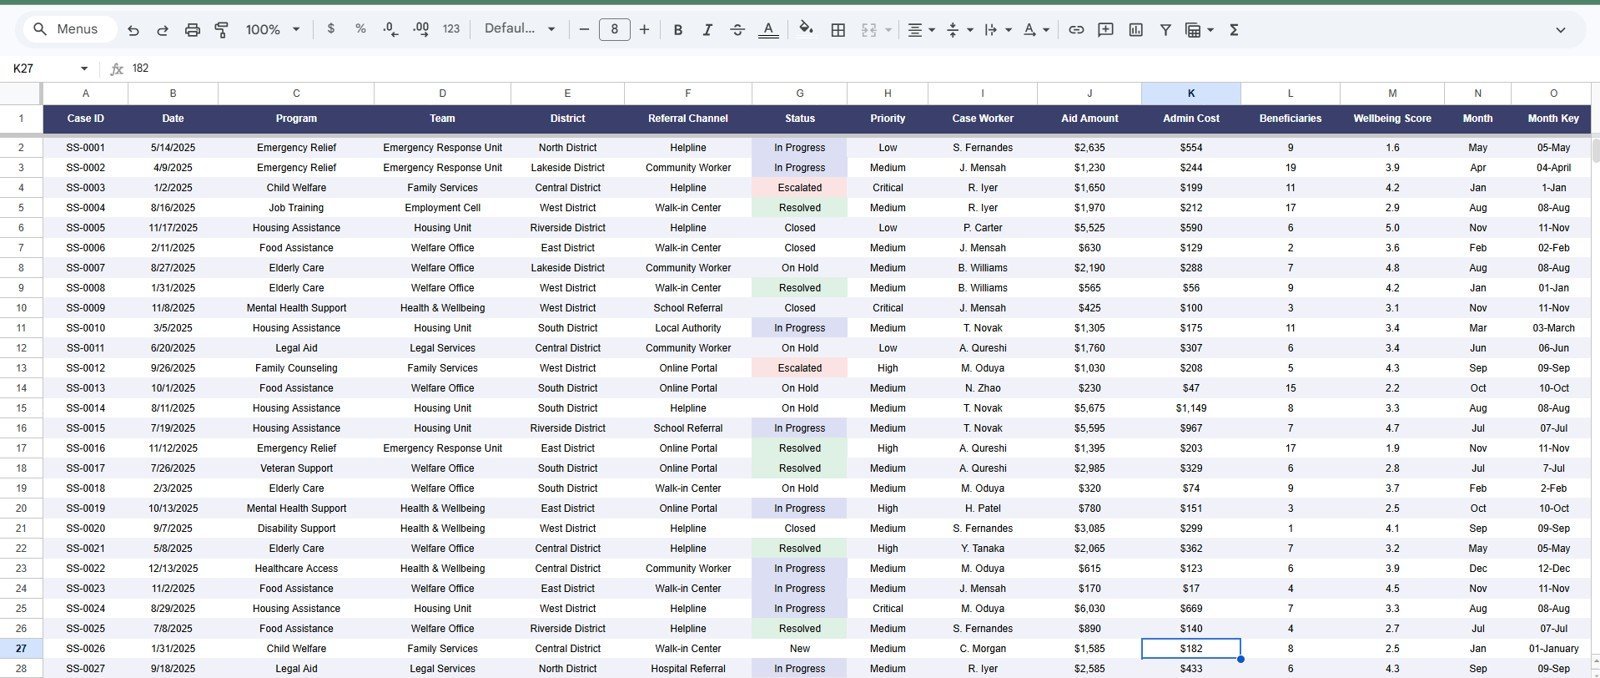
- Structured data tab for adding cases in the same format so charts and lookup views stay connected.
- Editable Google Sheets format for sharing, customizing, and reviewing with distributed teams.
What’s Inside the Community Support Impact Dashboard in Google Sheets
Overview Page
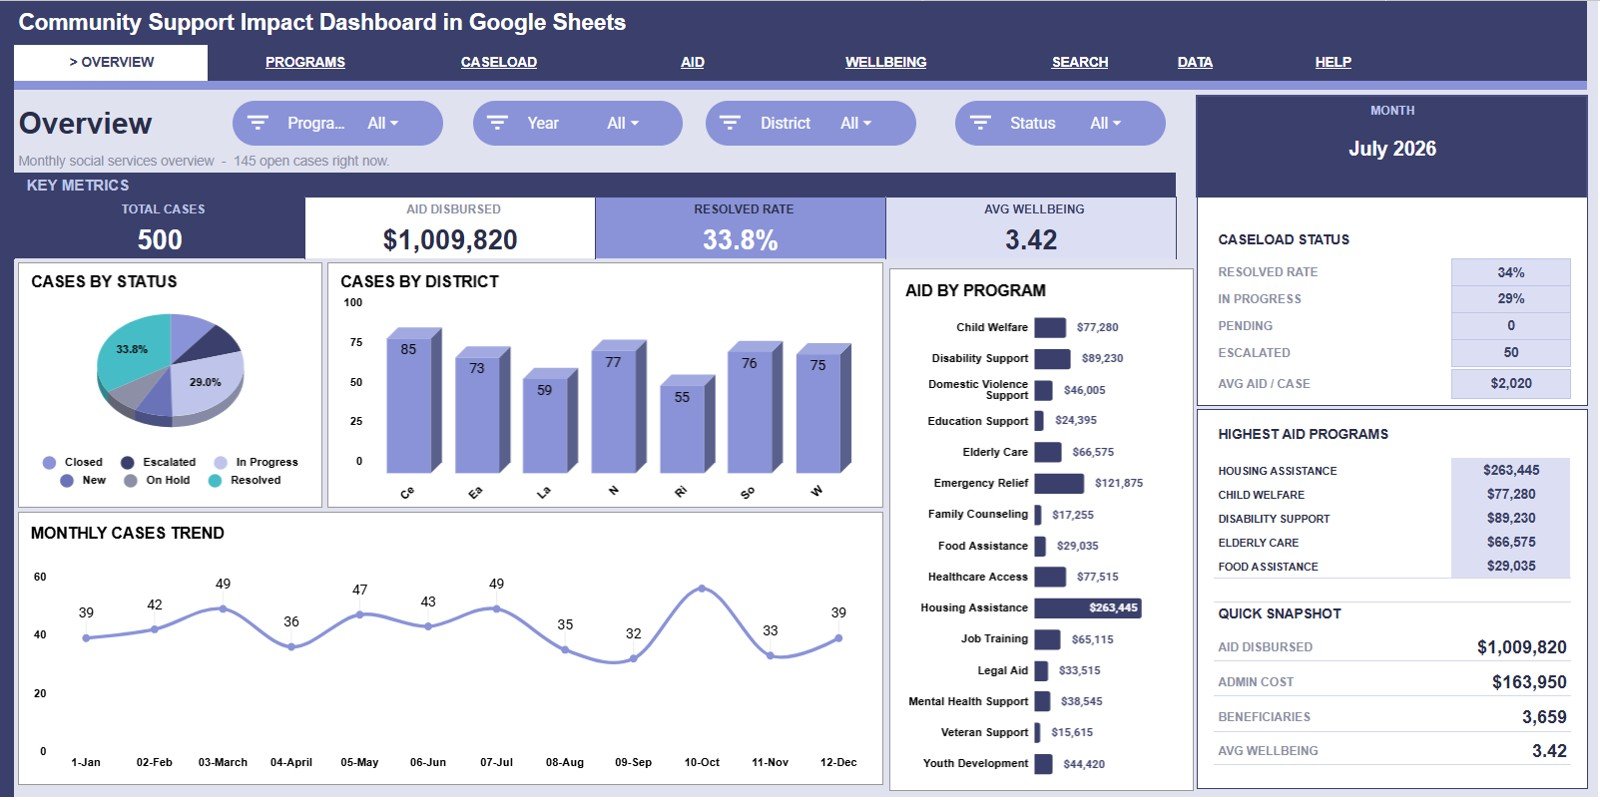
The Overview page provides high-level visibility into community support operations. The cards summarize Total Cases, Aid Disbursed, Resolved Rate, and Avg Wellbeing, while slicers help users filter the dashboard quickly.
Cases by Status: This chart shows how active, resolved, pending, or escalated cases are distributed. It helps teams see workload health and spot bottlenecks before reviews.
Cases by District: This chart compares case volume across districts. It helps managers identify areas with higher support demand and adjust outreach or staffing.
Aid by Program: This chart shows how aid is distributed across programs. It helps finance and program leads compare funding flow by service area.
Cases by Month: This trend shows how case volume changes over time. It helps teams identify seasonal pressure, campaign effects, or emerging needs.
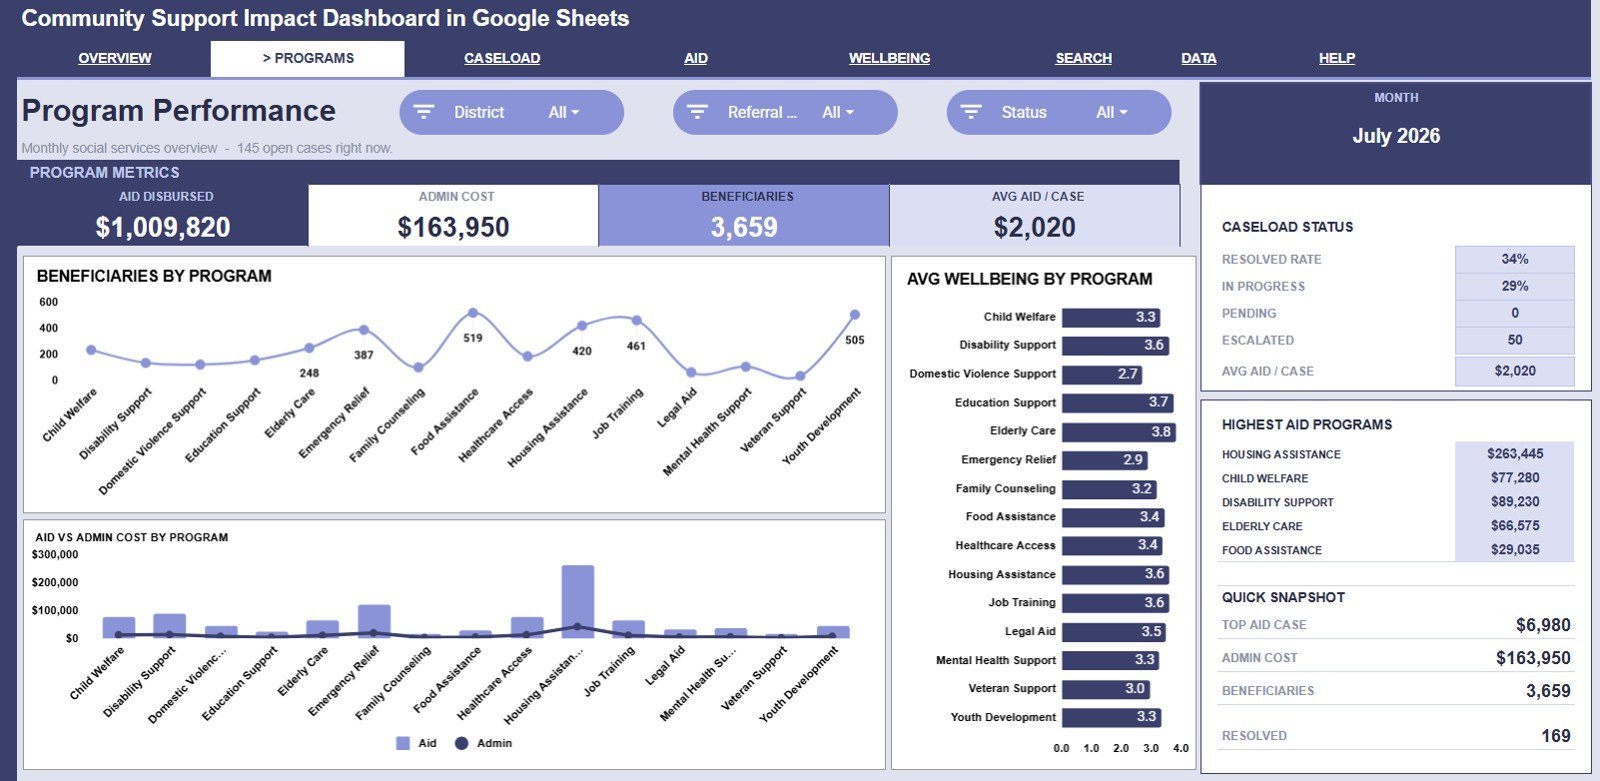
Program Performance
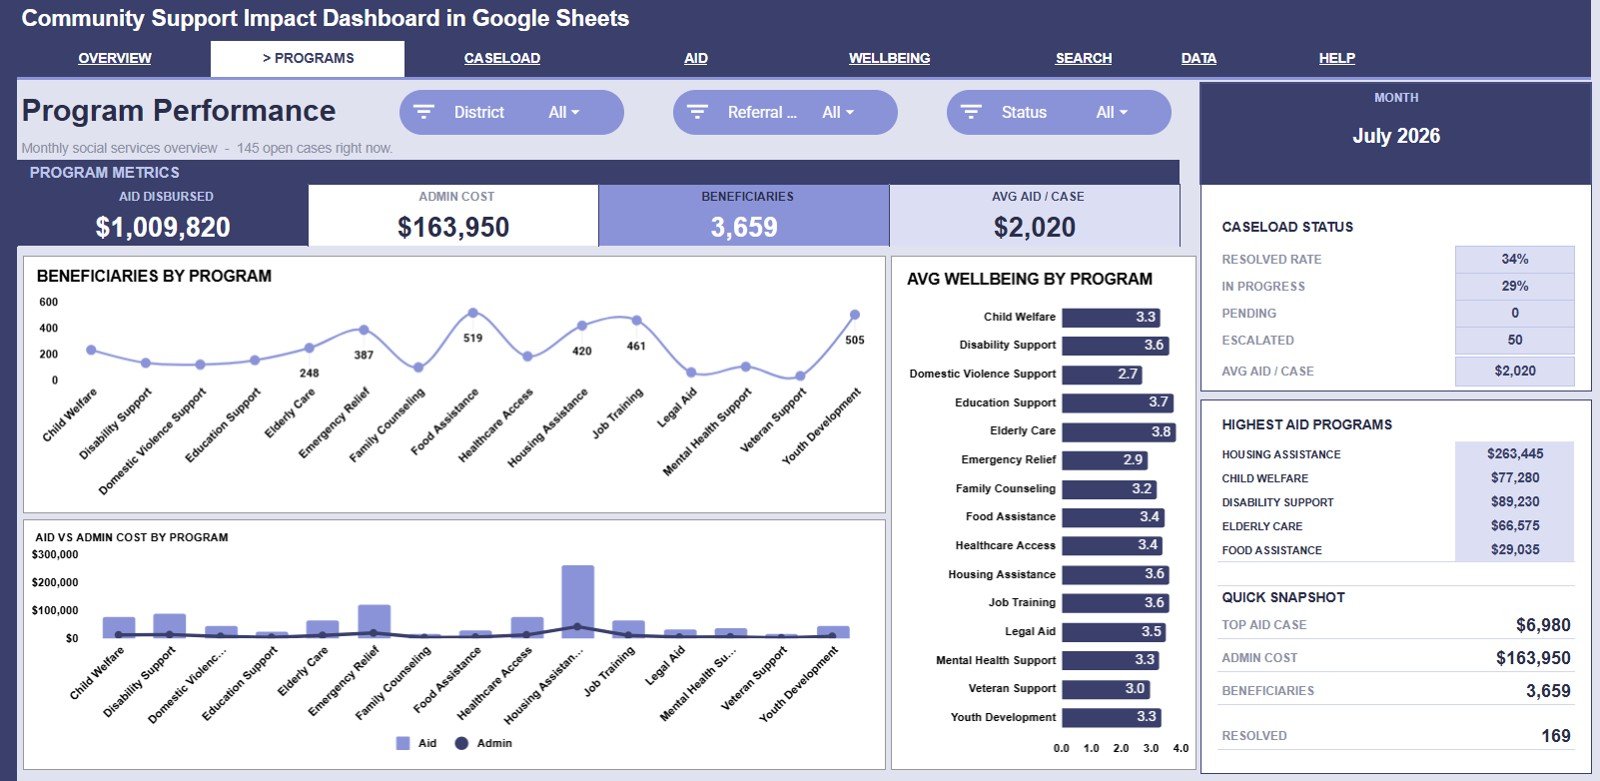
The Program Performance tab compares program reach, spending, and wellbeing outcomes. Beneficiaries by Program shows which support programs serve the most people. Aid and Admin Cost by Program helps compare direct support against delivery cost. Avg Wellbeing by Program shows where support may be improving client outcomes.
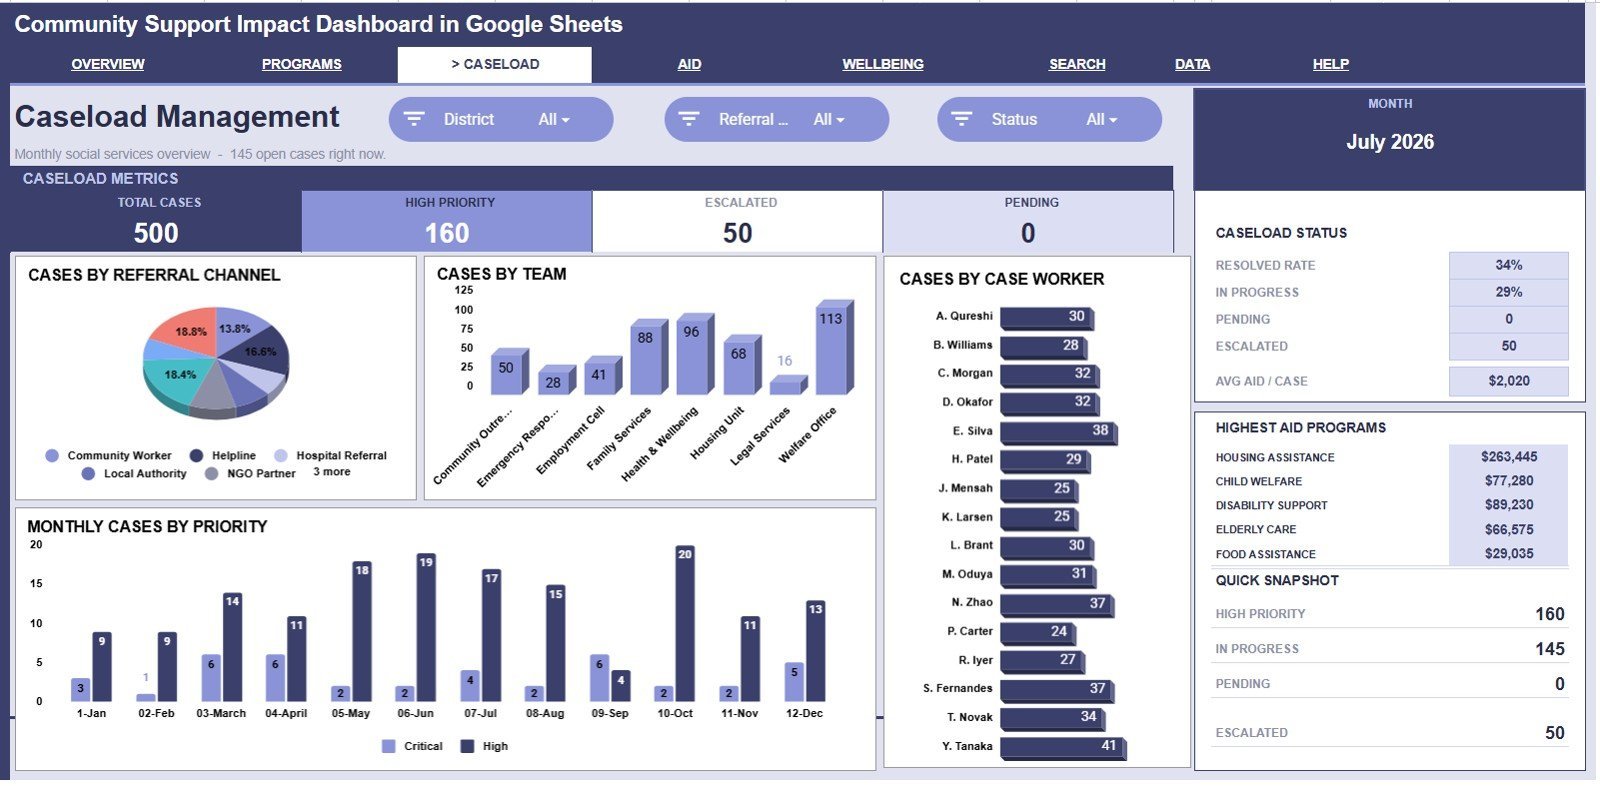
Caseload Management
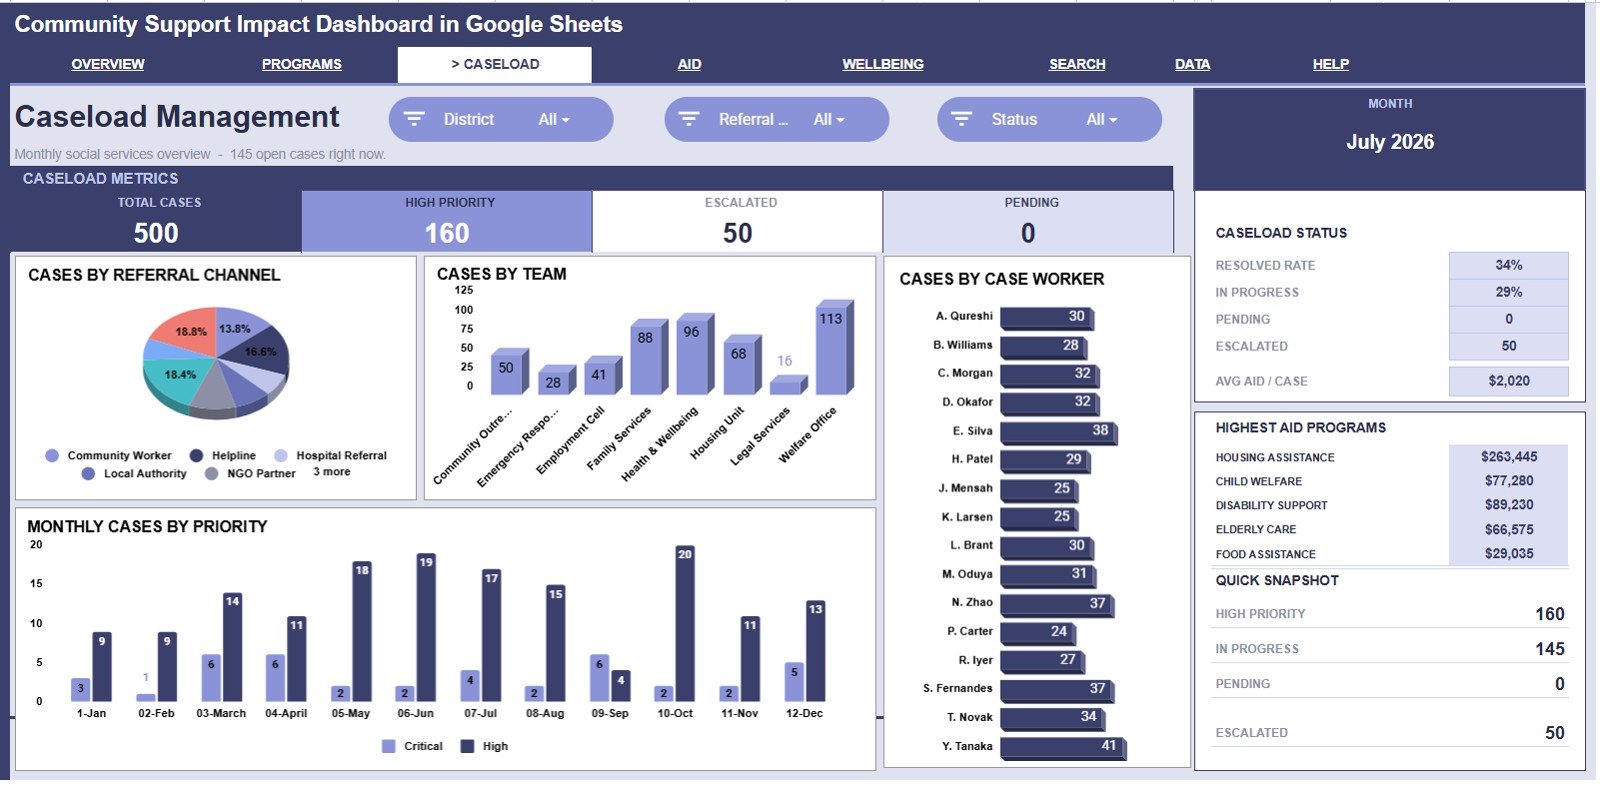
The Caseload Management tab helps supervisors review operational workload. Cases by Referral Channel shows where cases come from, Cases by Team compares team volume, Cases by Case Worker supports workload balancing, and Cases by Priority and Month highlights urgent demand patterns.
Aid and Costs
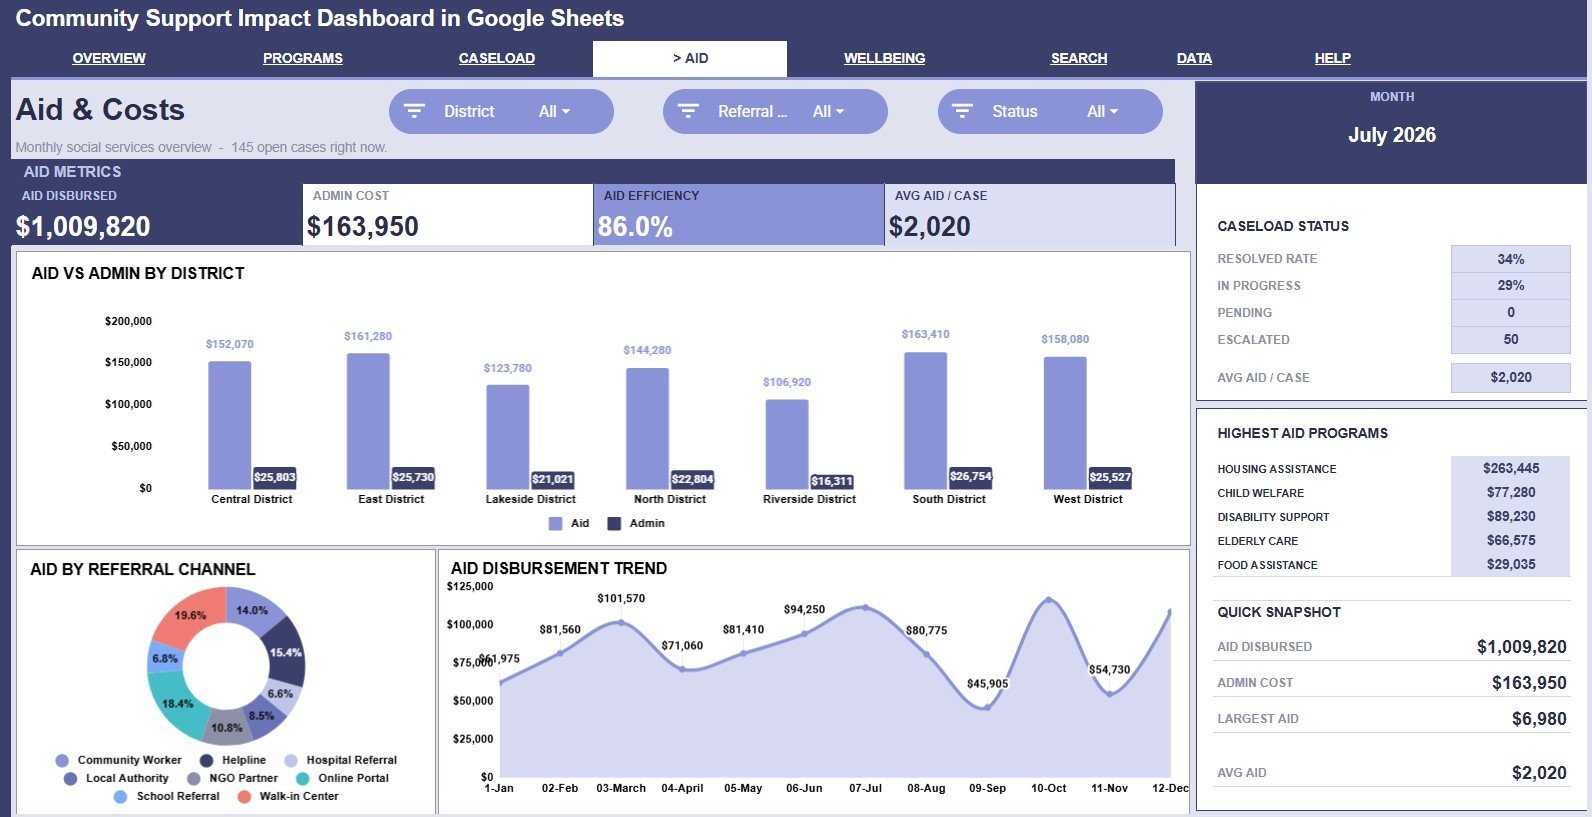
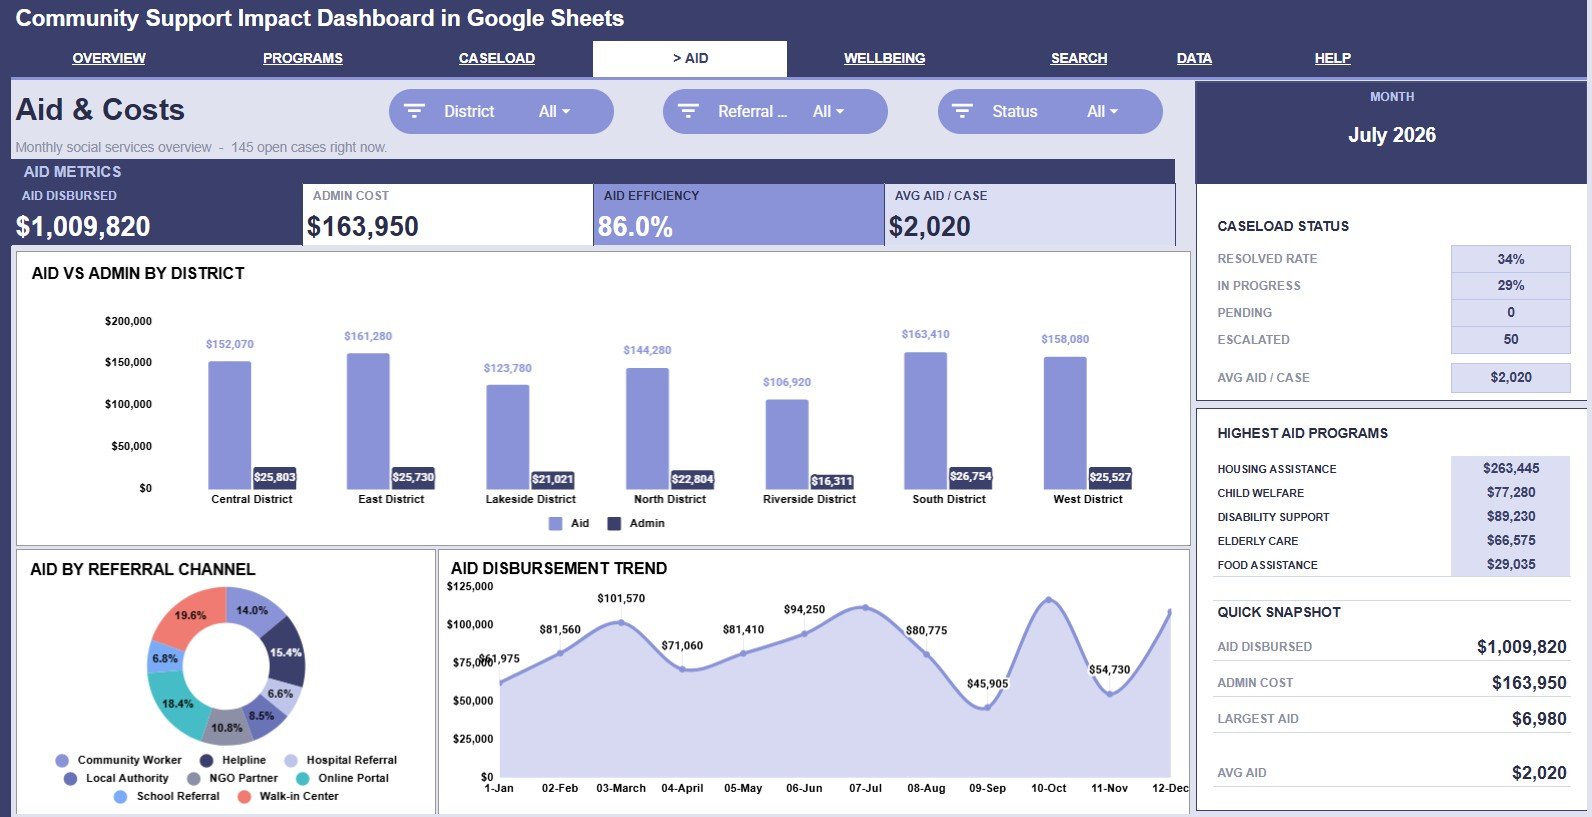
The Aid and Costs tab focuses on financial visibility. Aid and Admin Cost by District compares where support money and delivery costs are concentrated. Aid by Referral Channel connects spending to intake sources, and Aid Disbursement by Month shows how support changes across time.
Wellbeing
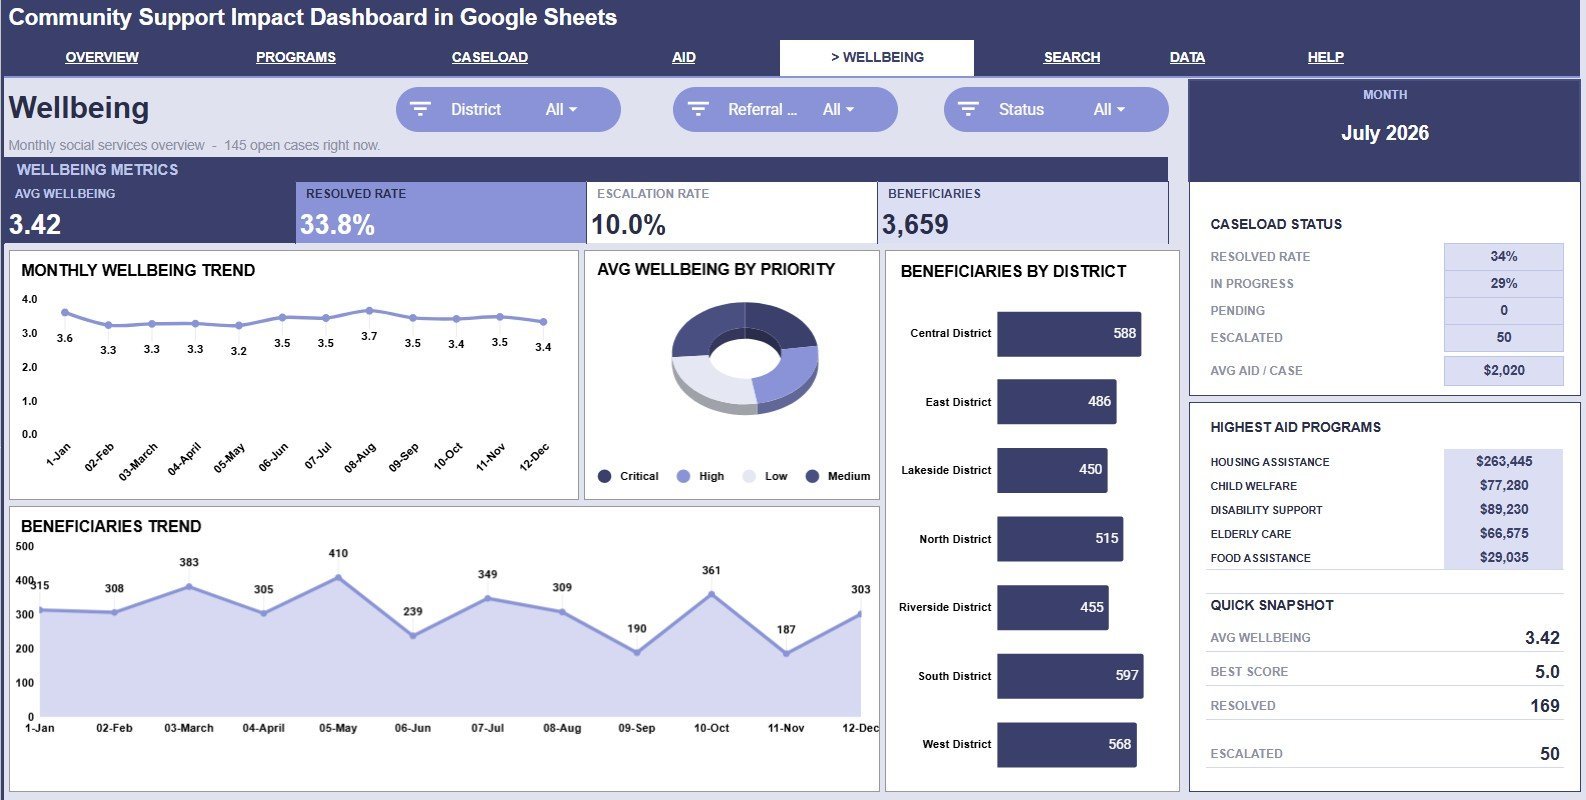
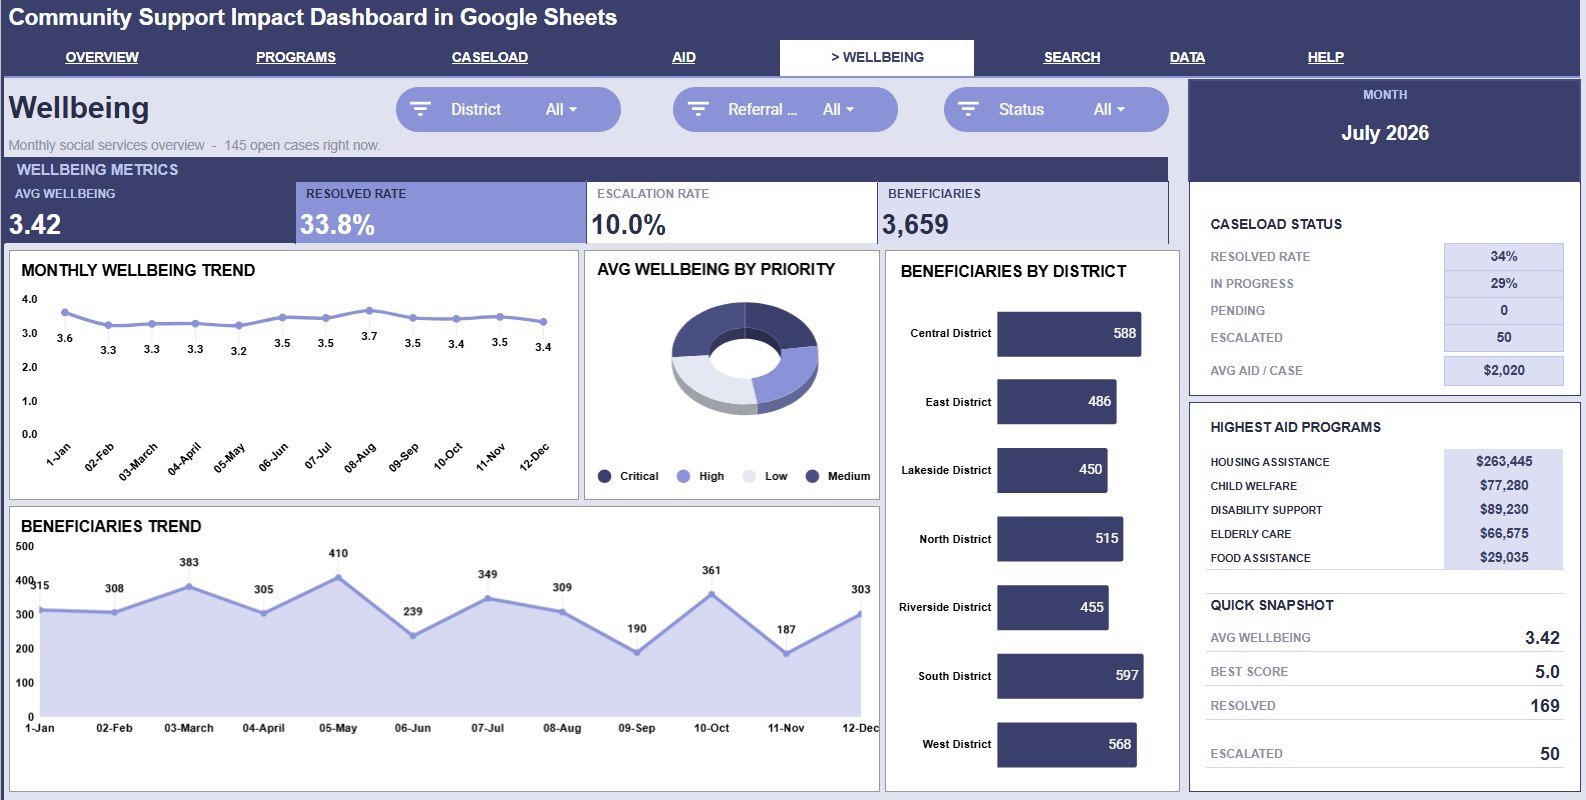
The Wellbeing tab is built for impact review. Avg Wellbeing by Month shows trend movement, Avg Wellbeing by Priority compares outcomes by urgency, Beneficiaries by District shows reach by geography, and Beneficiaries by Month tracks service volume over time.
Search Sheet Tab
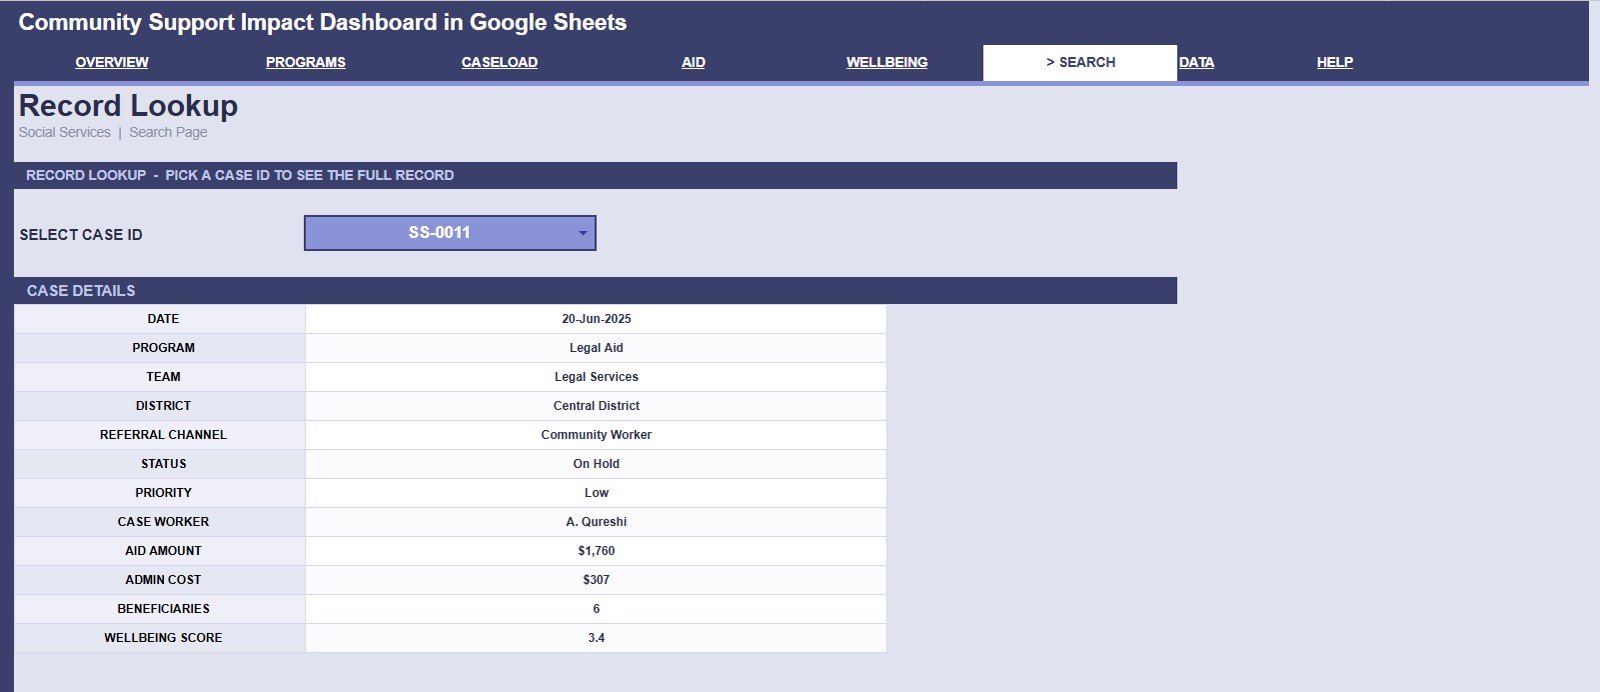
The Search sheet lets you select a Case ID from a dropdown and view the full case record, including date, program, team, district, referral channel, status, priority, case worker, aid amount, admin cost, beneficiaries, and wellbeing score.
Data Sheet Tab
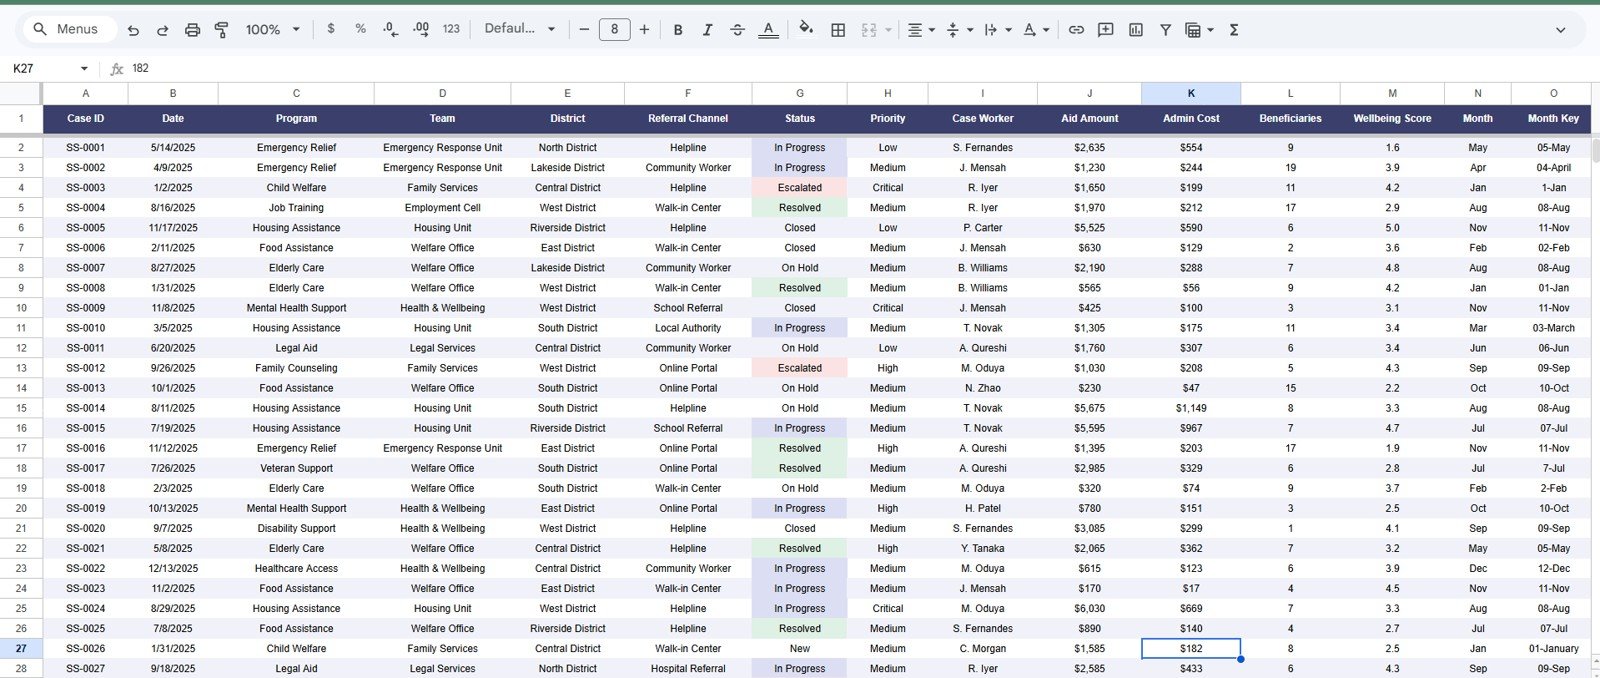
The Data sheet is where you add support case records in the same column format. Keeping the structure consistent helps the slicers, charts, KPI cards, and search sheet update correctly.
Community Support Impact Dashboard in Google Sheets vs. Microsoft Excel vs. Paid Case Management SaaS – Where This Fits
| Feature | This Google Sheets Dashboard | Microsoft Excel Dashboard | Paid Case Management SaaS |
|---|---|---|---|
| Cost | $9.99 one-time | One-time template cost | Monthly or annual subscription |
| Platform | Google Sheets in browser | Excel desktop or online | Vendor cloud platform |
| Setup time | Copy file, replace data, review | Open workbook, replace data | Configuration and onboarding |
| Real-time collaboration | Built into Google Sheets | Requires shared cloud file | Usually included |
| Customizable fields | Editable sheet, charts, and labels | Editable workbook | Often limited by plan |
| Case lookup | Included Search Sheet | Possible with formulas | Included |
| Year-1 cost at 5 users | $9.99 plus Google account access | Template cost plus Microsoft access | Often hundreds or thousands |
Who This Template Is For – and Who It’s Not For
This template is for nonprofits, NGOs, local aid teams, community outreach programs, social service coordinators, grant-funded support teams, and analysts who need a clear case-and-impact dashboard in Google Sheets.
It is not a full case management application. It does not process payments, automate intake forms, send SMS updates, manage legal compliance workflows, or replace a secure client database for sensitive case records.
How to Use the Community Support Impact Dashboard in Google Sheets
- Open the PDF guide from your download and copy the Google Sheets template to your Drive.
- Go to the Data Sheet and replace sample rows with your own case records.
- Keep the columns in the same format so charts and slicers remain connected.
- Use slicers on each dashboard page to filter by program, team, district, status, priority, and related fields.
- Open the Search Sheet and select a Case ID for a full case-level view.
- Share the file with your team using Google Sheets permissions.
Real-World Use Cases
Meera, Program Director: Meera reviews Aid by Program, Beneficiaries by Program, and Avg Wellbeing by Program before her monthly funder update.
James, Casework Supervisor: James uses Cases by Team and Cases by Case Worker to balance workload and prioritize escalated cases.
Ana, Finance Coordinator: Ana checks Aid and Admin Cost by District and Aid Disbursement by Month before reconciling support payments.
Frequently Asked Questions
What does this dashboard track?
It tracks cases, aid disbursed, resolved rate, wellbeing score, programs, teams, districts, referral channels, statuses, priorities, case workers, beneficiaries, admin cost, and monthly trends.
How many sheet tabs are included?
The template includes 7 tabs: Overview, Program Performance, Caseload Management, Aid and Costs, Wellbeing, Search Sheet, and Data Sheet.
Does it work in Google Sheets?
Yes. The template is built for Google Sheets and can be copied into Google Drive for editing and sharing.
Can I customize the dashboard?
Yes. You can edit labels, fields, charts, colors, formulas, and data fields to match your reporting process.
Does it replace case management software?
No. It is a reporting dashboard for structured case data, not a secure client database or workflow automation platform.
Is a file download attached now?
The product is prepared as a draft. Add the final digital file URL before publishing so customers receive the correct Google Sheets copy guide.
About the Author
Built by PK – Microsoft Certified Professional with 15+ years of Excel, Google Sheets, and Power BI experience. Founder of NextGenTemplates, reaching 300K+ subscribers across YouTube channels. Every template is hand-built and tested before release.
Explore Related Templates
Also see Nonprofit Organizations Dashboard in Google Sheets, Membership Growth and Churn Analysis Dashboard in Google Sheets, Non-Profit KPI Scorecard in Excel, and Community Development KPI Dashboard in Excel. Browse more Google Sheets templates and Google Sheets Dashboard templates.
Watch the step-by-step video Demo:
Download the Community Support Impact Dashboard in Google Sheets to turn case, aid, cost, and wellbeing records into a clear reporting dashboard for program reviews.
Last updated: July 25, 2026.