




The Knowledge Management KPI Dashboard in Excel is an essential tool for organizations looking to track, measure, and improve their knowledge management (KM) efforts. Whether you’re managing internal knowledge sharing, document storage, or employee learning, this dashboard offers a comprehensive solution to help you effectively measure and optimize your KM strategies.
Designed for managers, HR teams, and knowledge management professionals, this Excel-based dashboard consolidates key performance indicators (KPIs) related to knowledge sharing, employee collaboration, and the accessibility of company knowledge. With real-time data tracking, easy-to-understand charts, and customizable KPIs, this dashboard helps organizations ensure that valuable knowledge is accessible, utilized, and effectively managed to drive growth and productivity.
Key Features of the Knowledge Management KPI Dashboard in Excel
📚 Track Knowledge Sharing Metrics
Monitor how effectively knowledge is being shared across teams and departments. Track KPIs such as the number of knowledge articles created, the frequency of updates, and the use of knowledge-sharing tools within your organization.
🤝 Collaboration & Employee Engagement
Measure employee collaboration levels, including participation in knowledge-sharing activities, internal forums, and collaborative projects. This helps gauge engagement and identify areas for improvement in team collaboration.
💡 Knowledge Accessibility & Utilization
Track the accessibility of knowledge resources and how frequently they are used. Measure the impact of training materials, document repositories, and internal databases on employee performance.
📈 Knowledge Retention & Quality
Track knowledge retention rates and assess the quality of knowledge assets created within the organization. Identify gaps in knowledge coverage and ensure that key knowledge is retained and transferred effectively.
📝 Customizable KPIs & Metrics
Tailor the dashboard to meet your organization’s unique knowledge management goals. Add, remove, or modify KPIs based on your specific needs, such as employee learning, system adoption rates, or the effectiveness of knowledge programs.
📊 Visual Data Insights & Reporting
Generate insightful reports and visualizations that provide a quick snapshot of your organization’s knowledge management performance. Use charts and graphs to present KPIs to stakeholders, managers, or team leads.
Why You’ll Love the Knowledge Management KPI Dashboard in Excel

✅ Optimize Knowledge Sharing
Track the flow of information within your organization and identify bottlenecks in knowledge sharing. Ensure that knowledge is easily accessible to employees to improve efficiency and collaboration.
✅ Increase Employee Engagement
By monitoring employee participation in knowledge-sharing initiatives, you can identify trends and take steps to foster greater engagement. Encourage employees to contribute and collaborate effectively.
✅ Improve Knowledge Utilization
Monitor the usage of knowledge resources and ensure that employees are actively leveraging available resources. Optimize the accessibility of knowledge to improve productivity and decision-making.
✅ Ensure Knowledge Retention
Track knowledge retention rates to make sure critical knowledge is captured and shared effectively. Preserve valuable intellectual capital to avoid knowledge loss due to employee turnover.
✅ Customizable & Scalable
The dashboard is fully customizable, allowing you to tailor KPIs, reports, and visualizations to your organization’s specific knowledge management needs. Whether you are a small business or a large enterprise, this dashboard grows with you.
What’s Inside the Knowledge Management KPI Dashboard Template in Excel?
- Knowledge Sharing Metrics: Track knowledge articles, updates, and content contributions.
- Employee Collaboration: Measure participation in knowledge-sharing activities and collaborative projects.
- Knowledge Utilization: Monitor the usage of knowledge resources and employee engagement.
- Retention & Quality Metrics: Track knowledge retention and quality levels across the organization.
- Customizable KPIs & Reporting: Adjust KPIs and data visualizations based on your unique needs.
- Real-Time Data & Insights: Keep track of real-time performance with automated updates and visualizations.
How to Use the Knowledge Management KPI Dashboard in Excel
1️⃣ Download the Template: Get instant access to the Knowledge Management KPI Dashboard in Excel.
2️⃣ Input Your Data: Enter key performance data related to knowledge sharing, collaboration, and retention.
3️⃣ Track & Monitor KPIs: Use the dashboard to monitor KPIs such as article creation, employee participation, and knowledge usage.
4️⃣ Generate Reports & Insights: Generate reports and insights to identify trends, gaps, and areas for improvement.
5️⃣ Optimize Knowledge Management: Use the insights from the dashboard to make informed decisions that optimize knowledge sharing and improve organizational performance.
Who Can Benefit from the Knowledge Management KPI Dashboard in Excel?
🔹 Knowledge Management Teams
🔹 HR & Learning & Development Teams
🔹 Business Intelligence & Analytics Professionals
🔹 Project Managers & Team Leads
🔹 Organizational Development & Strategy Managers
🔹 Executives & Decision-Makers
Ensure that your organization’s knowledge is efficiently managed and accessible with the Knowledge Management KPI Dashboard in Excel. Track key performance metrics, optimize knowledge sharing, and enhance overall organizational performance.
Click here to read the Detailed blog post
Visit our YouTube channel to learn step-by-step video tutorials
Youtube.com/@PKAnExcelExpert
Compatibility and Requirements
- Works in Microsoft Excel desktop (Excel 2016 or later, or Microsoft 365).
- Results are shown in charts. Microsoft explains Excel charts in Create a chart from start to finish.
Frequently Asked Questions
Which KPIs does the Knowledge Management KPI Dashboard track?
It tracks knowledge articles created, how often content is updated, participation in knowledge sharing, use of knowledge resources, knowledge retention and the quality of knowledge assets.
Can I add or remove KPIs?
Yes. You can add, remove or change KPIs to match goals such as employee learning or system adoption.
Can I present the results to managers?
Yes. Charts and graphs give a quick snapshot of performance that you can share with stakeholders and team leads.
Is there a Power BI version?
Yes. The Knowledge Management KPI Dashboard in Power BI covers the same topic in Power BI.
Related Knowledge Management Templates
- Knowledge Management KPI Dashboard in Power BI: the same topic in Power BI
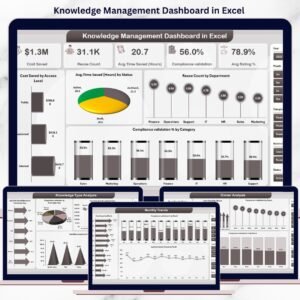
- Knowledge Management Dashboard in Excel: a full knowledge management dashboard in Excel
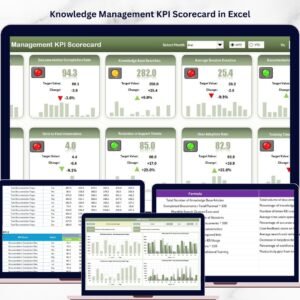
- Knowledge Management KPI Scorecard in Excel: a knowledge management KPI scorecard in Excel
- Knowledge Management Dashboard in Google Sheets: a knowledge management dashboard in Google Sheets
- HR & Workforce Analytics Bundle: 10 HR and workforce templates in one download
Browse all Excel KPI dashboards or the Excel HR and payroll templates.





























Reviews
There are no reviews yet.